Macro Extremes (week ending March 15, 2024)
March 17, 2024 Leave a comment
A weekly Macro, Cross Asset review of prices trading at extremes which may generate future investment ideas and opportunities.
The following assets (on a weekly timeframe) either registered an Overbought or Oversold reading and/or have traded more than 2.5 standard deviations above or below its rolling mean.
Extremes “above” the Mean (at least 2.5 standard deviations
U.S. 3 month bill yield
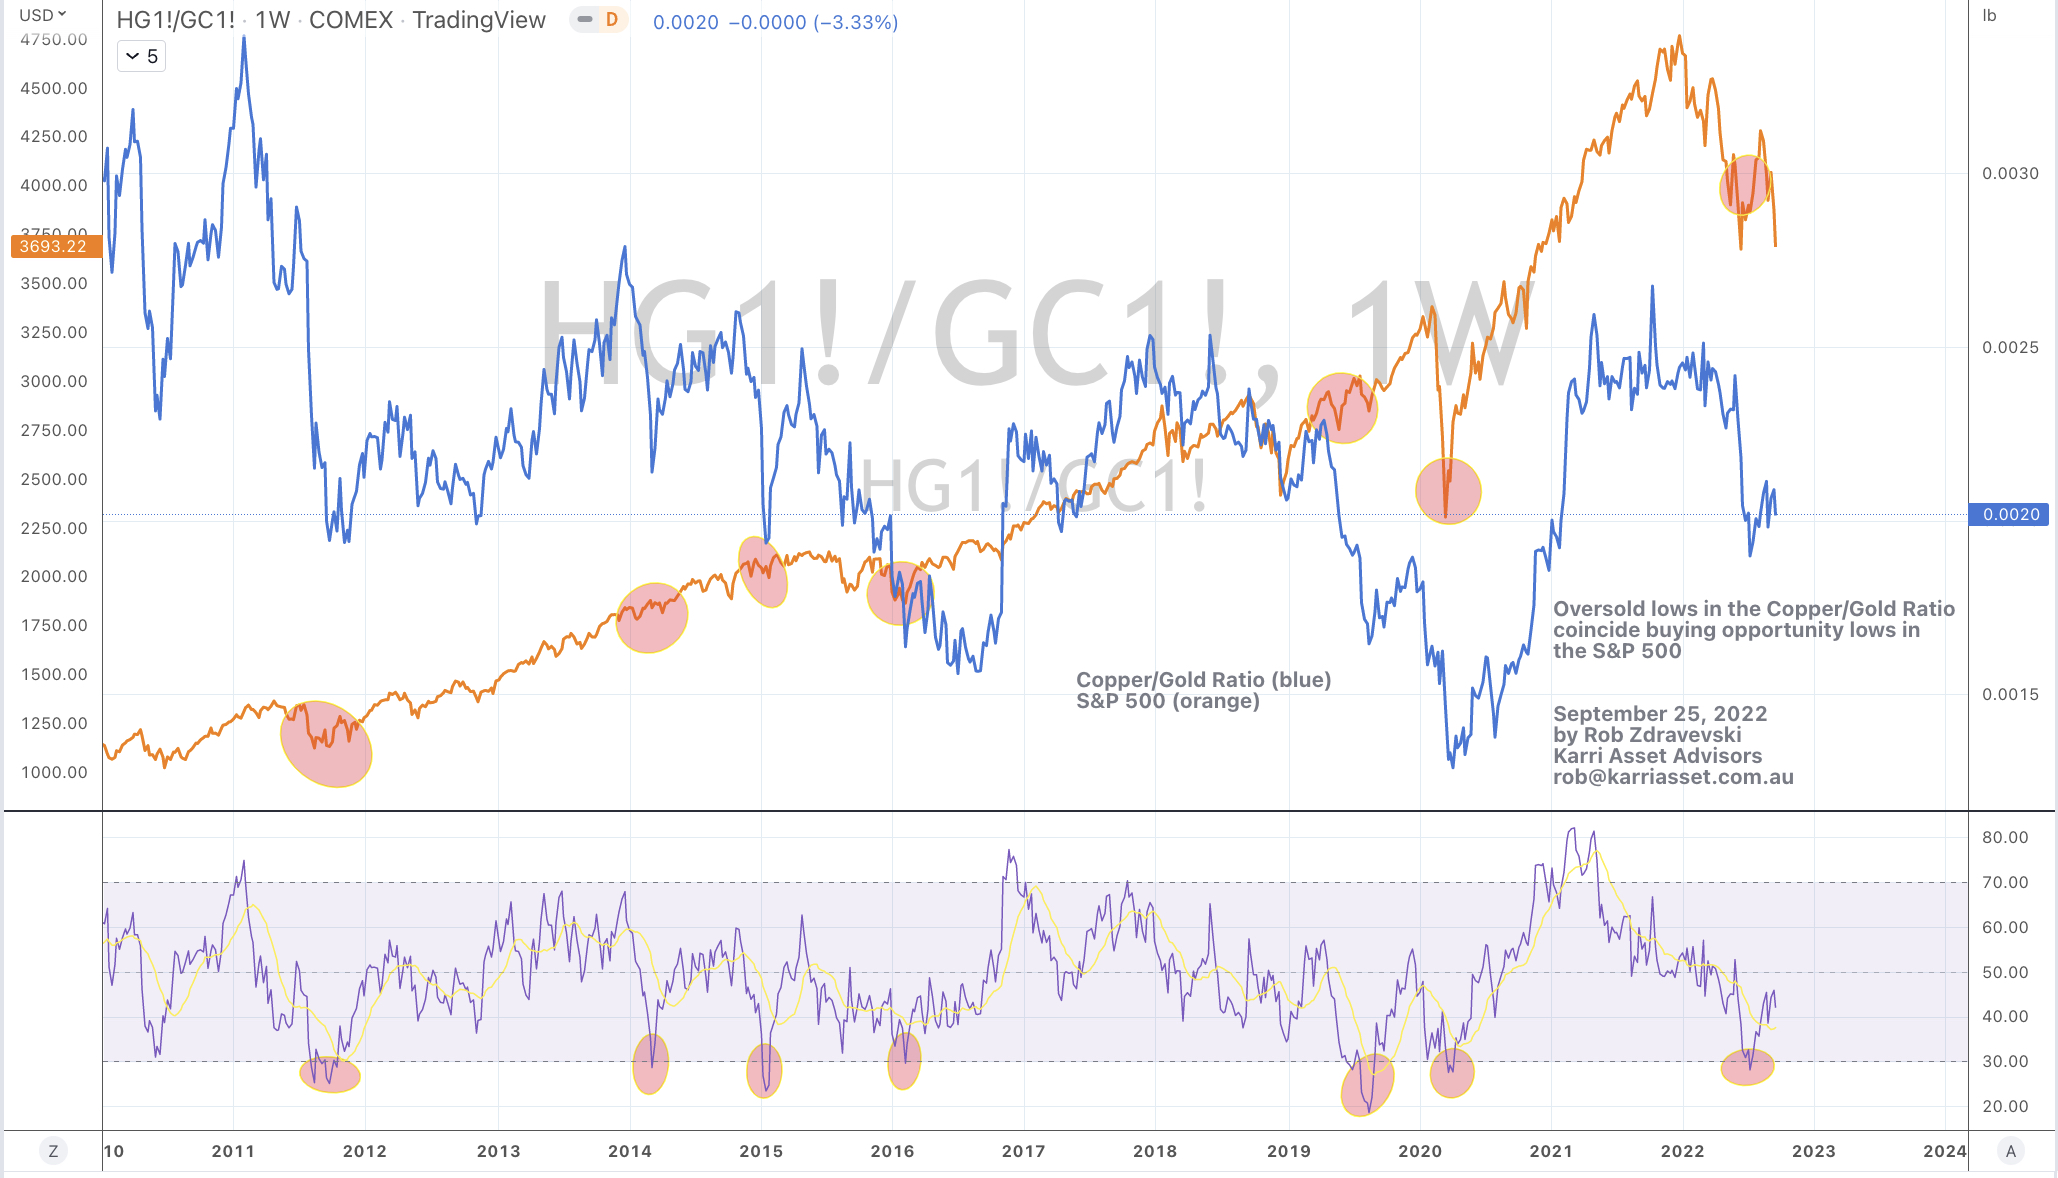
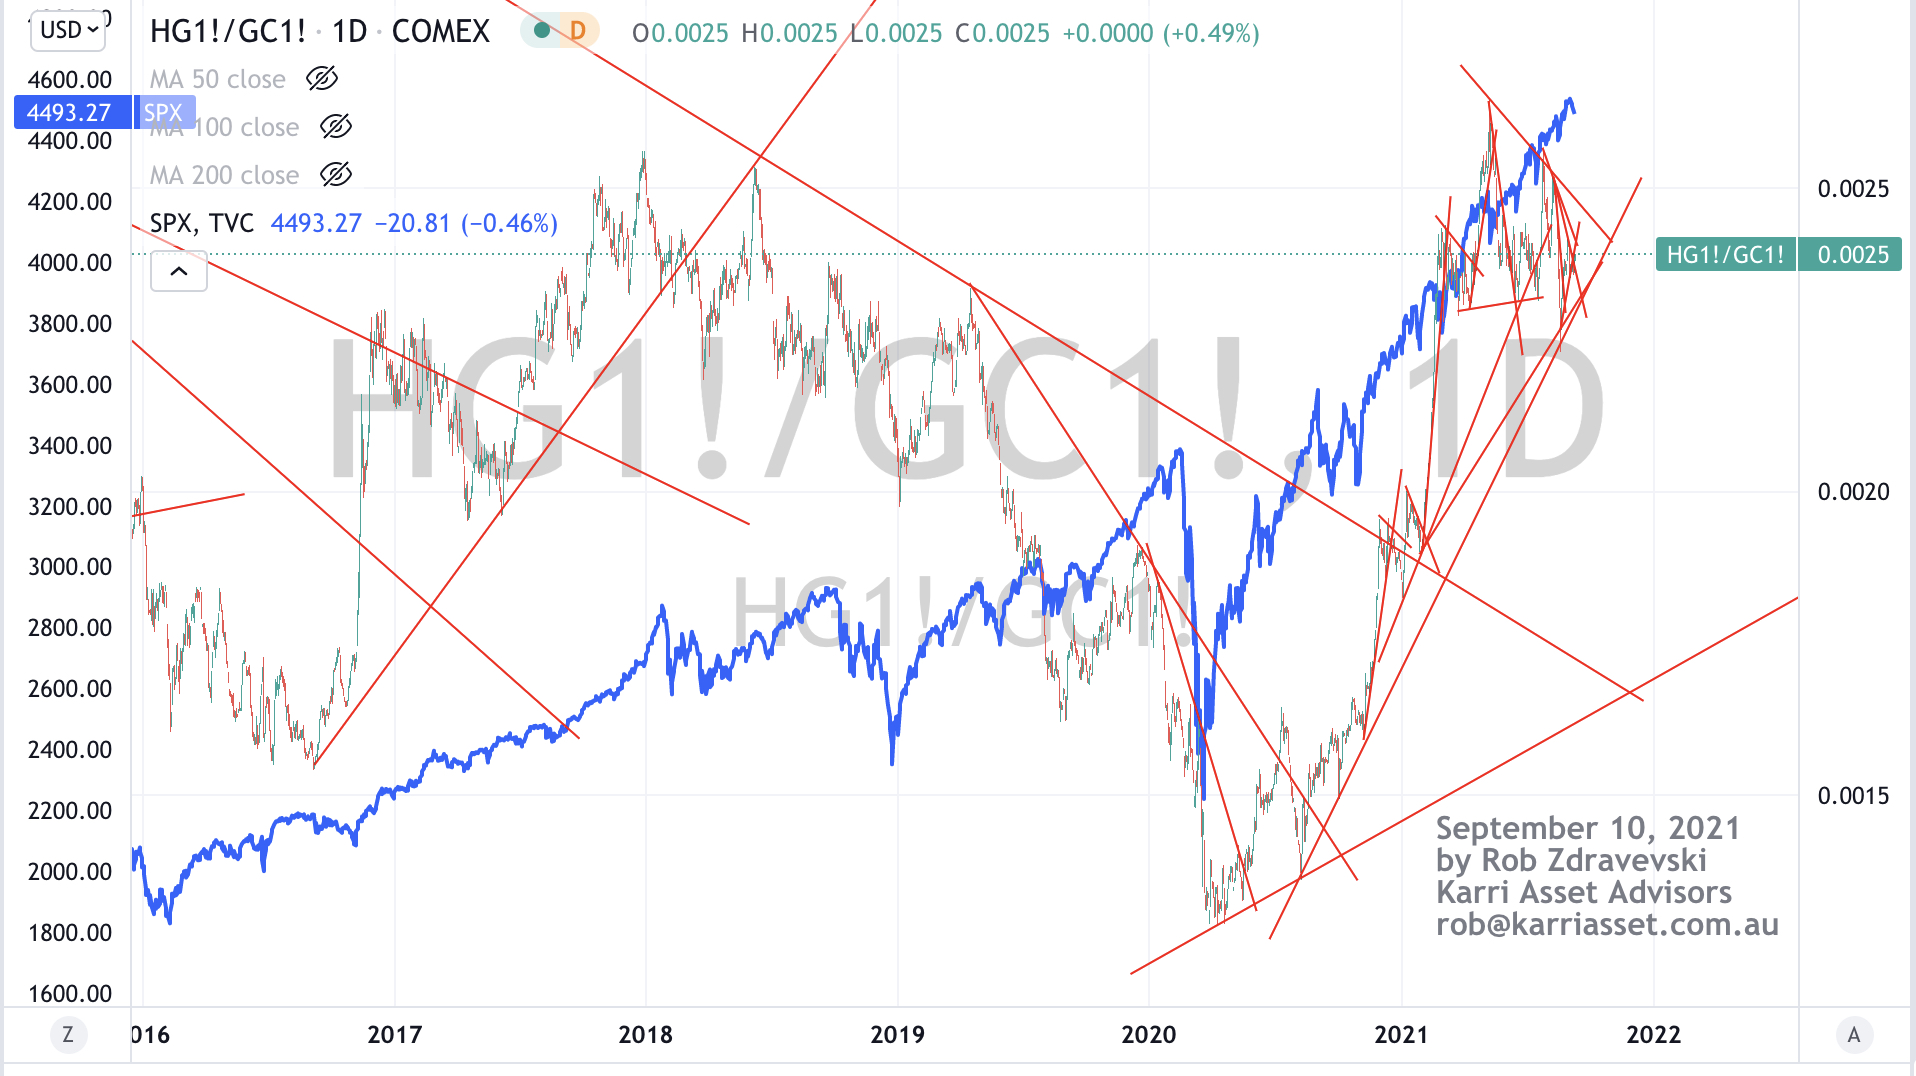
Copper
Gasoline
Silver in AUD, EUR, JPY and CHF
Gold in USD, GBP , ZAR, CAD and EUR
Overbought (RSI > 70)
Biodiesel
Robusta Coffee
AEX
Budapest
CAC 30
DAX
Italy’s MIB
KLSE
Stockholm
And the S&P 500 Index
The Overbought Quinella – Both Overbought and Traded at > 2.5 standard deviations above the weekly mean)
Russian 10 year bond yield
Gold in AUD, CHF & JPY
Cocoa
Rubber
Egypt 30 Index
TAIEX
Extremes “below” the Mean (at least 2.5 standard deviations)
Australian Coking Coal
Iron Ore
Oversold (RSI < 30)
Chinese 10 year government bond yields
Lithium Hydroxide
The Oversold Quinella – Both Oversold and Traded at < 2.5 standard deviations below the weekly mean)
None
Notes & Ideas:
Government bond yields were mostly higher while many remain trendless.
All yields were lower, except for the Japanese, again.
Japanese 2’s eased away from overbought territory and broke its 8 week rising streak.
The Japanese 5’s winning streak extends to 6 weeks.
Russian 10 year yields have risen for 7 consecutive weeks.
The Chinese 10’s are the notable oversold extreme in this week’s list.
Equities were mixed. Most finished the week 1% of either of side of last weeks close.
Some European bourses continue their winning ways such as Spain, France and Italy as do the recently shunned Chinese indices.
While U.S. indices eased lower and some have commenced something resembling a retracement some weeks ago.
Australian indices were amongst the largest decliners.
The Shanghai Composite and the CSI 300 have put together a 5 week winning streak, the DAX is at 6 weeks, while the Philippines main index broke its 7 week winning streak and the S&P Midcaps snapped its 9 weeks run of advances.
As a result, the MidCap 400 isn’t overbought this week.
Copenhagen isn’t overbought either, nor the Nikkei 225, the NIFTY 50, the FTSE All World (developed ex-USA) index, SENSEX, the SOX and the Nasdaq Transports.
The Nasdaq Composite and Nasdaq 100 aren’t overbought anymore either.
Toronto’s TSX is in a 5 week winning streak.
Vietnam’s main index is nearing overbought territory.
Mexico broke its 5 week losing streak.
Brazil’s BOVESPA has bucked the direction of most global bourses by falling 5.2% since its Christmas overbought reading.
Intra-week, Russia’s MOEX 10 made another all-time high but didn’t close there.
The S&P 500 is still overbought. This week’s decline of 0.1% means it has only declined for 4 weeks of the past 20 weeks.
The CAC and DAX are still making new all-time highs.
Spain’s IBEX is at its highest point since January 2018 and is nearing an interesting overbought scenario.
The Dow Jones Industrial Average took a vacation from its 13 week stay in overbought territory.
And Italy’s MIB has traded to its highest point since May 2008.
Commodities were generally higher.
Oils, distillates and most gases (except for Henry Hub Natural Gas) had a good week, which weigh heavily on the performance of the broader commodity tracking indices.
As a result, JKM LNG isn’t oversold this week.
Inversely, Henry Hub Natural Gas prices fell 8% to close at an all-time low. This is another example of a parabolic price move being thumped. I’m watching closely for developing strength in this downward trend. Should it gather steam, a visit to $1.20 wouldn’t be out of the question. That’s quite move from $11 from only 20 months ago.
While Gold prices took a breather, its price remains in overbought territory across various currencies.
AUD Gold remains 23% above its 200 week moving average.
Other precious metals had a good week too, with Palladium outpacing Silver.
Cocoa went super parabolic rising 25% for the week and has now spent 21 weeks in overbought land.
Coal was a loser again.
Raw Cane Sugar recovered all of last weeks decline.
Grains, Precious Metals and Industrial Metals were firmer.
Corn and Soybeans are not oversold anymore. In fact, Soybeans have risen for the past 3 weeks after snapping their recent 10 week losing streak.
Wheat is very close to an oversold reading.
Since its recent oversold reading, Nickel has risen for the past 5 weeks.
Uranium and the Baltic Dry Index are in 6 week losing streaks.
The former has fallen 22% during that streak.
Rotterdam Coal is in a 4 week winning streak.
I see a change in trend approaching for Urea prices.
And Lithium Hydroxide has now spent 36 consecutive weeks in weekly oversold territory.
Currencies saw a firmer CAD, EUR and USD.
The USD rose against everyone unless it was a Peso.
The Japanese Yen was weaker perhaps as capital markets continue to embrace risk, or is this some sort of divergence?
The Aussie fell against everyone except the Yen and Baht.
The DXY Index recovered more than half of last weeks decline.
And the USD broke its 5 week losing streak against the SEK.
The larger advancers over the past week comprised of;
Rotterdam Coal 2.2%, WTI Crude 4.1%, Lean Hogs 2.4%, Copper 5.9%, Heating Oil 3.6%, JKM LNG 3.8%, LNG in Yen 3.6%, Tin 3.4%, Cocoa 25.4%, Orange Juice 2.6%, Palladium 6.3%, Platinum 3.1%, Gasoline 7.5%, Biodiesel 2.4%, Sugar 4.6%, Cane Sugar 4.5%, SPGSCI 2.8%, CRB 2.9%, Dutch TTF Gas 2.4%, Brent Crude 4.2%, Gasoil 4%, CAC 1.7%, China A50 2.1%, MIB 1.6%, HSCEI 2.9%, Hang Seng 2.9%, IBEX 2.8%, Mexico 2.4%, Stockholm 1.9%, Chile 1.9%, Silver in AUD 4.6% and Silver in USD rose 3.6%.
The group of largest decliners from the week included;
Australian Coking Coal (5.3%), China Coking Coal (5.3%), Hot Rolled Coil Steel (2.7%), Lumber (2%), Newcastle Coal (4.7%), Natural Gas (8.3%), China Iron Ore (6.4%), S&P SmallCap 600 (1.8%), Russell 2000 (2.1%), Nasdaq Composite (0.7%), KRE Regional Banks (3.5%), S&P MidCap 400 (1%), Nasdaq Biotechs (1.2%), Nikkei 225 (2.5%), Nifty (2.1%), PSE (1.7%), SENSEX (2%), SOX (4%), ASX 200 (2.3%), ASX Materials (3.4%), ASX Industrials (2.7%), BIST (3.6%) and Uranium fell 5.9%.
March 17, 2024
by Rob Zdravevski
rob@karriasset.com.au