Macro Extremes (week ending July 31, 2026)
August 2, 2026 Leave a comment
A weekly Macro, Cross Asset review of prices trading at extremes which may generate future investment ideas and opportunities.
The following assets (on a weekly timeframe) either registered an Overbought or Oversold reading and/or have traded more than 2.5 standard deviations above or below its rolling mean.
n.b. pricing of (commodity) futures contracts is only considering the immediate front month.
* denotes multiple week inclusion
Extremes above the Mean (at least 2.5 standard deviations)
Australian 10 year minus 2-year bond yield spread
Australian 10 year minus 5-year bond yield spread
TBT *
U.S. 20 and 30-year bond yields
Arabica Coffee
AUD/CHF
CAD/CHF
EUR/CHF
PX Index
ASX 200 Index
Overbought (RSI > 70)
Copper/Gold Ratio *
Indonesian and Japanese 10-year bond yields
U.S. 5 year minus 5-year breakeven inflation rate spread *
U.S. 10 year minus 10-year breakeven inflation rate spread *
North European Rolled Steel *
U.S. Midwest Hot Rolled Coiled Steel *
Gasoil Heating Oil Crack Spread
Chinese RMB
USD/IDR
Hungary’s BUX Index *
Singapore’s Strait Times Index *
And Poland’s WIG Index
The Overbought Quinella (Both Overbought and Traded at > 2.5 standard deviations above the weekly mean)
Japanese 2-year bond yield *
COP/USD *
Extremes below the Mean (at least 2.5 standard deviations)
TLT
Australian Coking Coal
Lean Hogs *
Lithium Hydroxide *
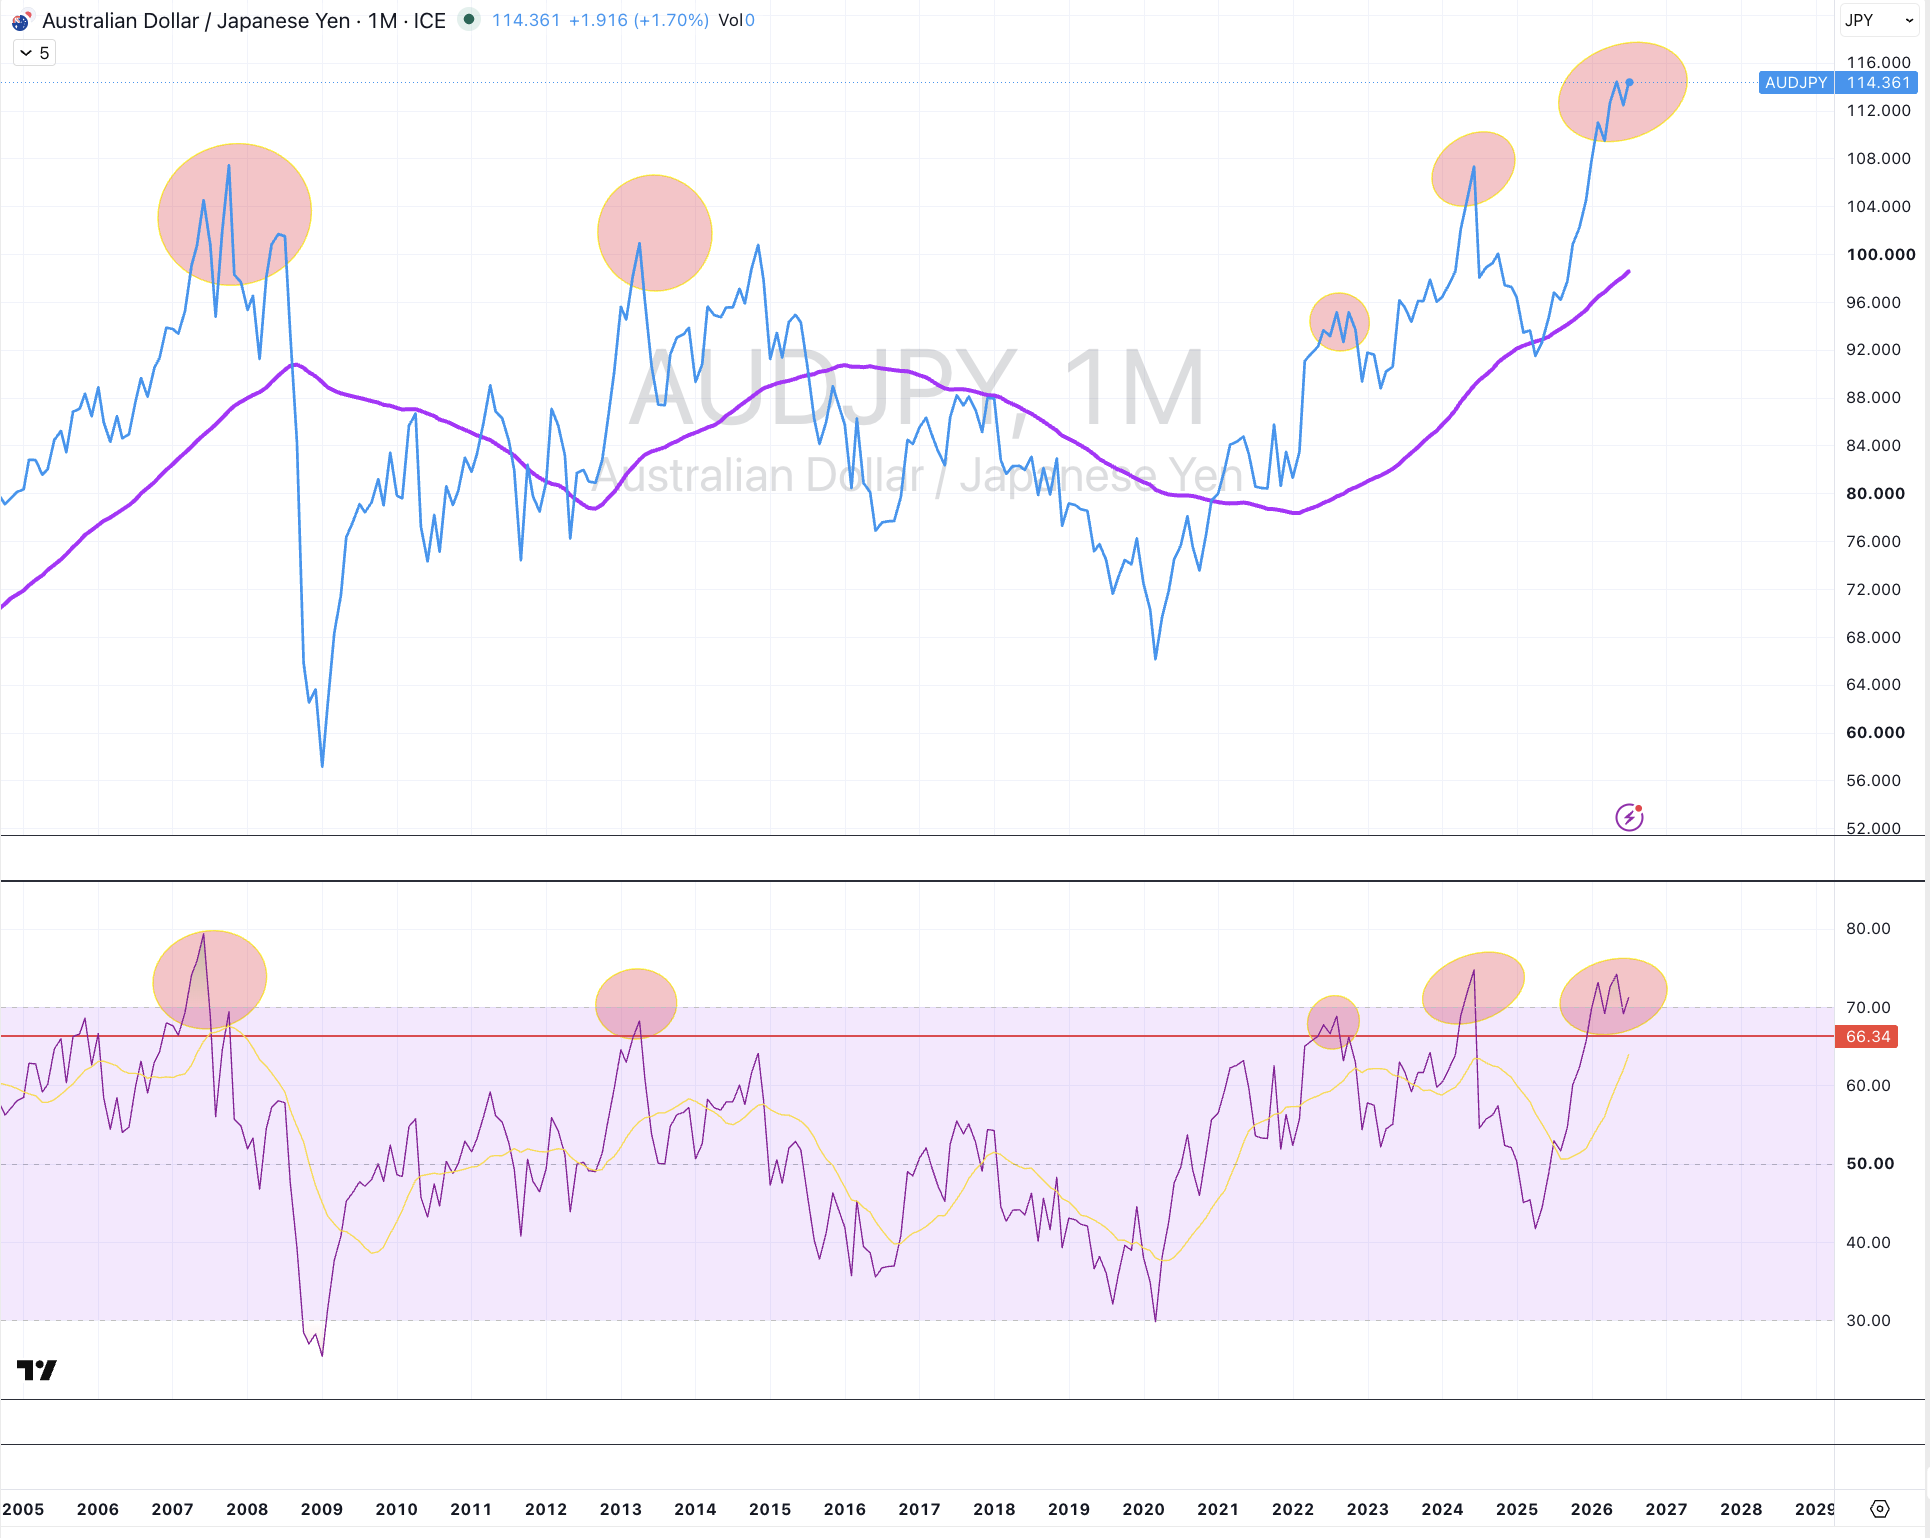
CAD/JPY
CHF/JPY
EUR/JPY
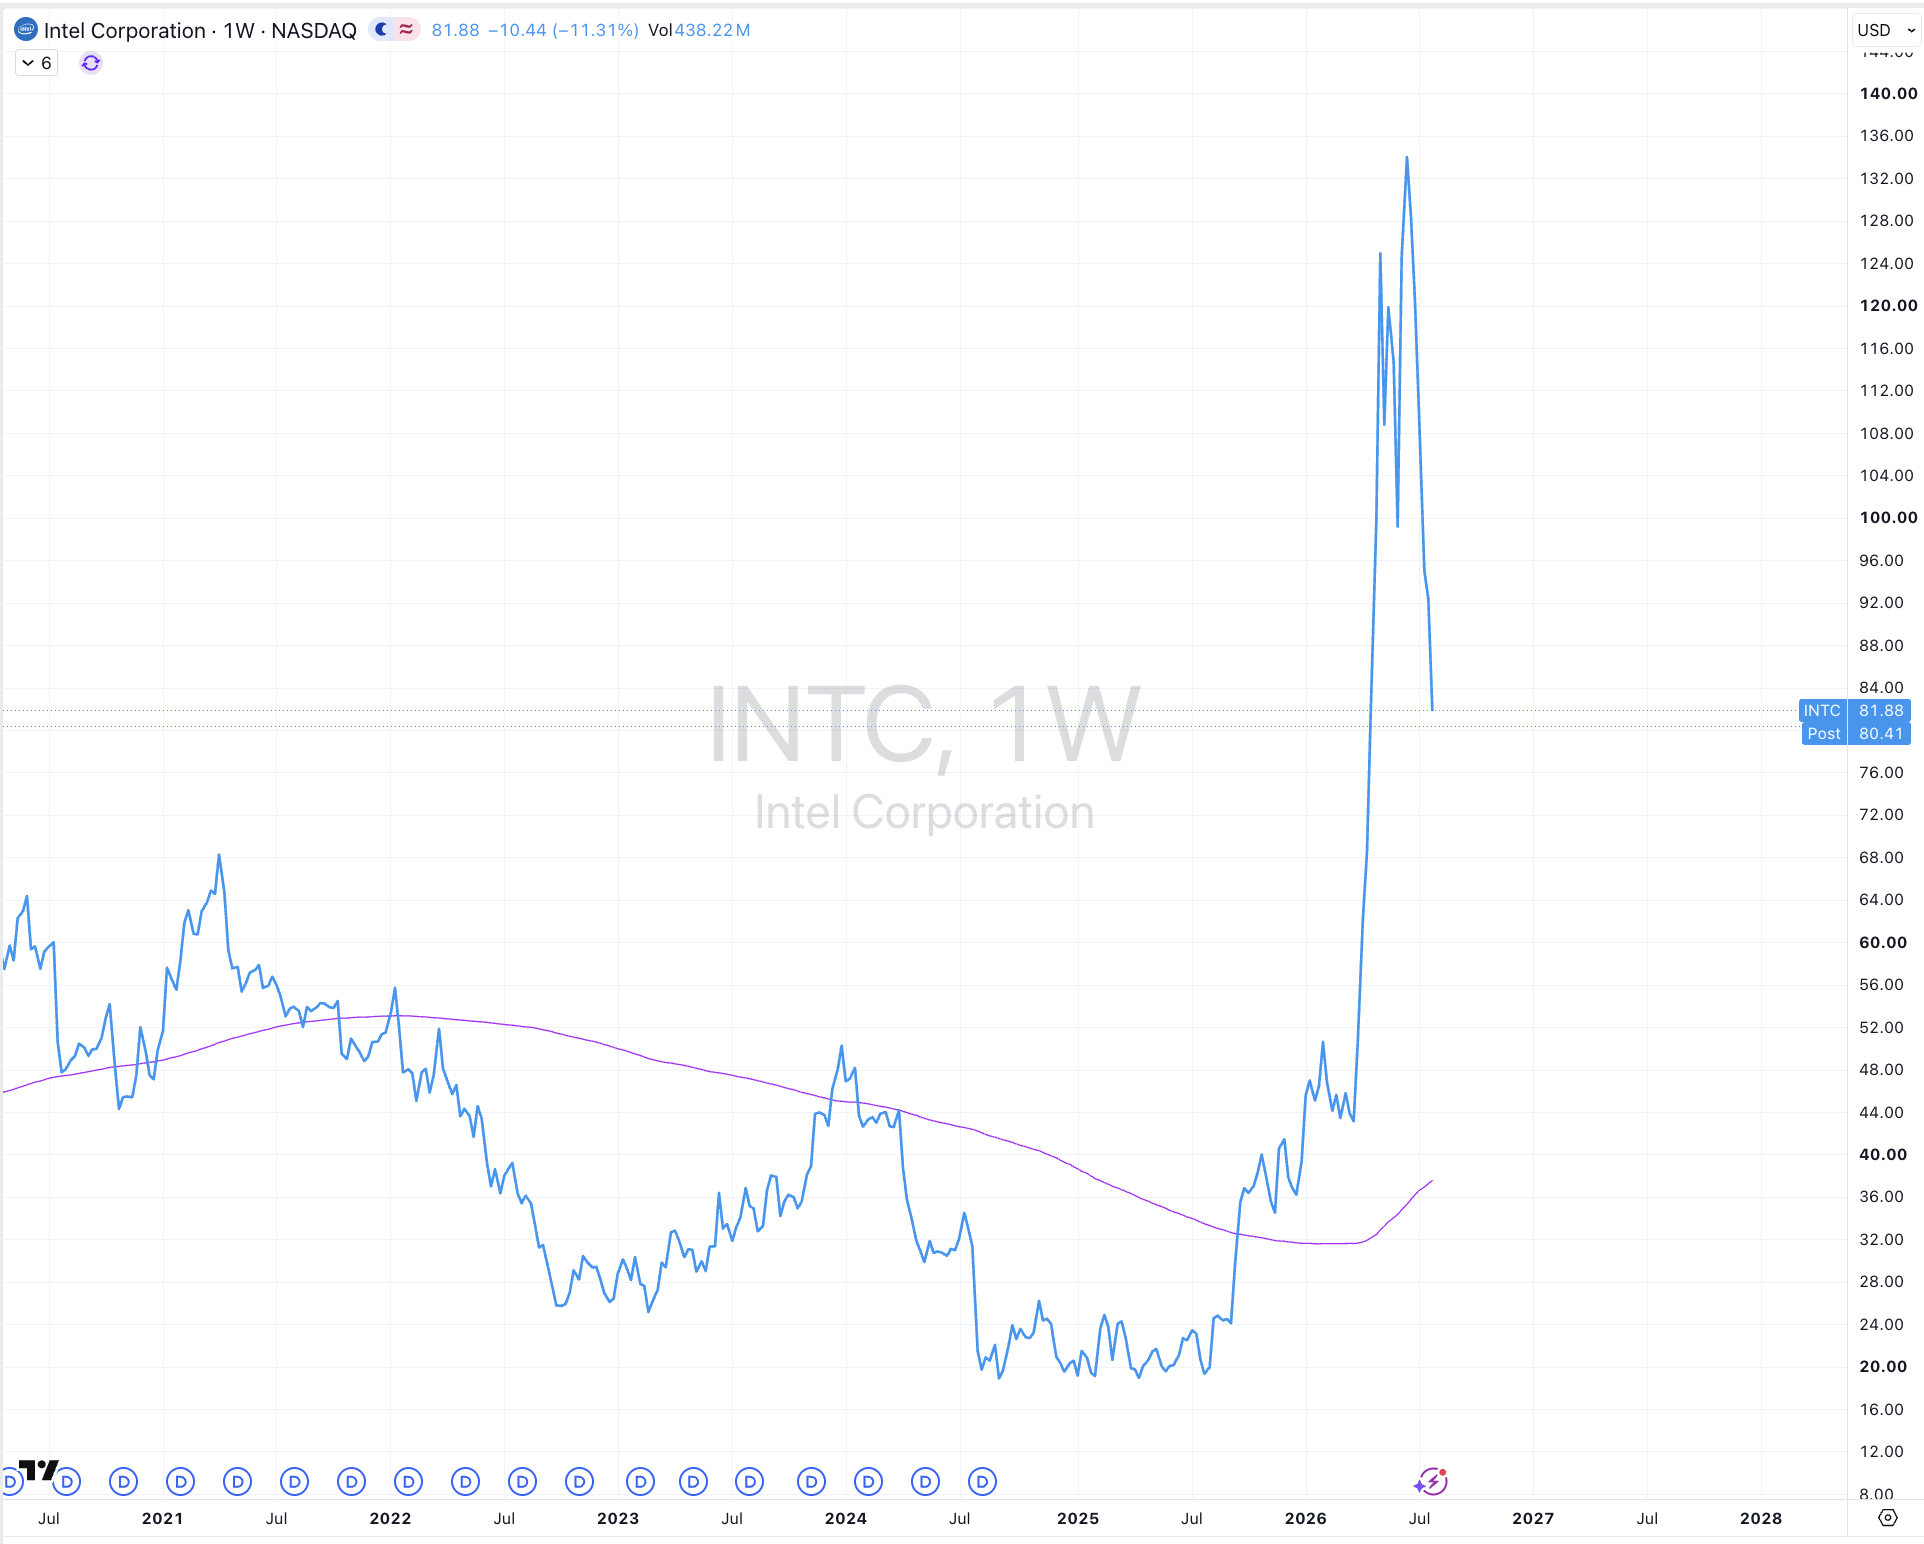
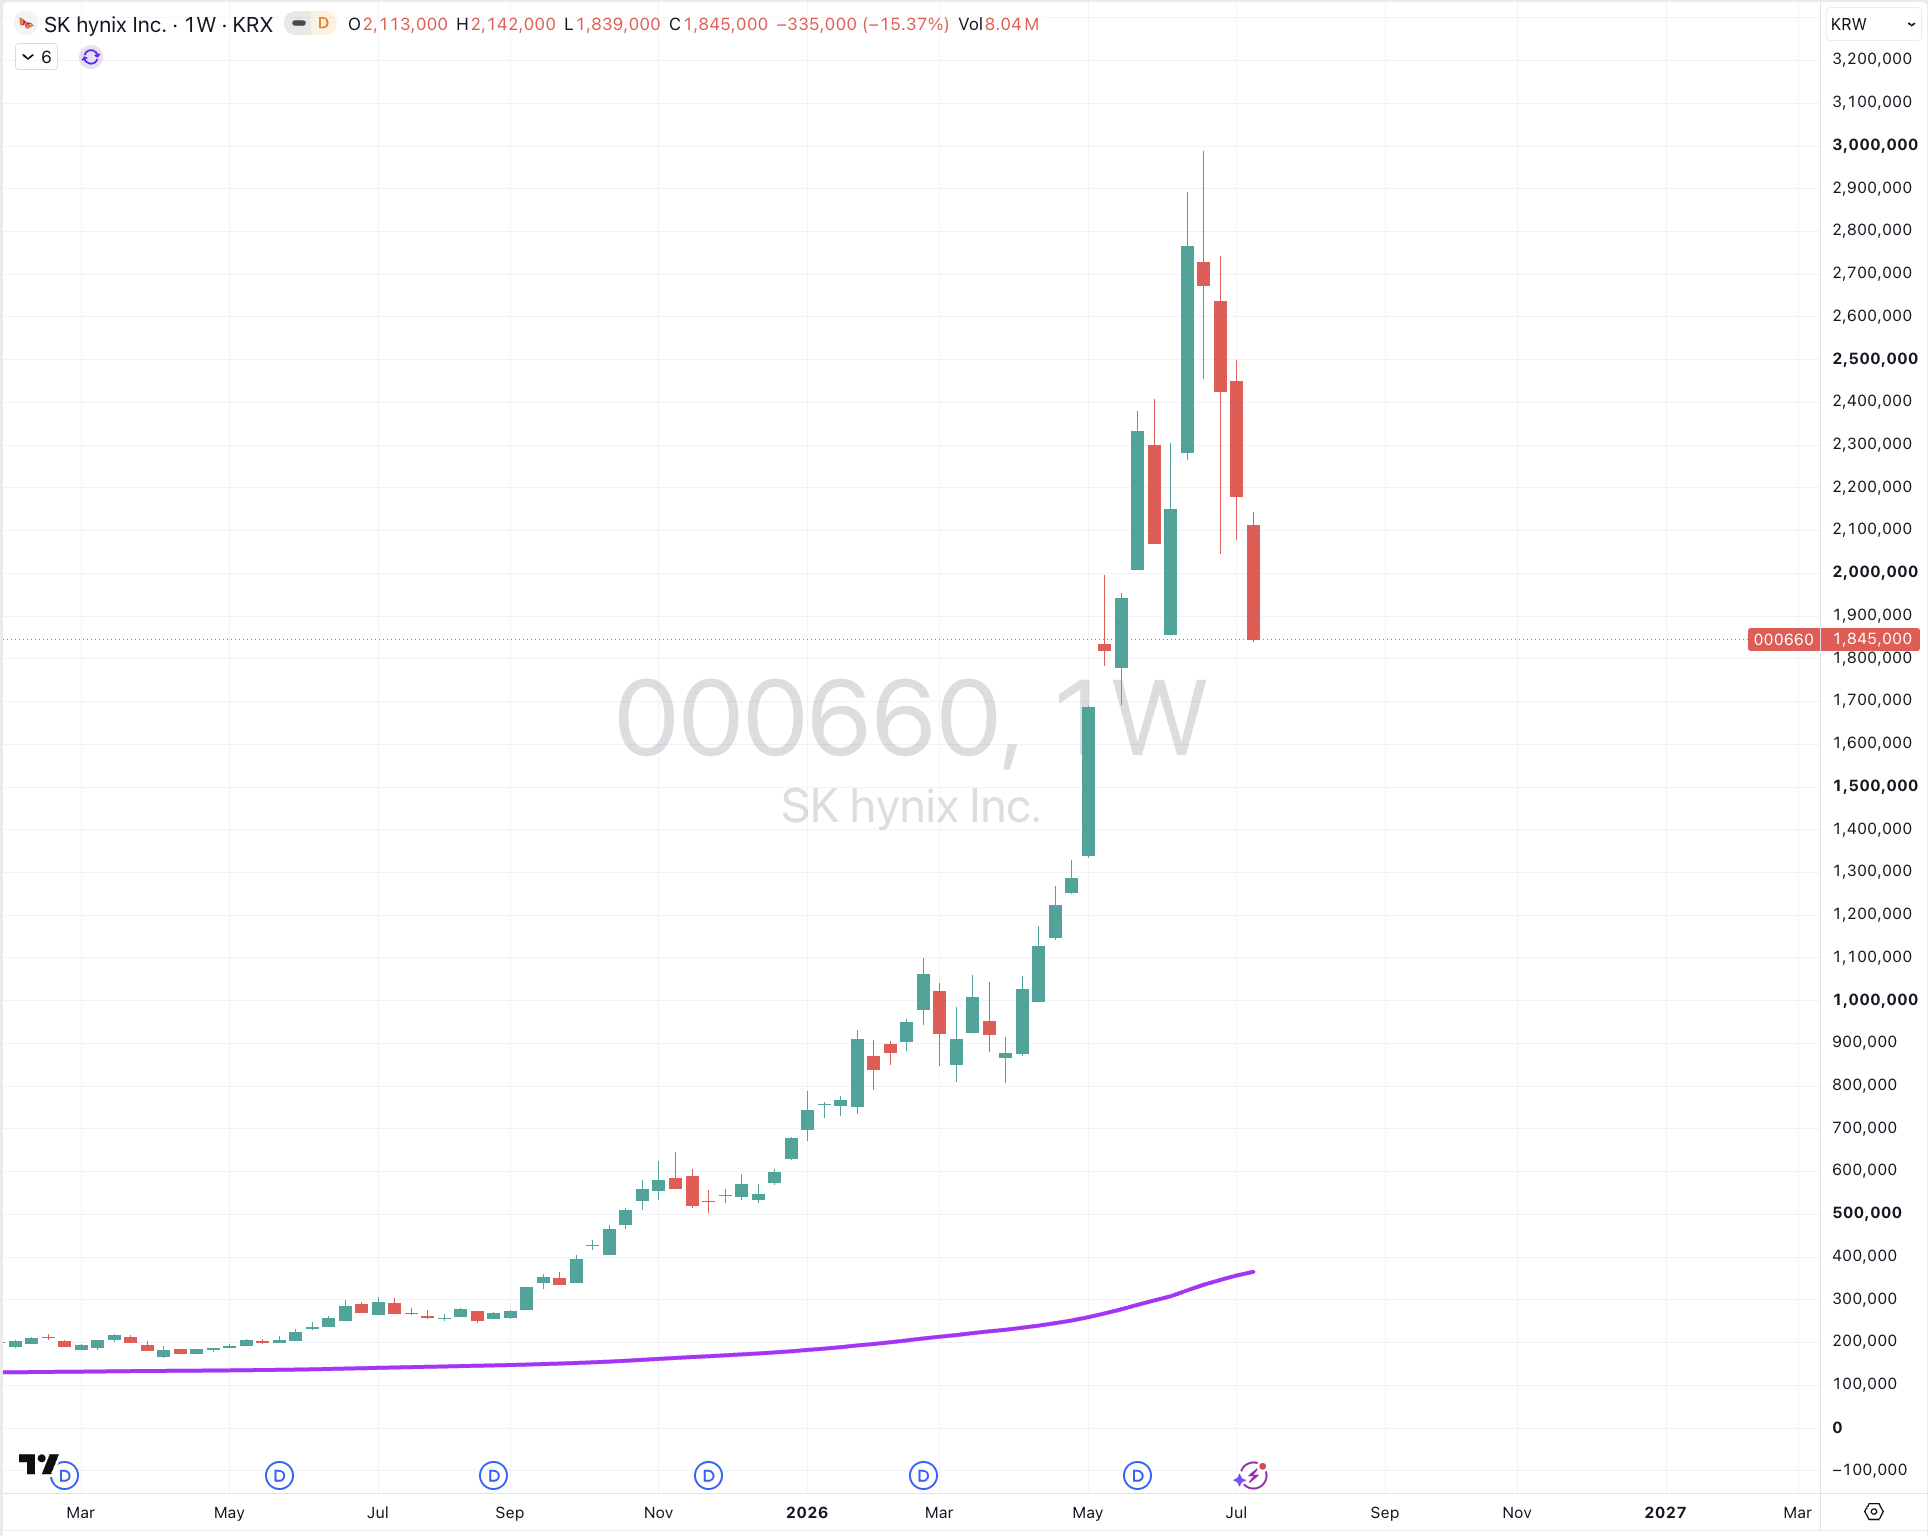
USD/KRW
Oversold (RSI < 30)
Iron Ore (SGX and China CFR)
USD/CNH
The Oversold Quinella (Both Oversold and Traded at < 2.5 standard deviations below the weekly mean)
None
Notes & Ideas:
Government bond yields rose, again…again!
Austrian, Belgian, Canadian, Danish, Spanish, German, Finnish, French, British, Italian, Dutch, Portuguese and Swedish 10-year bond yields.
Also, in a 5-week rising streak are British, German and U.S. 20’s and 30’s.
Many shorter dated (2’s and 5’s) yields fell.
Aussie 10 year minus U.S. 10-year bond yield spread performed a bearish outside reversal.
Aussie yields along with Chinese, Korean, Norwegian, Kiwi and Turkish 10-year yields fell and broke their 4 weeks of decline.
And the U.S. 3-month bill is no longer overbought.
Equities were quieter.
HSCEI, the Hang Seng, Singapore’s Strait Times and Australia’s Financials Index have risen for 5 weeks.
The former has risen 16% over that time.
The latter has risen for 7 of the past 8 weeks.
The Nasdaq biotech index and Türkiye’s BIST have declined for 4 consecutive weeks.
South Korea’s KOSPI has fallen for 6 weeks.
Commodities prices were mixed, with a bias for weakness.
Coffee, Steel, Platinum, Urea and Gasoil were the notable gainers.
Coal, Crude Oil, Hogs, Gases Lithium and Lumber were amongst the largest decliners.
The Copper/Gold Ratio and Urea have risen for 4 weeks.
Tin and Gasoil have climbed for 5 weeks.
While North European Hot Coiled Steel and Gasoil crack spreads have risen for 6 weeks.
The latter soared 24% in the past week alone.
JKM LNG as priced in Yen and Gasoline declined and snapped their 4-week winning streaks.
Cattle prices rose and snapped a 5-week losing streak.
JKM and Dutch TTF Gas fell and broke 5 weeks of advance.
Australian Coking Coal & Natural Gas have fallen for 5 weeks.
Lithium Carbonate and Hydroxide have sunk for 7 weeks.
Currencies were active.
The Aussie was weaker except against the USD where it has risen for 5 consecutive weeks.
The Loonie was lower.
Euro was firmer and the British Pound was mixed.
The Yen was notably higher while the USD was weaker.
EUR/AUD and JPY/AUD rose to snap a 4-week decline.
While the pairs of USD/CNH, USD/KRW and USD/SGD have fallen for 5 straight weeks.
The larger advancers over the past week comprised of;
Cotton 2.3%, Copper 1.7%, Arabica Coffee 5.8%, Cattel 2.1%, Rotterdam Coal 1.5%, North European Steel 2.1%, U.S. Midwest Steel 3%, Orange Juice 9.3%, Palladium 2.2%, Platinum 3.4%, Tin 2.5%, Urea 4.6%, Gasoil 6.8%, Gasoil crack spread 24.1%, All World Developed ex USA 1.9%, BUX 2.2%, CAC 1.6%, DAX 2.1%, HSCEI 4.1%, Hang Seng 3.7%, Bovespa 2.3%, MOEX 2.8%, Nasdaq Composite 1.6%, KLSE 1.4%, KSE 3%, NIFTY 2.6%, Stockholm 1.5%, PX 1.9%, SA40 1.8%, Sensex 2.7%, S&P 500 1.1%, VN Index 3%, WIG 2.7%, ASX Financials 1.6%, ASX 200 2.3%, ASM Materials 2% and the ASX Industrials rose1.6%.
The group of largest decliners for the week included;
Australian Coking Coal (6.1%), Aluminium 2.5%, Bloomberg Commodity Index (2.1%), Brent Crude (9.1%), WTI Crude (5.1%), DXY (1.6%), Palm Oil (1.7%), Iron Ore (1.8%), Lean Hogs (4.7%), JKM (2.5%), Lumber (6.2%), JKM in Yen (6.8%), Lithium Hydroxide (7.8%), Newcastle Coal (1.4%), Natural Gas (4.3%), Lithium Carbonate (5.7%), Gasoline (4.2%), Sugar #16 (2.1%), S&P GSCI (2.1%), China CFR Iron Ore (3.4%), CRB Index (2.7%), Dutch TTF Gas (7.1%), Gold in CHF and EUR (1.6%), Corn (5.1%), Oats (3.6%), Soybean (5.3%), Wheat (5.7%), DJ Transports (6.4%), FTSE Saudi (2%), SET (1.3%), SOX (4.3%), TA35 (2.4%), Nasdaq Transports (4.4%), BIST (3.5%) and XBI biotech ETF fell 2.3%.
August 2, 2026
By Rob Zdravevski
rob@karriasset.com.au