Macro Extremes (week ending July 10, 2026)
July 12, 2026 Leave a comment
A weekly Macro, Cross Asset review of prices trading at extremes which may generate future investment ideas and opportunities.
The following assets (on a weekly timeframe) either registered an Overbought or Oversold reading and/or have traded more than 2.5 standard deviations above or below its rolling mean.
n.b. pricing of (commodity) futures contracts is only considering the immediate front month.
* denotes multiple week inclusion
Extremes above the Mean (at least 2.5 standard deviations)
U.S 3-month bill yield *
Cocoa *
Arabica & Robusta Coffee
GBP/JPY
IBB & NBI biotech ETF’s *
Overbought (RSI > 70)
Copper/Gold Ratio *
U.S. 5 year minus 5 year breakeven inflation rate spread
USD/IDR *
KBW Banks Index
Hungary’s BUX Index
Dow Jones Industrial Index
Taiwan’s TAIEX *
Nikkei 225 *
Thailand’s SET Index
And Poland’s WIG Index
The Overbought Quinella (Both Overbought and Traded at > 2.5 standard deviations above the weekly mean)
COP/USD *
Singapore’s Strait Times *
XBI biotech ETF *
Extremes below the Mean (at least 2.5 standard deviations)
EUR/GBP *
Oversold (RSI < 30)
None
The Oversold Quinella (Both Oversold and Traded at < 2.5 standard deviations below the weekly mean)
None
Notes & Ideas:
Government bond yields rose, again.
Except for the Japanese 10’s and 30’s, which fell and departed overbought territory.
Italy’s 10’s followed on higher, from last week’s outside bullish reversal.
Polish and Czech 10-year yields rose to break a 4-week trend.
The Indian 10-year yield rose and brought 6 weeks of decline to an end.
And Russia’s 10-year bond yield fell to snap 9 weeks of higher yields and are no longer overbought.
Equities were mixed and subdued with a slight bias for higher prices.
Mexico’s IPC Index has fallen for 4 weeks.
The BUX, DJ Industrials, SMI, IBEX along with the IBB and NBI U.S. biotech ETF’s fell and broke their 4-week winning streak.
The SOX, Russell 2000, S&P 600 Smalls and a few others dropped out of overbought territory.
Korea’s KOSPI has slumped 18% over the past 3 weeks.
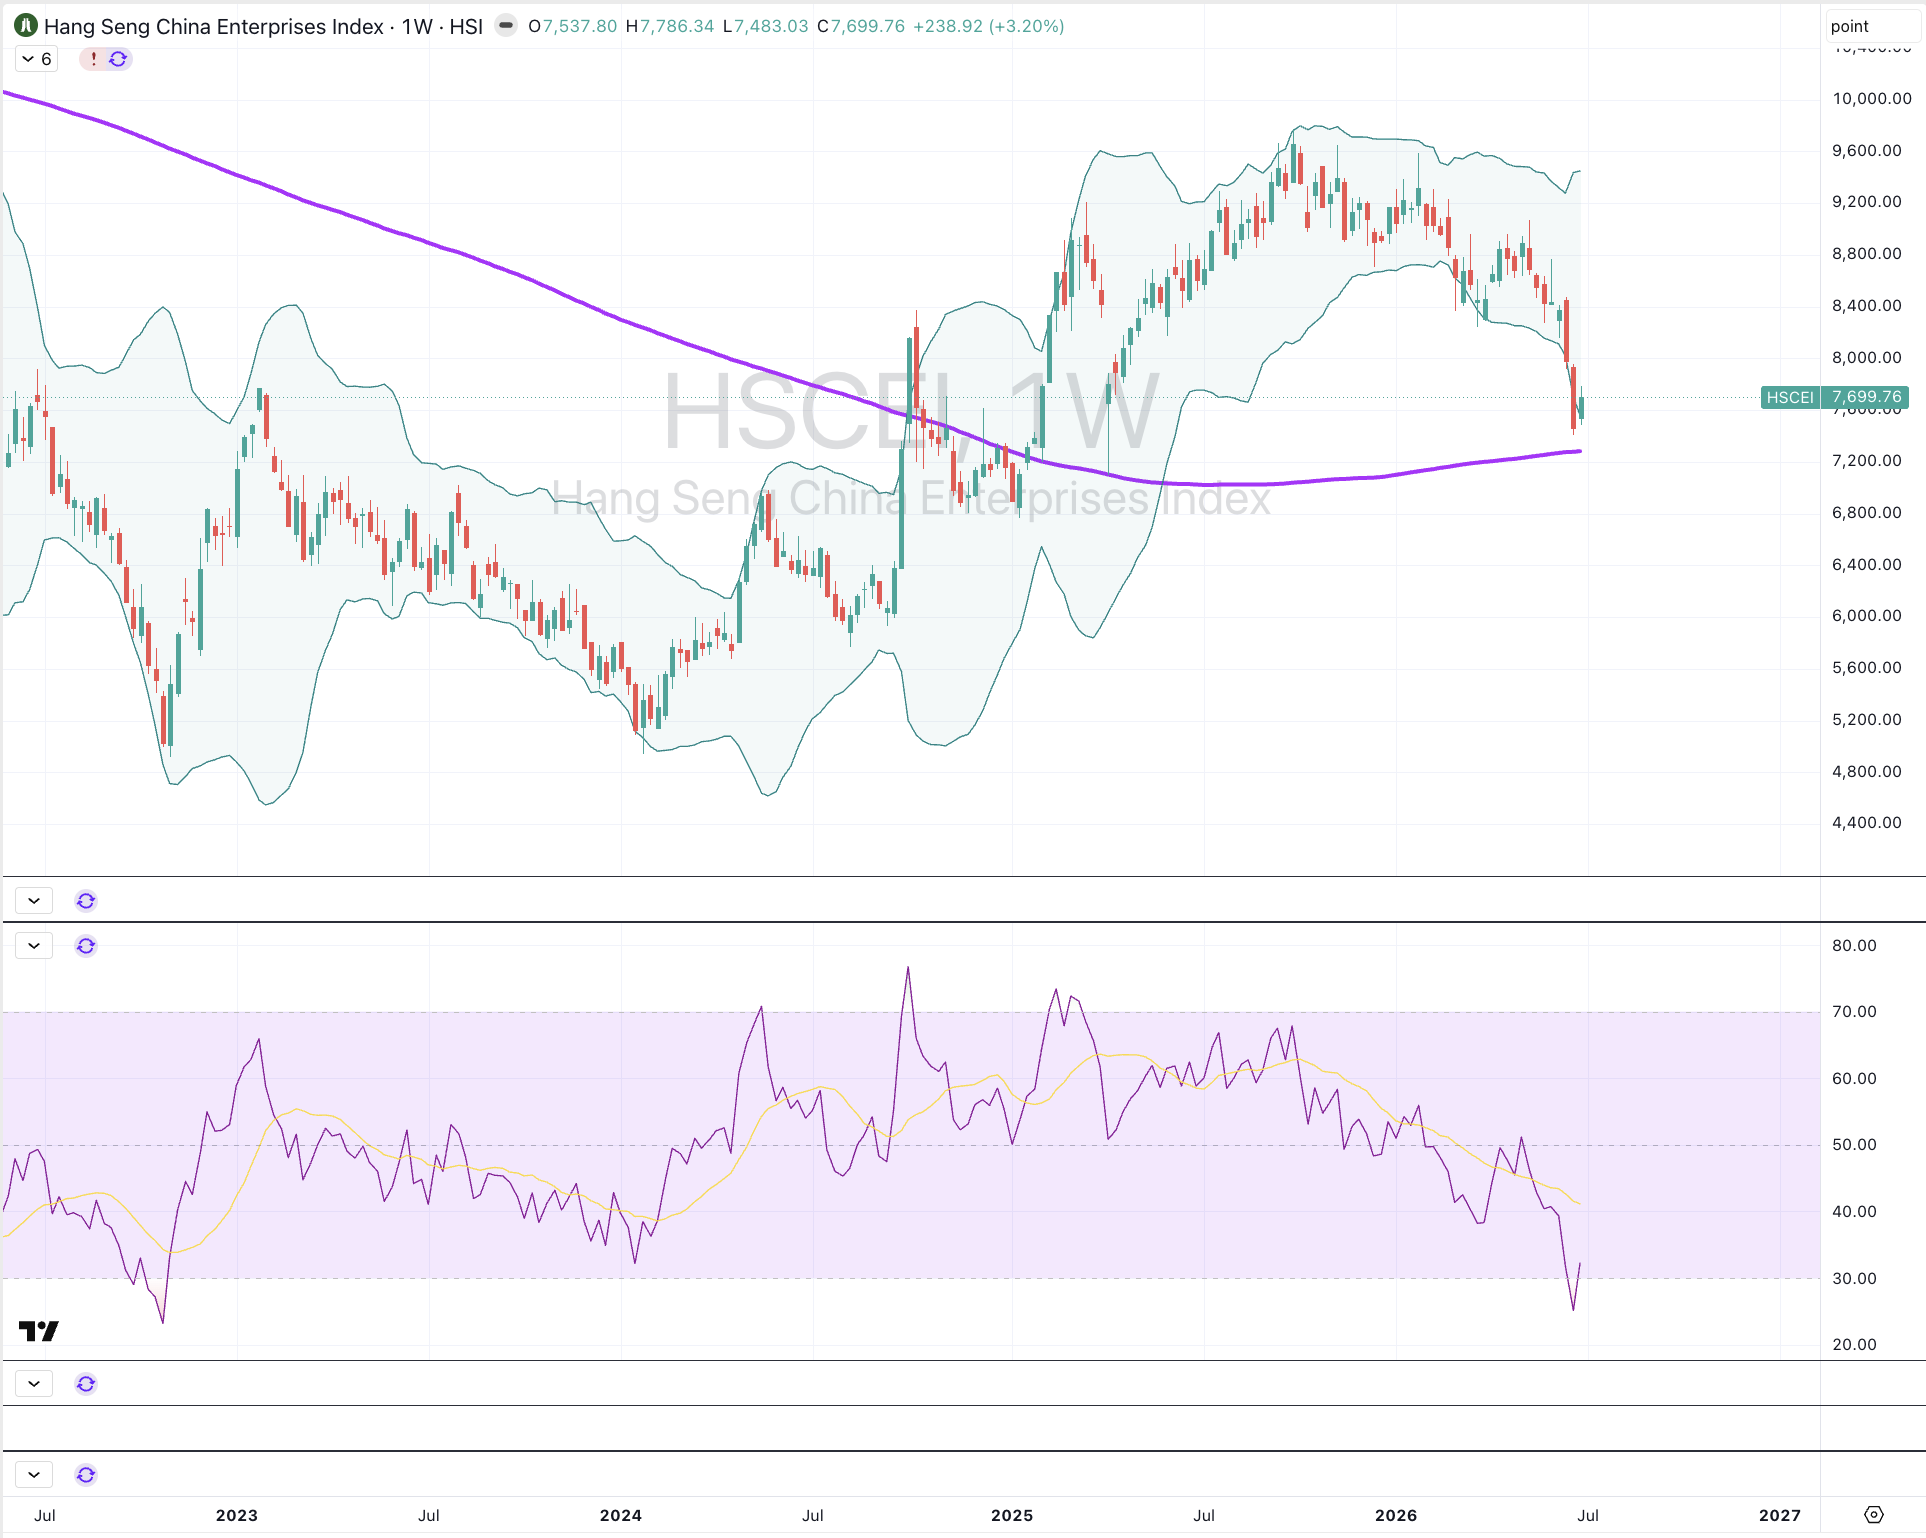
While the HSCEI Index has risen 7% in a fortnight.
Commodities activity increased.
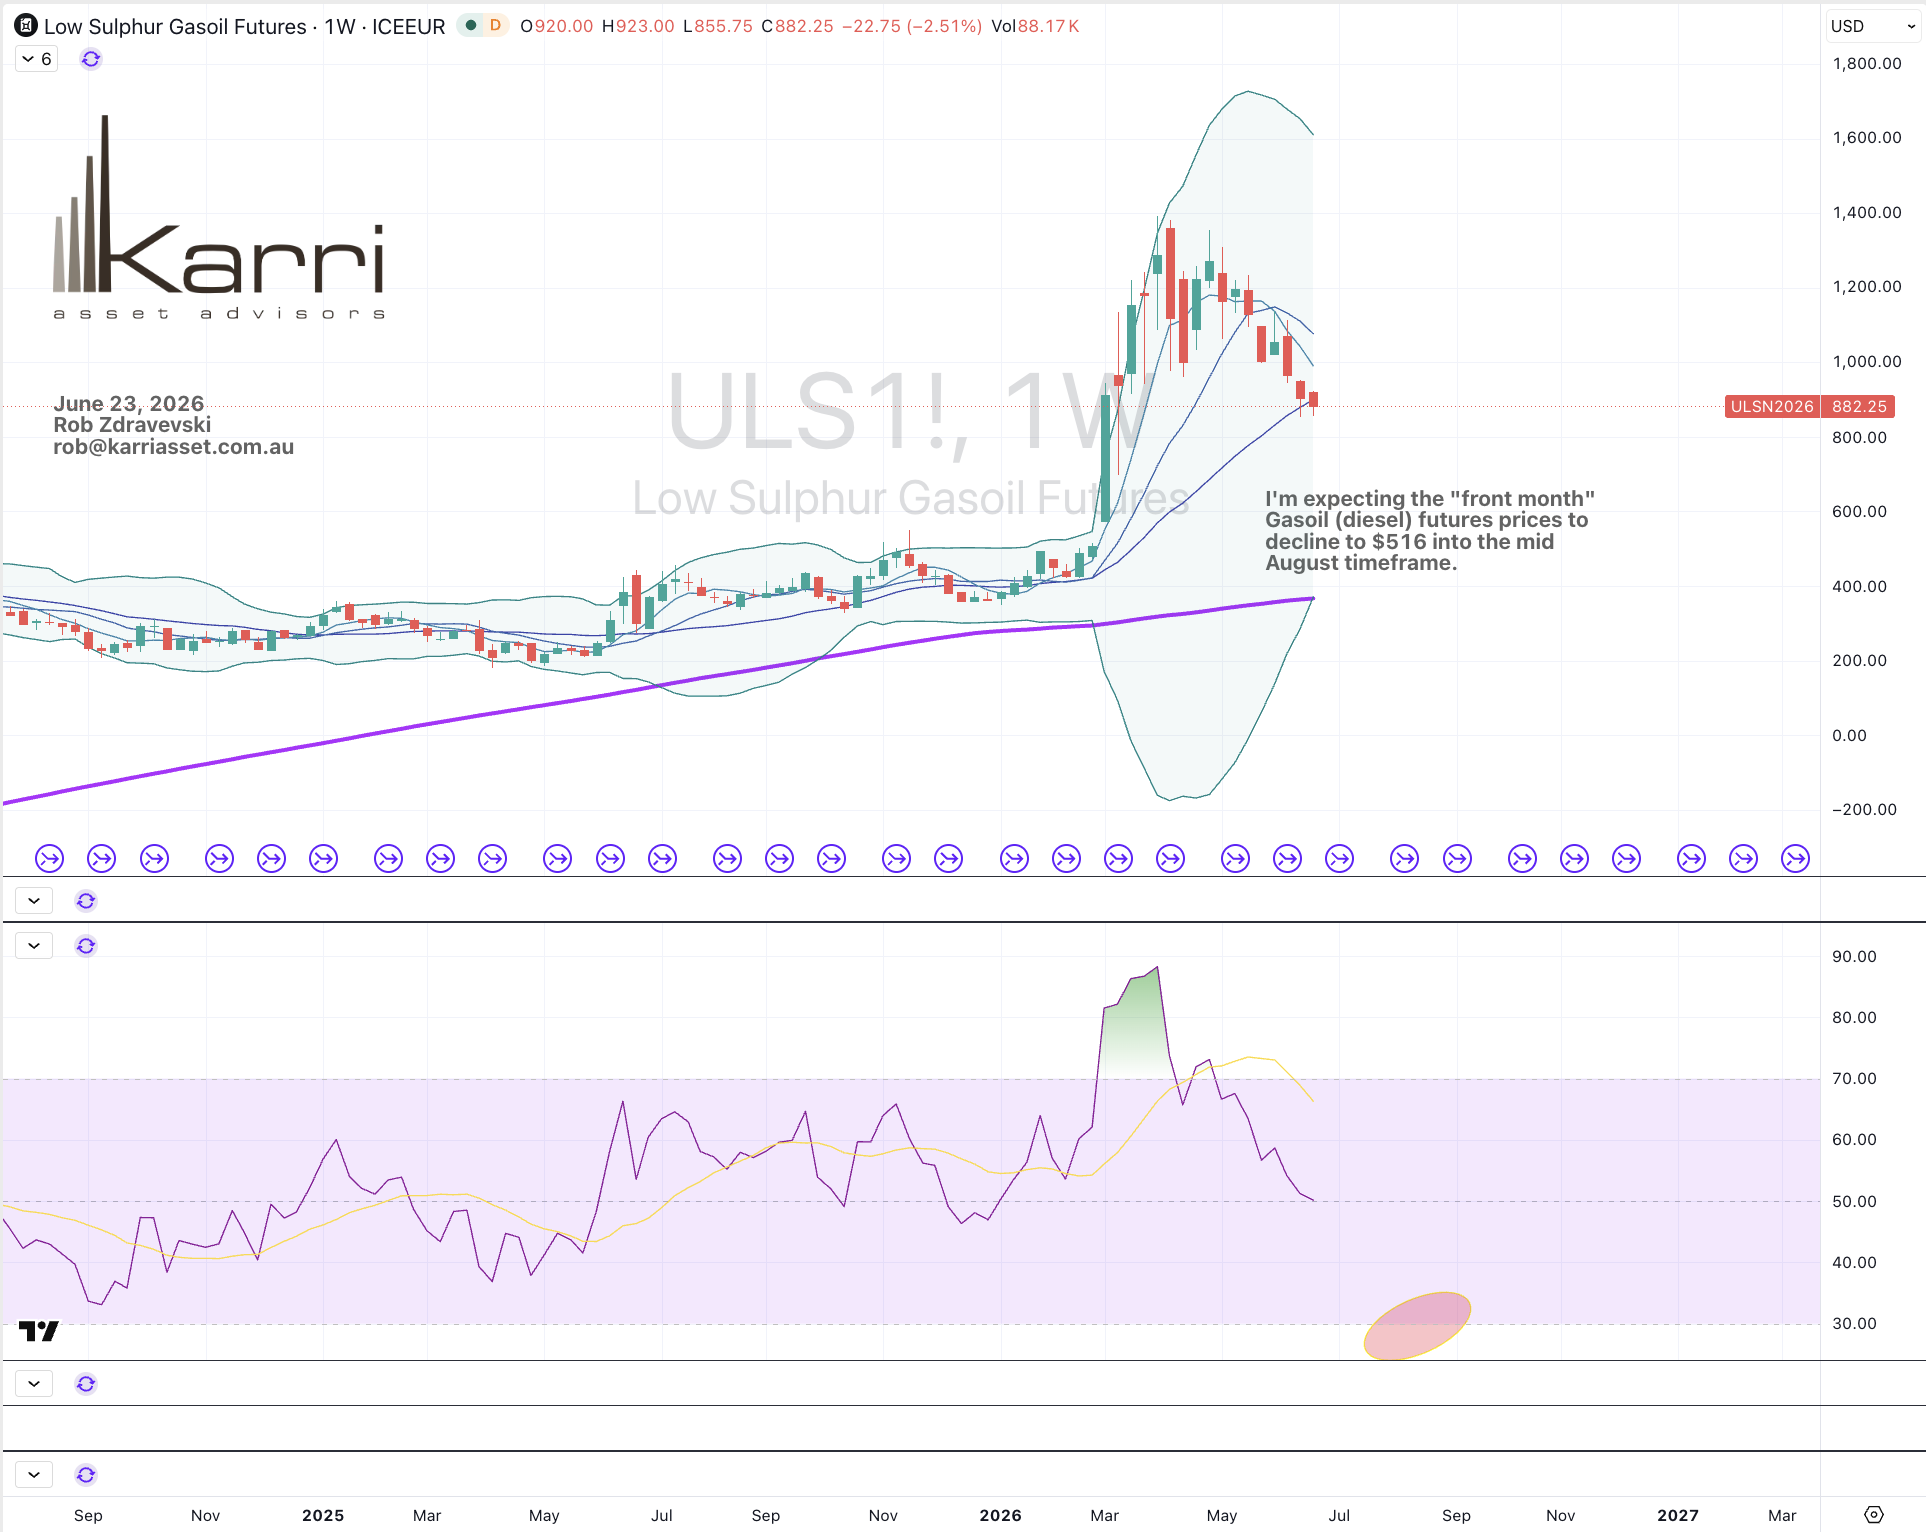
Oils, Gases, Distillates, Shipping Rates, Cocoa, Coffee, Oats, Corn & Wheat were the notable gainers.
Coal, Orange Juice, Lithium, Gold and Silver were amongst the decliners.
Aluminium rose and broke a 4-week losing streak.
Oats have risen for 4 weeks.
Inversely, Shanghai Rebar prices have fallen for 4 weeks.
Coffee is in a 5-week winning streak, with Arabica soaring 33% over that time.
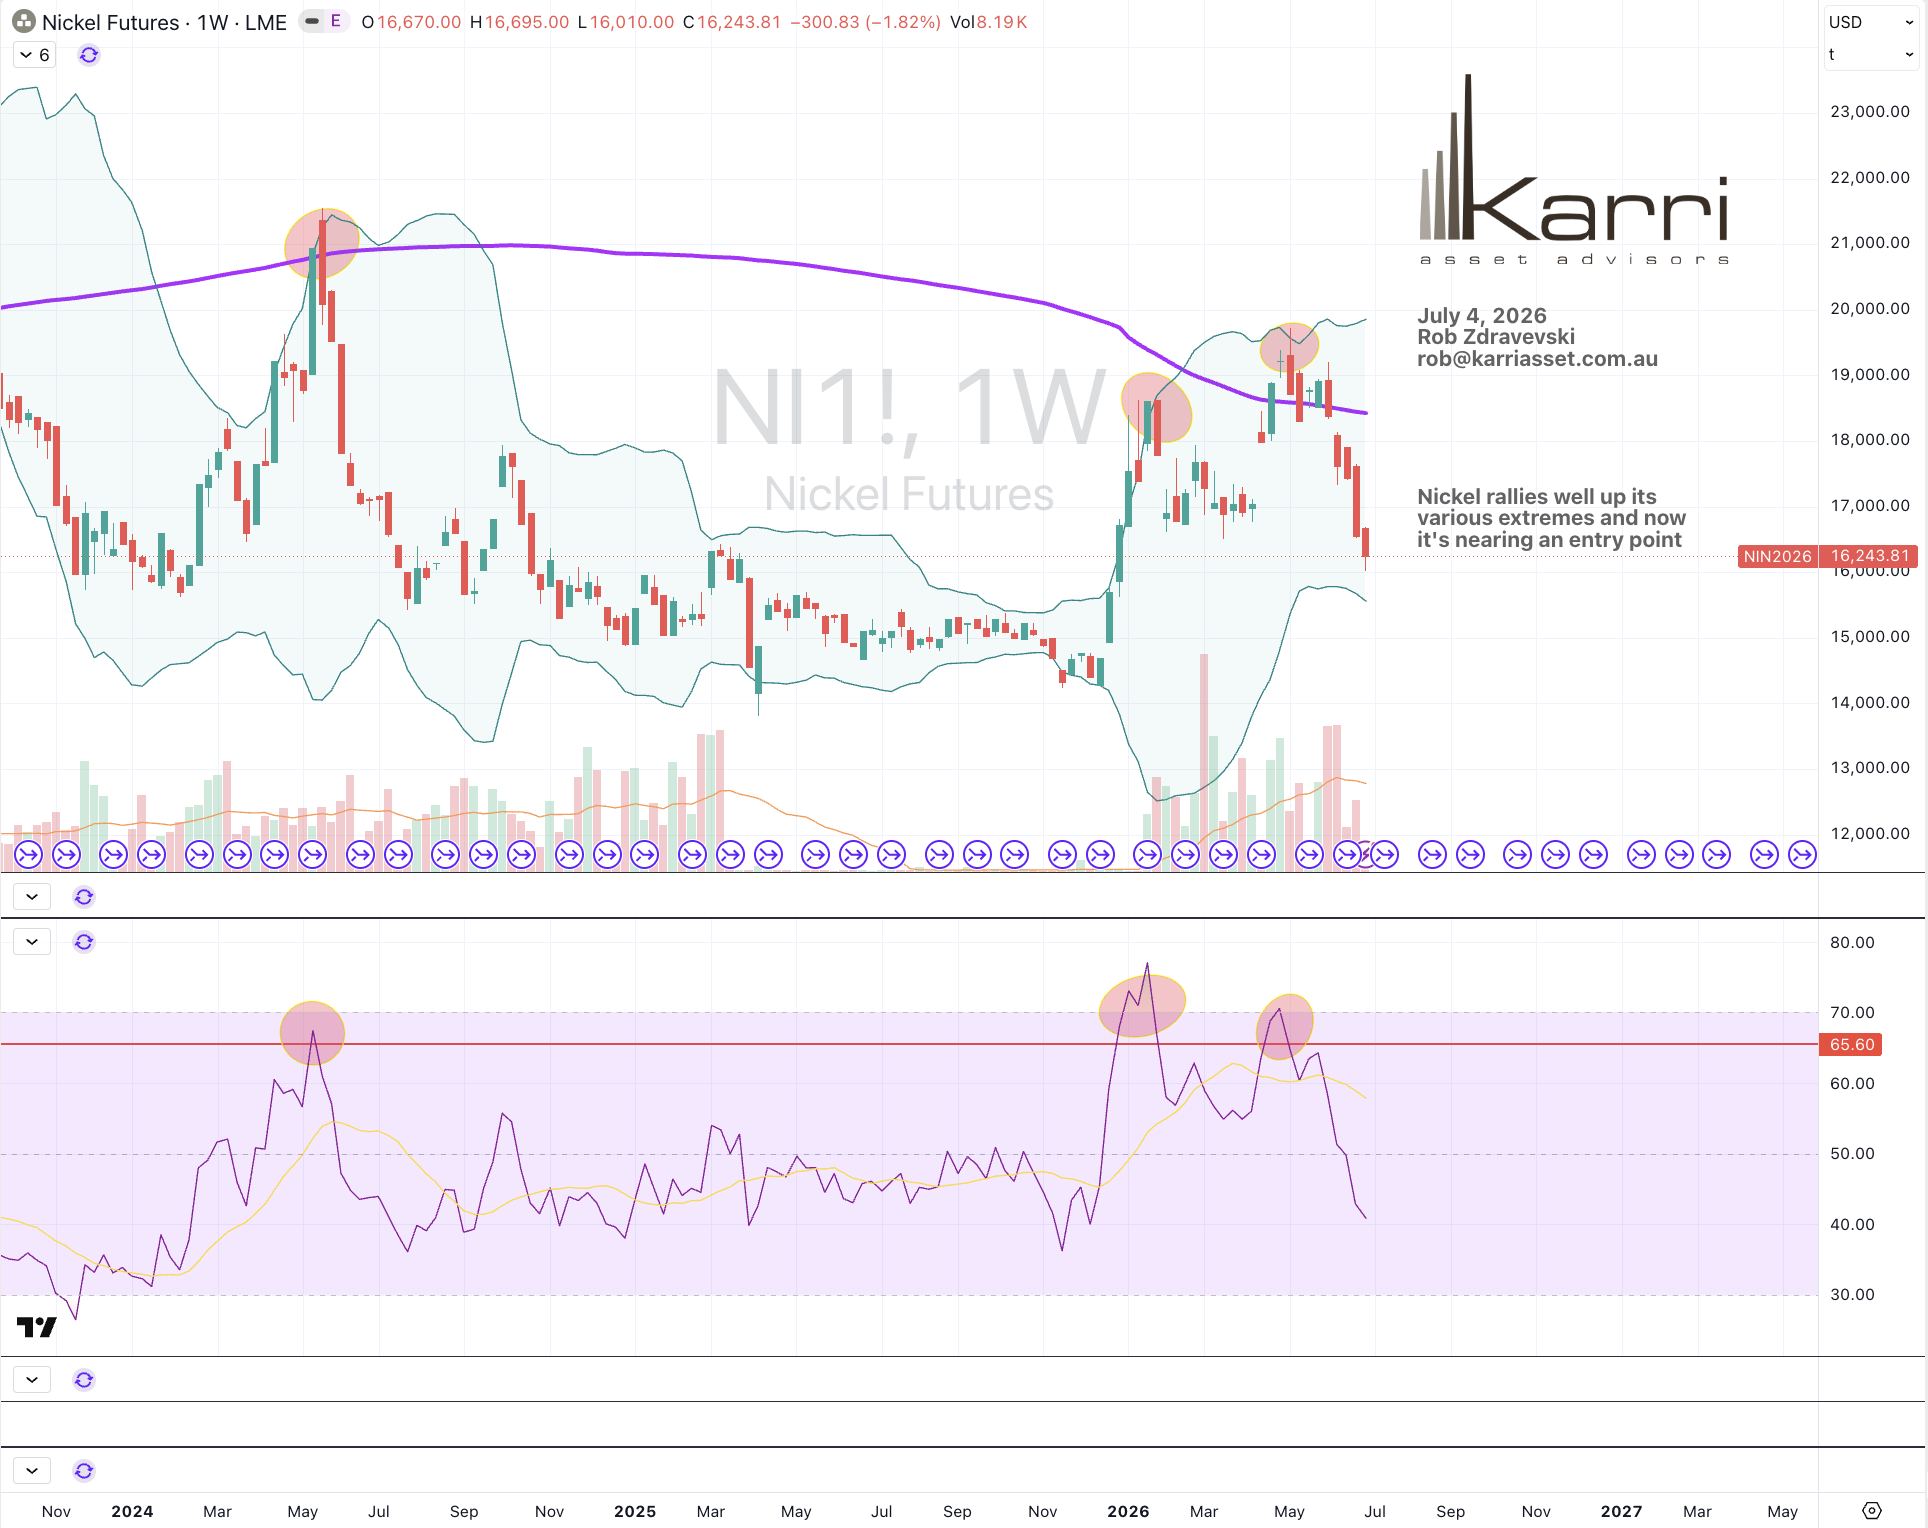
While Nickel, Brent Crude and WTI Crude snapped 5 weeks of decline.
Middle Eastern and U.S. Gulf Urea prices rose and snapped their respective 9- and 11-week losing streaks.
Platinum also rose and broke an 8-week losing run.
JKM LNG as priced in Yen has soared 21% in the past 2 weeks.
Cocoa has climbed 50% in the past 4 weeks.
And Lithium Carbonate and Hydroxide are making ‘good shapes’.
Currencies were active.
The Aussie, Loonie and the British Pound were stronger.
CAD/USD rose and snapped its 5-week losing streak.
While the Euro, Swissie and Yen were weaker.
USD was mixed.
And COP/USD hasn’t fallen for 8 straight weeks.
The larger advancers over the past week comprised of;
Bloomberg Commodity Index 3.1%, Brent Crude 5.9%, Baltic Dry Index 8.4%, Cocoa 20.4% WTI Crude 4%, Cotton 5.7%, Copper 1.8%, Heating Oil 11.7%, JKM LNG 2.7%, Arabica Coffee 11%, JKM LNG in Yen 11.7%, Nickel 1.9%, Gasoline 2.3%, Robusta Coffee 3.7%, Sugar 2.1%, S&P GSCI 2.9%, CRB Index 3.7%, Dutch TTF Gas 10.5%, U.S. Gulf Urea 4.2%, Gasoil 9.5%, Corn 3.9%, Oats 6.4%, Rice 4.3%, Soybeans 3.8%, Wheat 6.8%, KBW Banks 1.7%, EGX 3.5%, HSCEI 4.4%, Hang Seng 3.5%, BOVESPA 2.2%, Nasdaq Composite 1.7%, Nasdaq 100 1.7%, PSE 1.6%, SOX 2.7%, IGPA 1.9%, STI 4.3%, WIG 2.2% and the ASX Financials rose 2%.
The group of largest decliners for the week included;
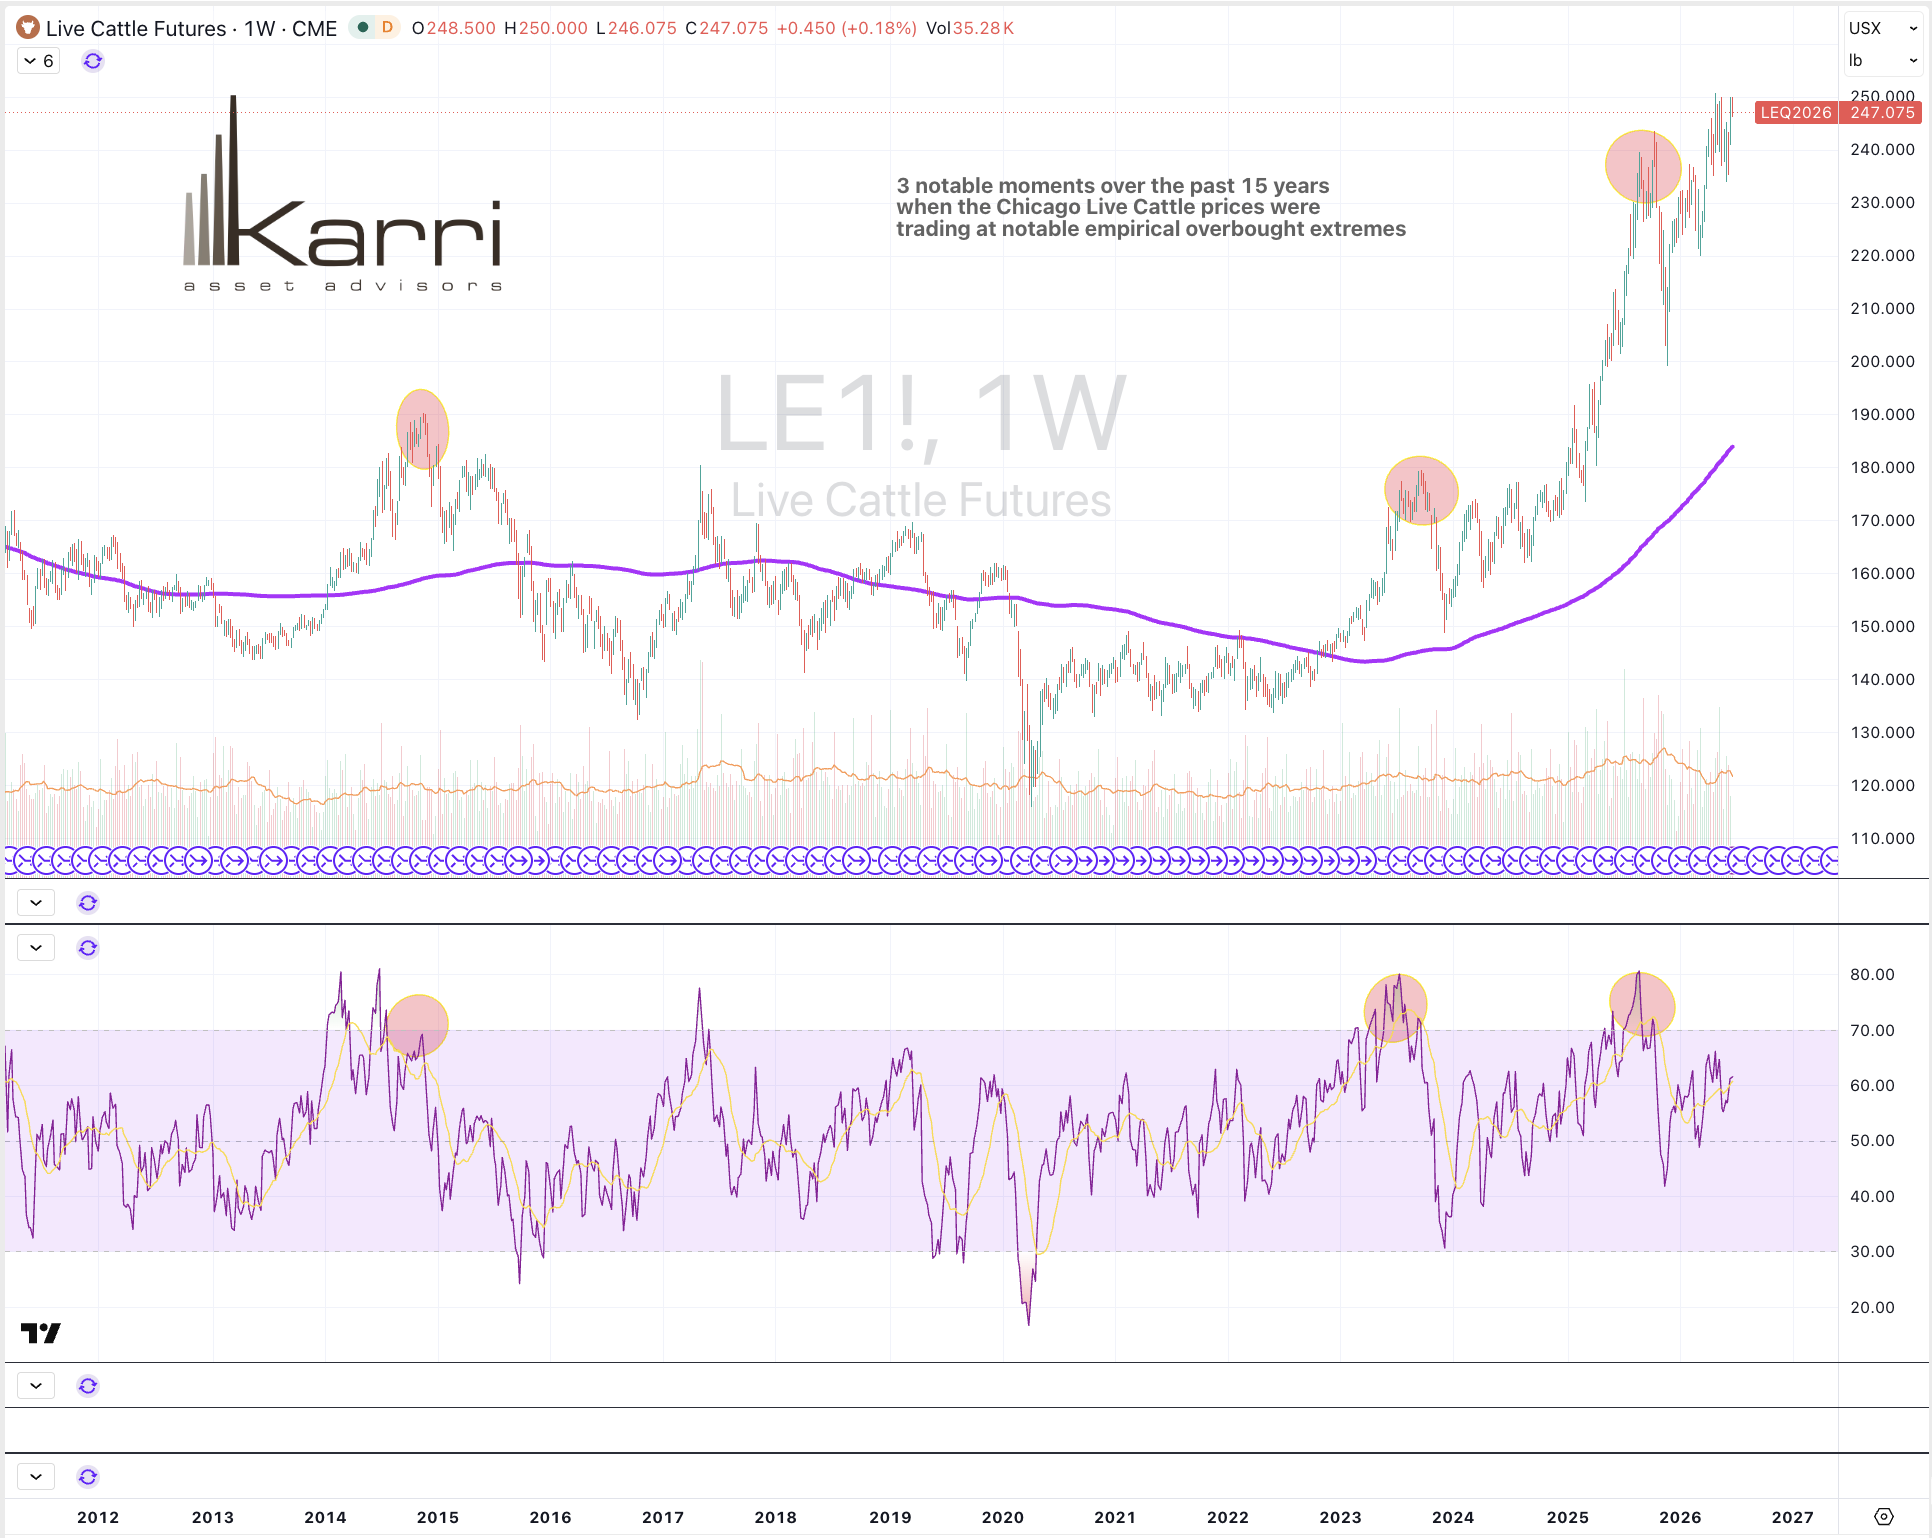
Australian Coking Coal (1.7%), Richards Bay Coal (1.9%), Rotterdam Coal (4.2%), Cattle (1.7%), Lithium Carbonate (3.4%), Natural Gas (8%), Orange Juice (16.7%), Silver in AUD (4.3%), Silver in USD (4.1%), Gold in AUD (1.5%), Gold in CAD (1.6%), Gold in GBP (1.7%), All World Developed ex USA (1.7%), CAC (2%), DAX (2.8%), IBB (1.9%), IBEX (2.4%), TAIEX (3.1%), KSE (1.7%), KOSPI (7.6%), NBI (1.8%), Nikkei 225 (1.7%), Copenhagen (1.5%), Helsinki (1.5%), Stockholm (2.1%), PSI (2.5%), Eurostoxx 50 (2.2%), TA35 (1.7%), FTSE 100 (1.7%), Vietnam (1.8%) and the ASX Materials fell 4.4%.
July 12, 2026
By Rob Zdravevski
rob@karriasset.com.au