My musings about the Natural Gas price
July 18, 2024 Leave a comment
On December 7, 2023, I wrote,
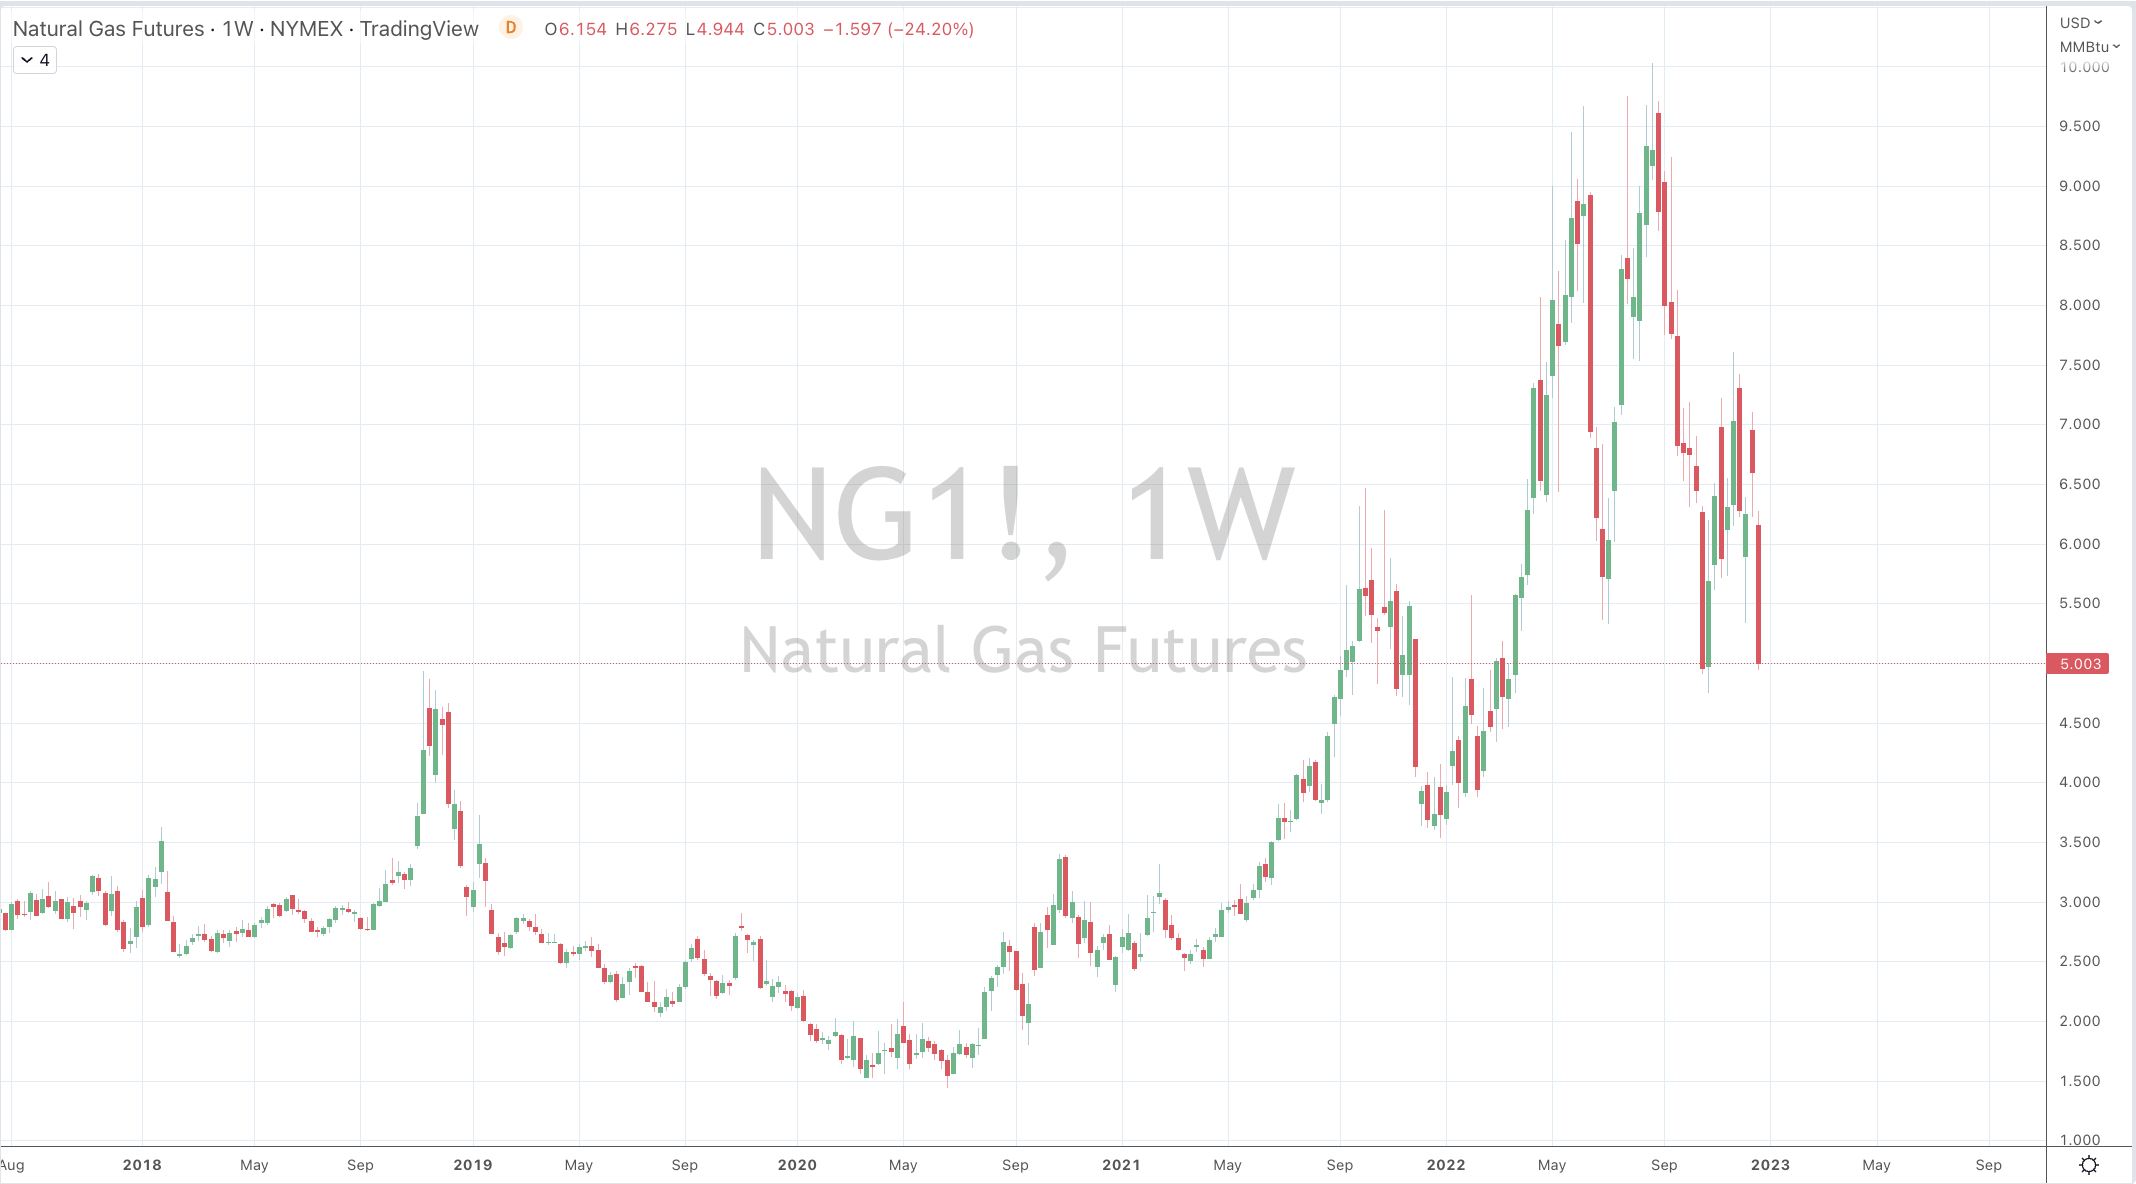
“On a daily trading basis, Henry Hub Natural Gas (NG) is my nearest buying candidate. Following today’s 5% decline (currently trading at $2.57), whether it tickles the $2.47 region is myopic.”
While, the front contract of NG trade down to $2.52 in the next 3 days, it then rallied ~ 38% in the next 30 days.
In that same note, I framed that short-term view with;
“Although, this may be a short-term trade where I scalp some returns, while I keep in mind that $2.10 could be seen if certain trend indicators exhibit strength.”
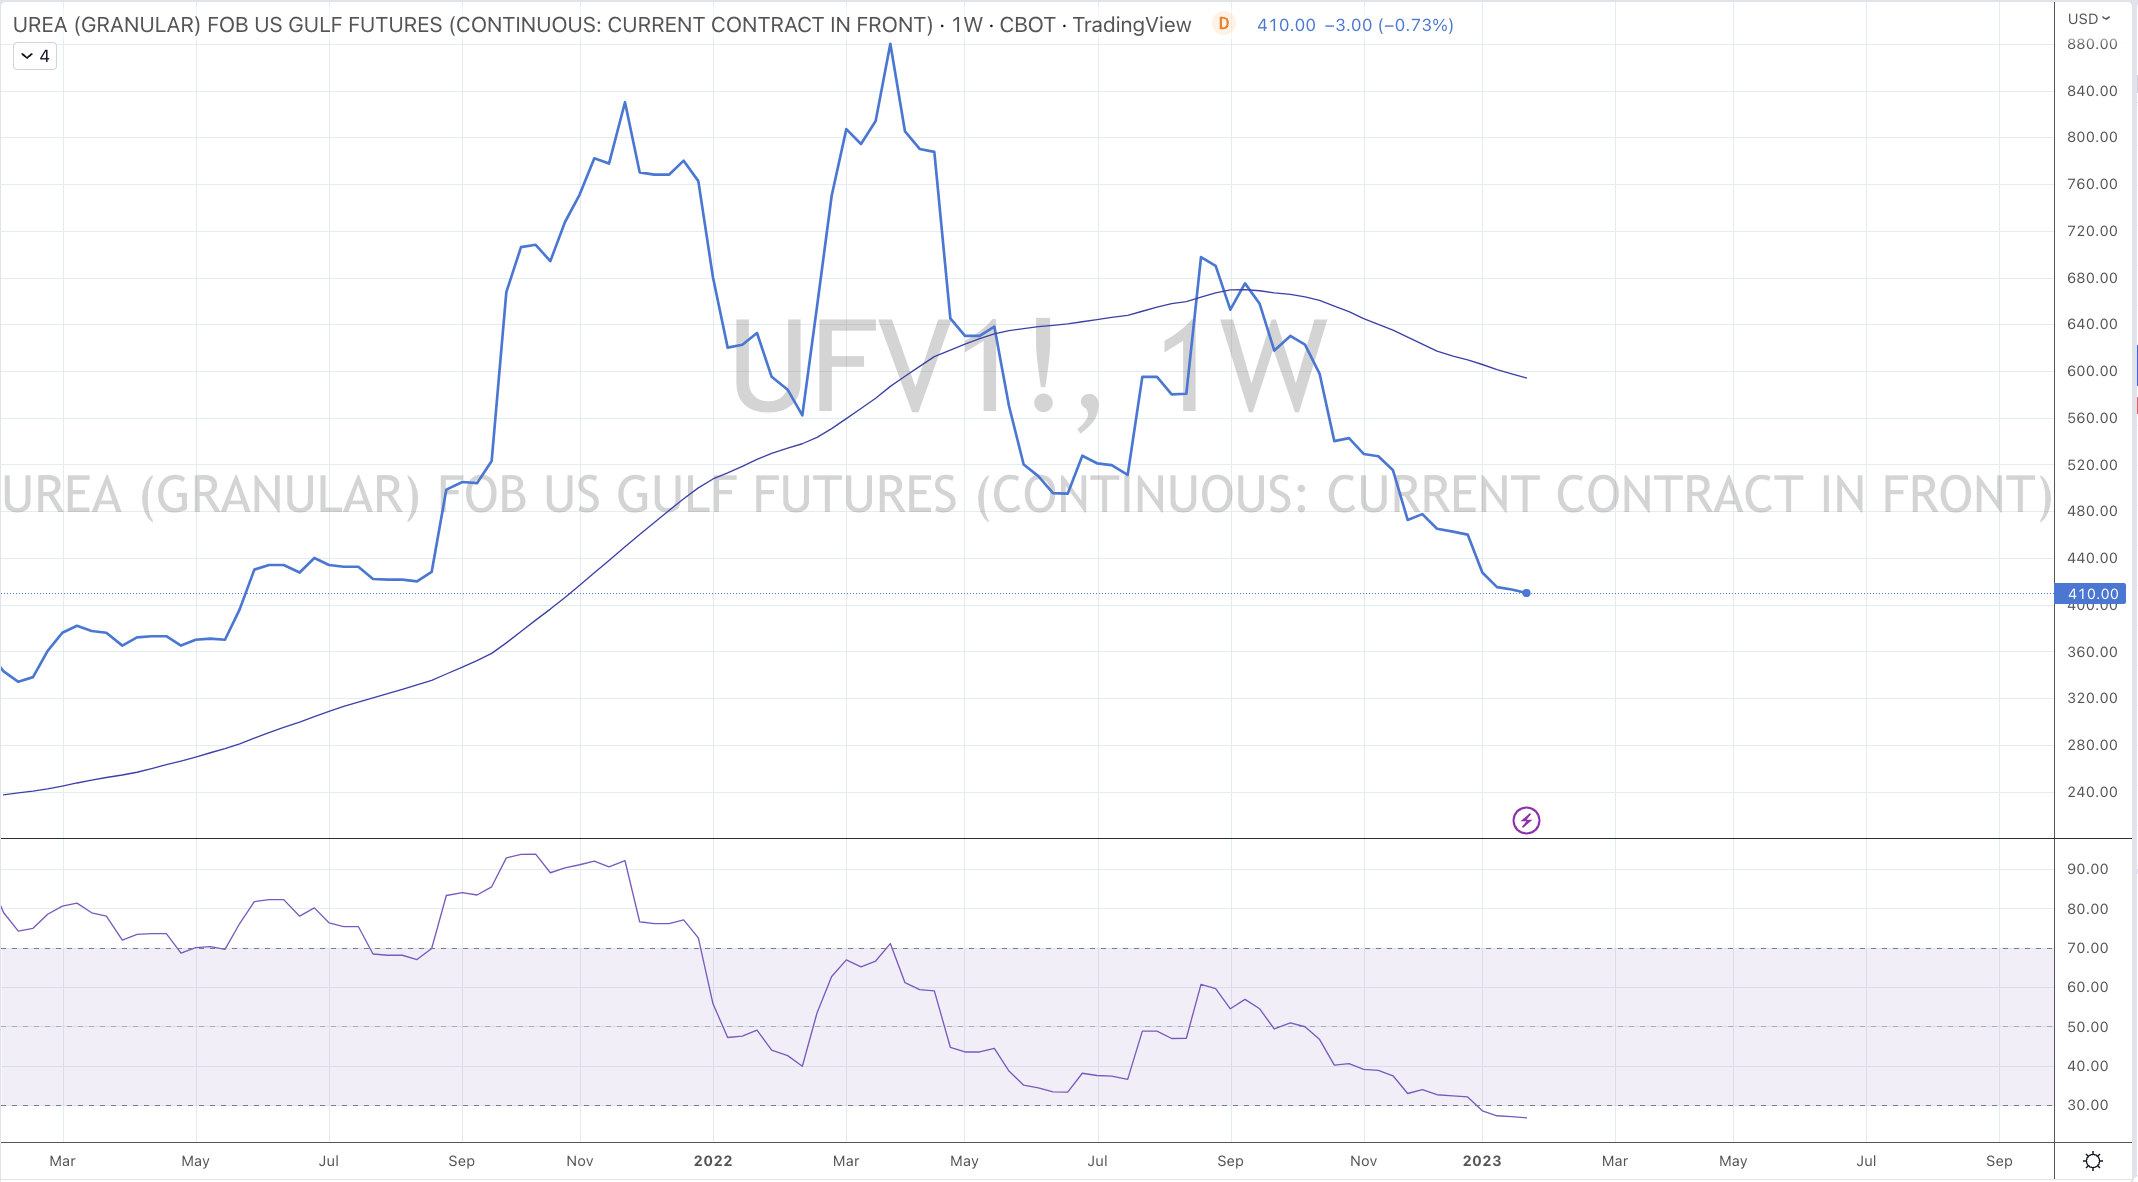
then in May 2024, I wrote that Natural Gas and Urea may be nearing their lows…..the former has continued to decline since, I think we are getting close but not yet.
Today, Henry Hub Natural Gas price is mired with news of supply glut and milder North American weather.
Today, NG prices traded to (and below) $2.10.
Today, I need to respect the downward trend before entering a long position.
July 18, 2024
by Rob Zdravevski
rob@karriasset.com.au