A weekly Macro, Cross Asset review of prices trading at extremes which may generate future investment ideas and opportunities.
The following assets (on a weekly timeframe) either registered an Overbought or Oversold reading and/or have traded more than 2.5 standard deviations above or below its rolling mean.
n.b. pricing of (commodity) futures contracts is only considering the immediate front month.
* denotes multiple week inclusion
Extremes above the Mean (at least 2.5 standard deviations)
Indian 10 year bond yield *
U.S. 3, 7, 10, 20 & 30 year bond yields
LNG priced in Yen
Natural Gas
S&P GSCI Index *
CRB Index
Dutch TTF Gas *
AUD/CAD *
AUD/EUR
AUD/GBP
AUD/SGD
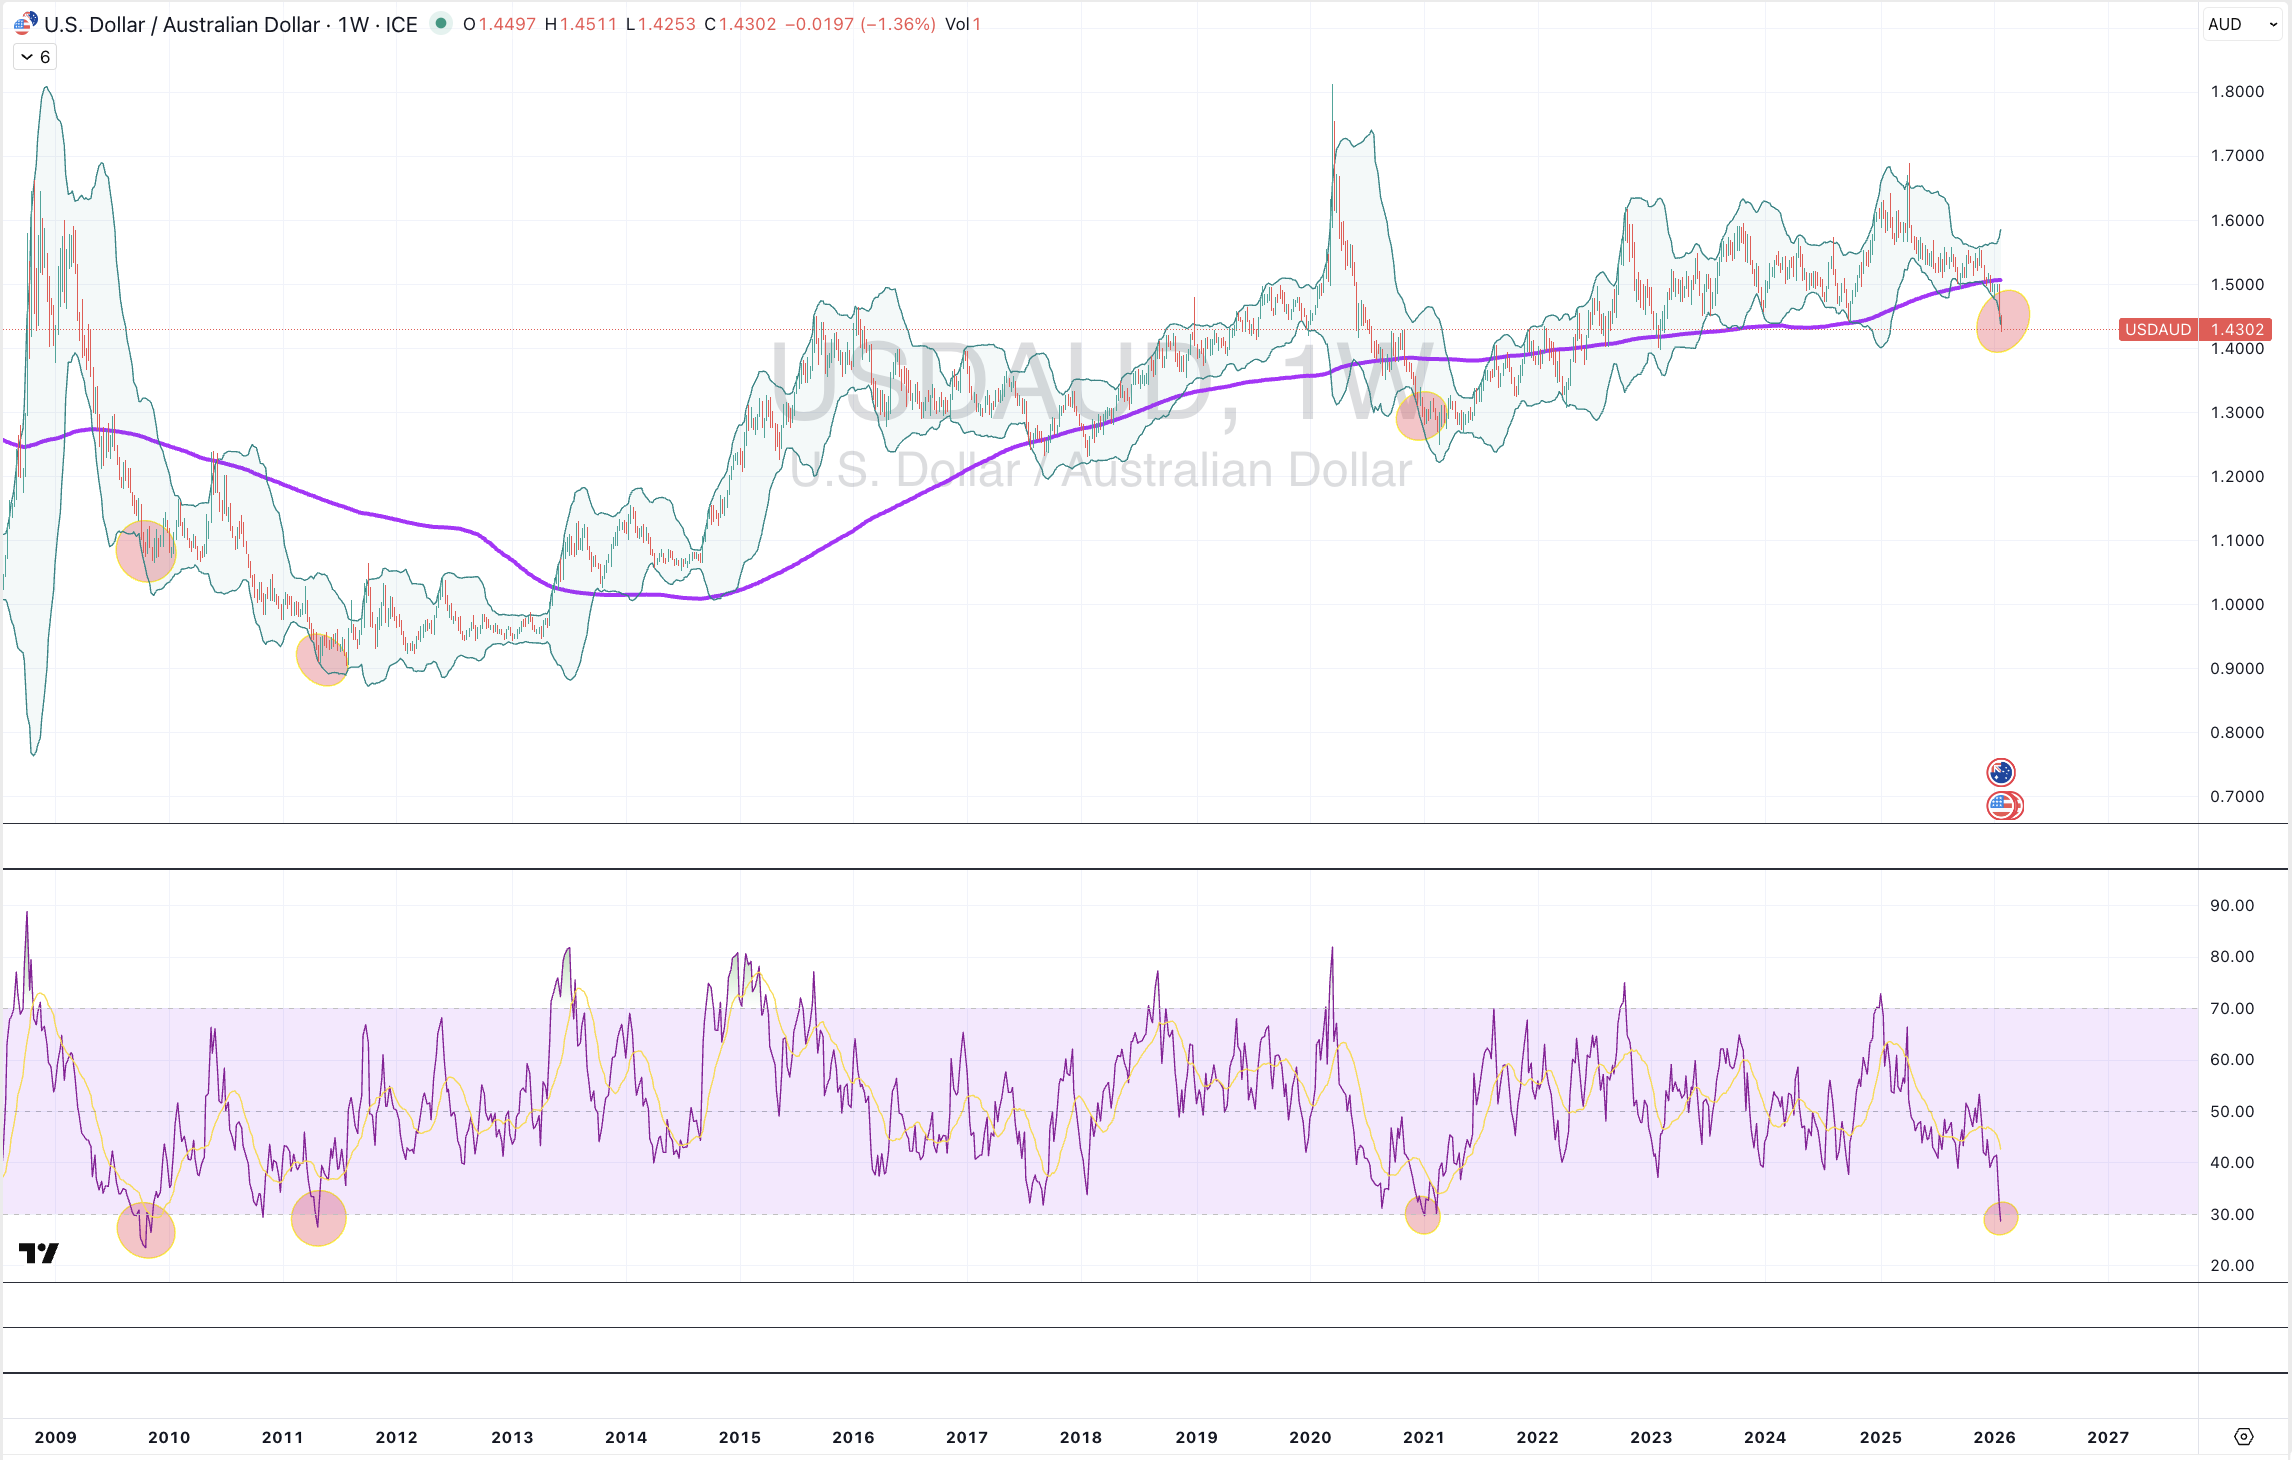
AUD/USD
CHF/USD
COP/USD *
RMB
S&P Small Cap 600 *
S&P Mid Cap 400 *
And the S&P 600
Overbought (RSI > 70)
Korean 10 year government bond yields *
Japanese 2 and 5 year bond yields *
Aluminium (CBOT & LME)
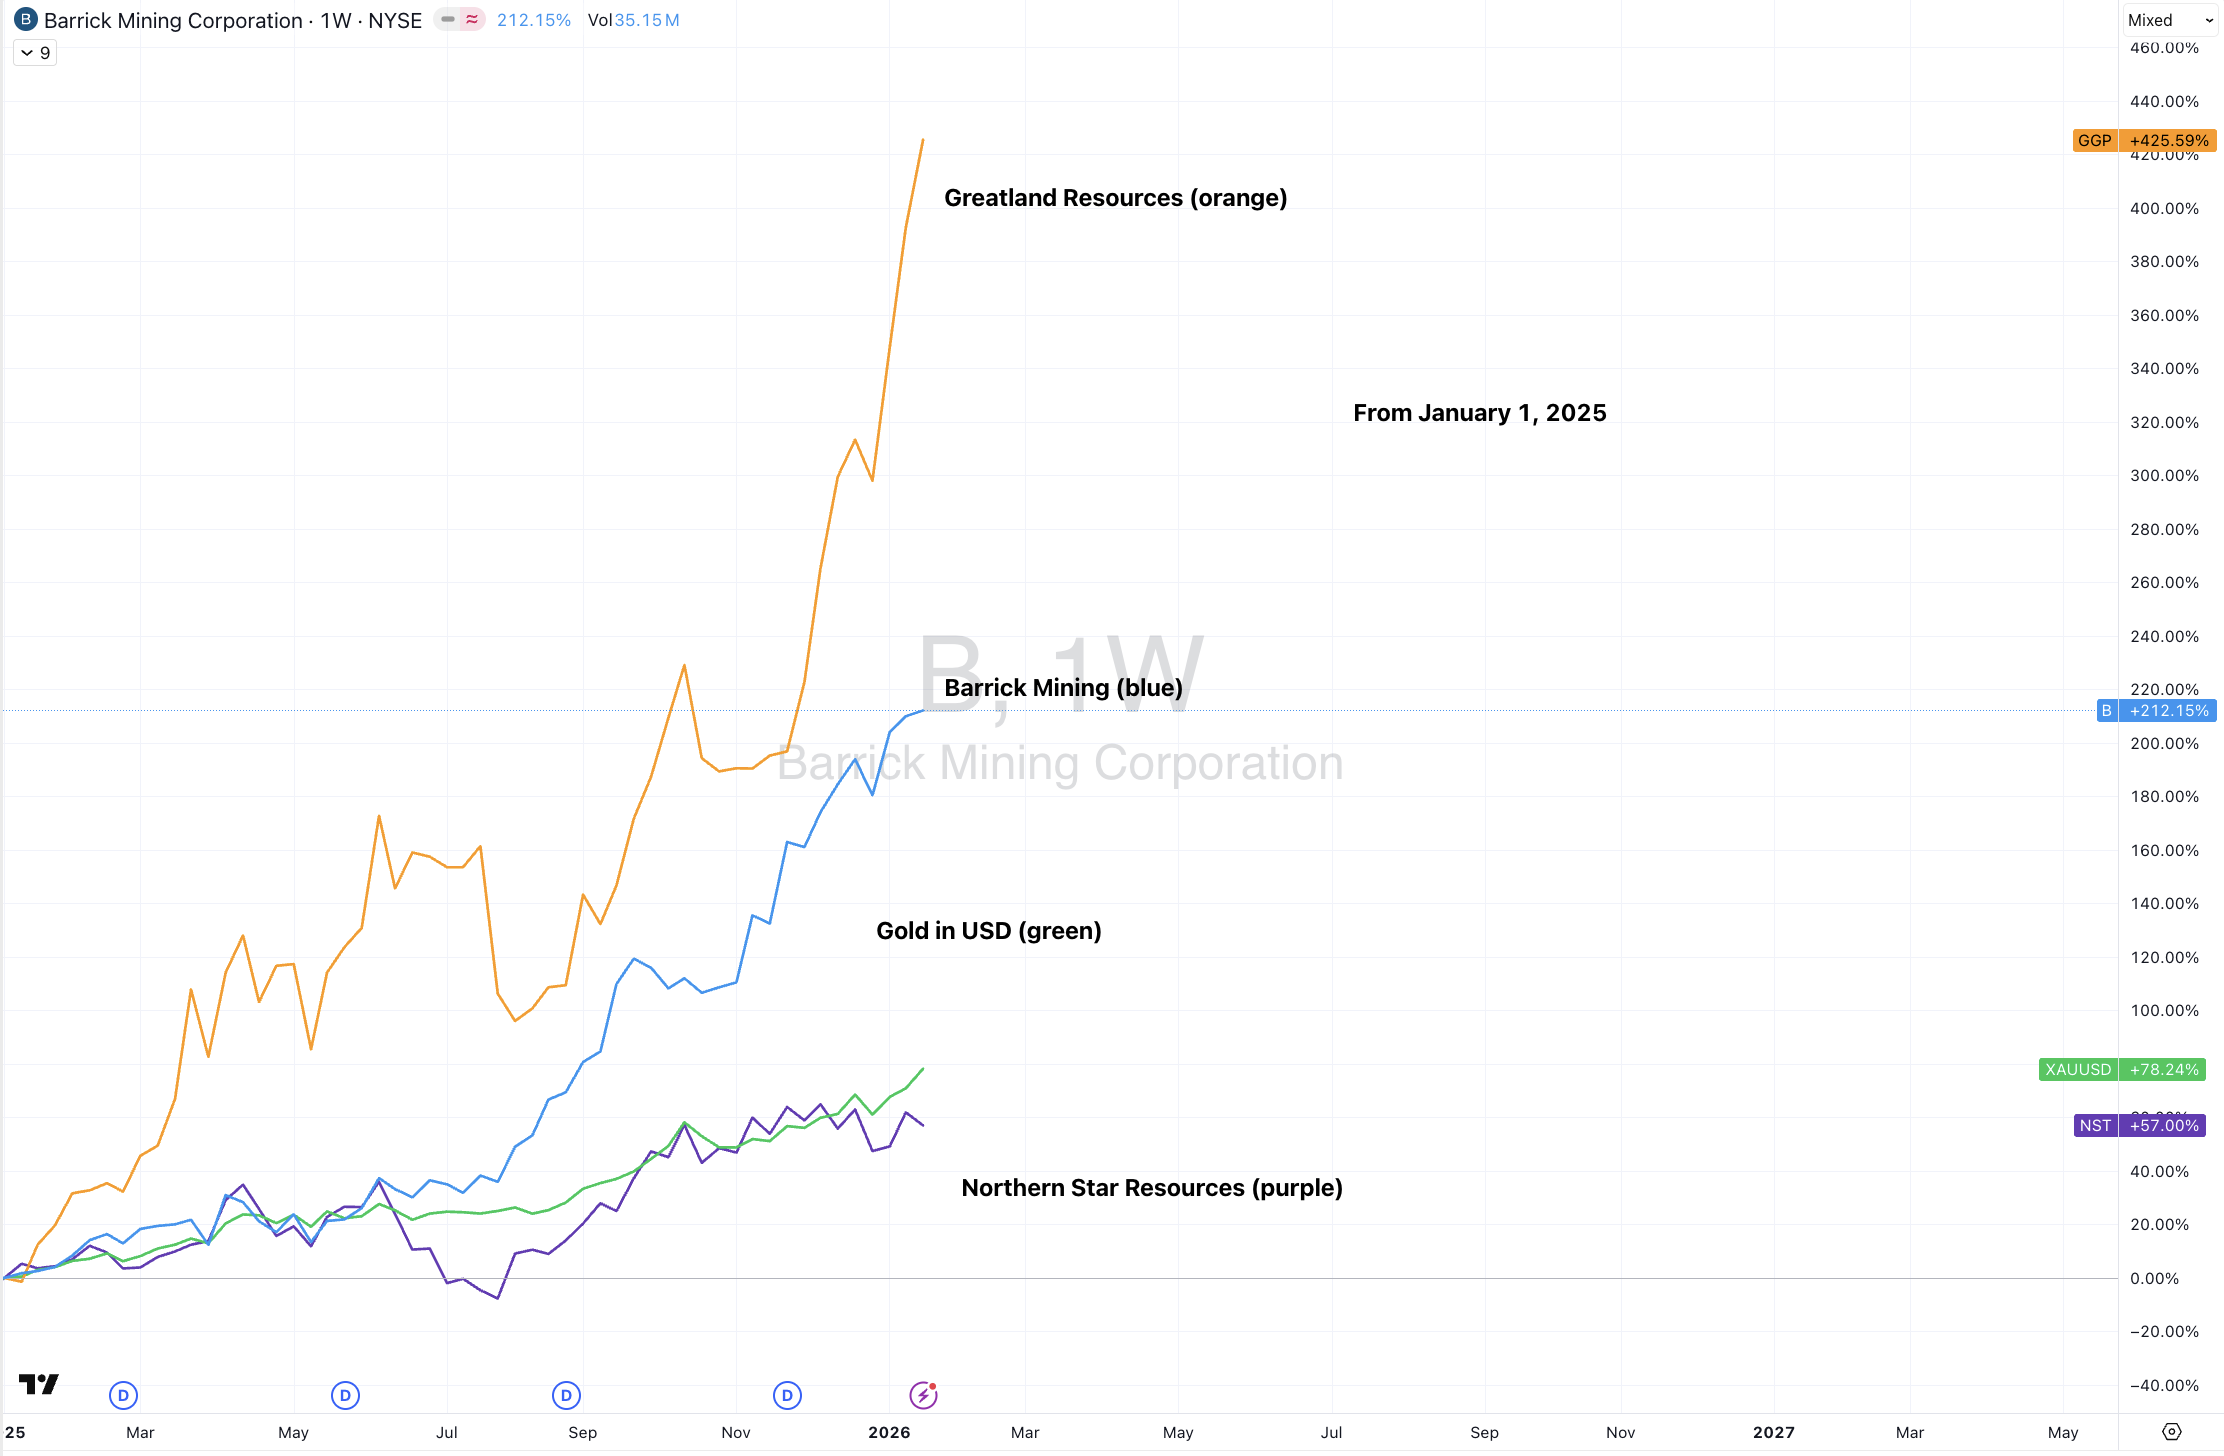
Gold in AUD, GBP & ZAR
AUD/JPY *
CHF/JPY
CNH/USD *
EUR/JPY *
GBP/JPY
MYR/USD *
Shanghai Composite *
All World Developed (ex USA) *
Austria’s ATX Index *
Indonesia’s IDX Composite Index *
Dow Jones Transports *
iShares Biotech Index
Spain’s IBEX *
Taiwan’s TAIEX
Malaysia’s KLSE *
Pakistan’s KSE Index *
South Korea’s KOSPI Index *
Nasdaq Biotech Index *
Japan’s Nikkei 225 *
Helsinki’s OMX *
Copenhagen’s OMX
Czechia’s PX Index *
South Africa’s SA40 equity Index *
Philadelphia Semiconductor Index (SOX)
Chile’s IGPA *
Israel’s TA35 *
Singapore’s Strait Times Index
Nasdaq Transports *
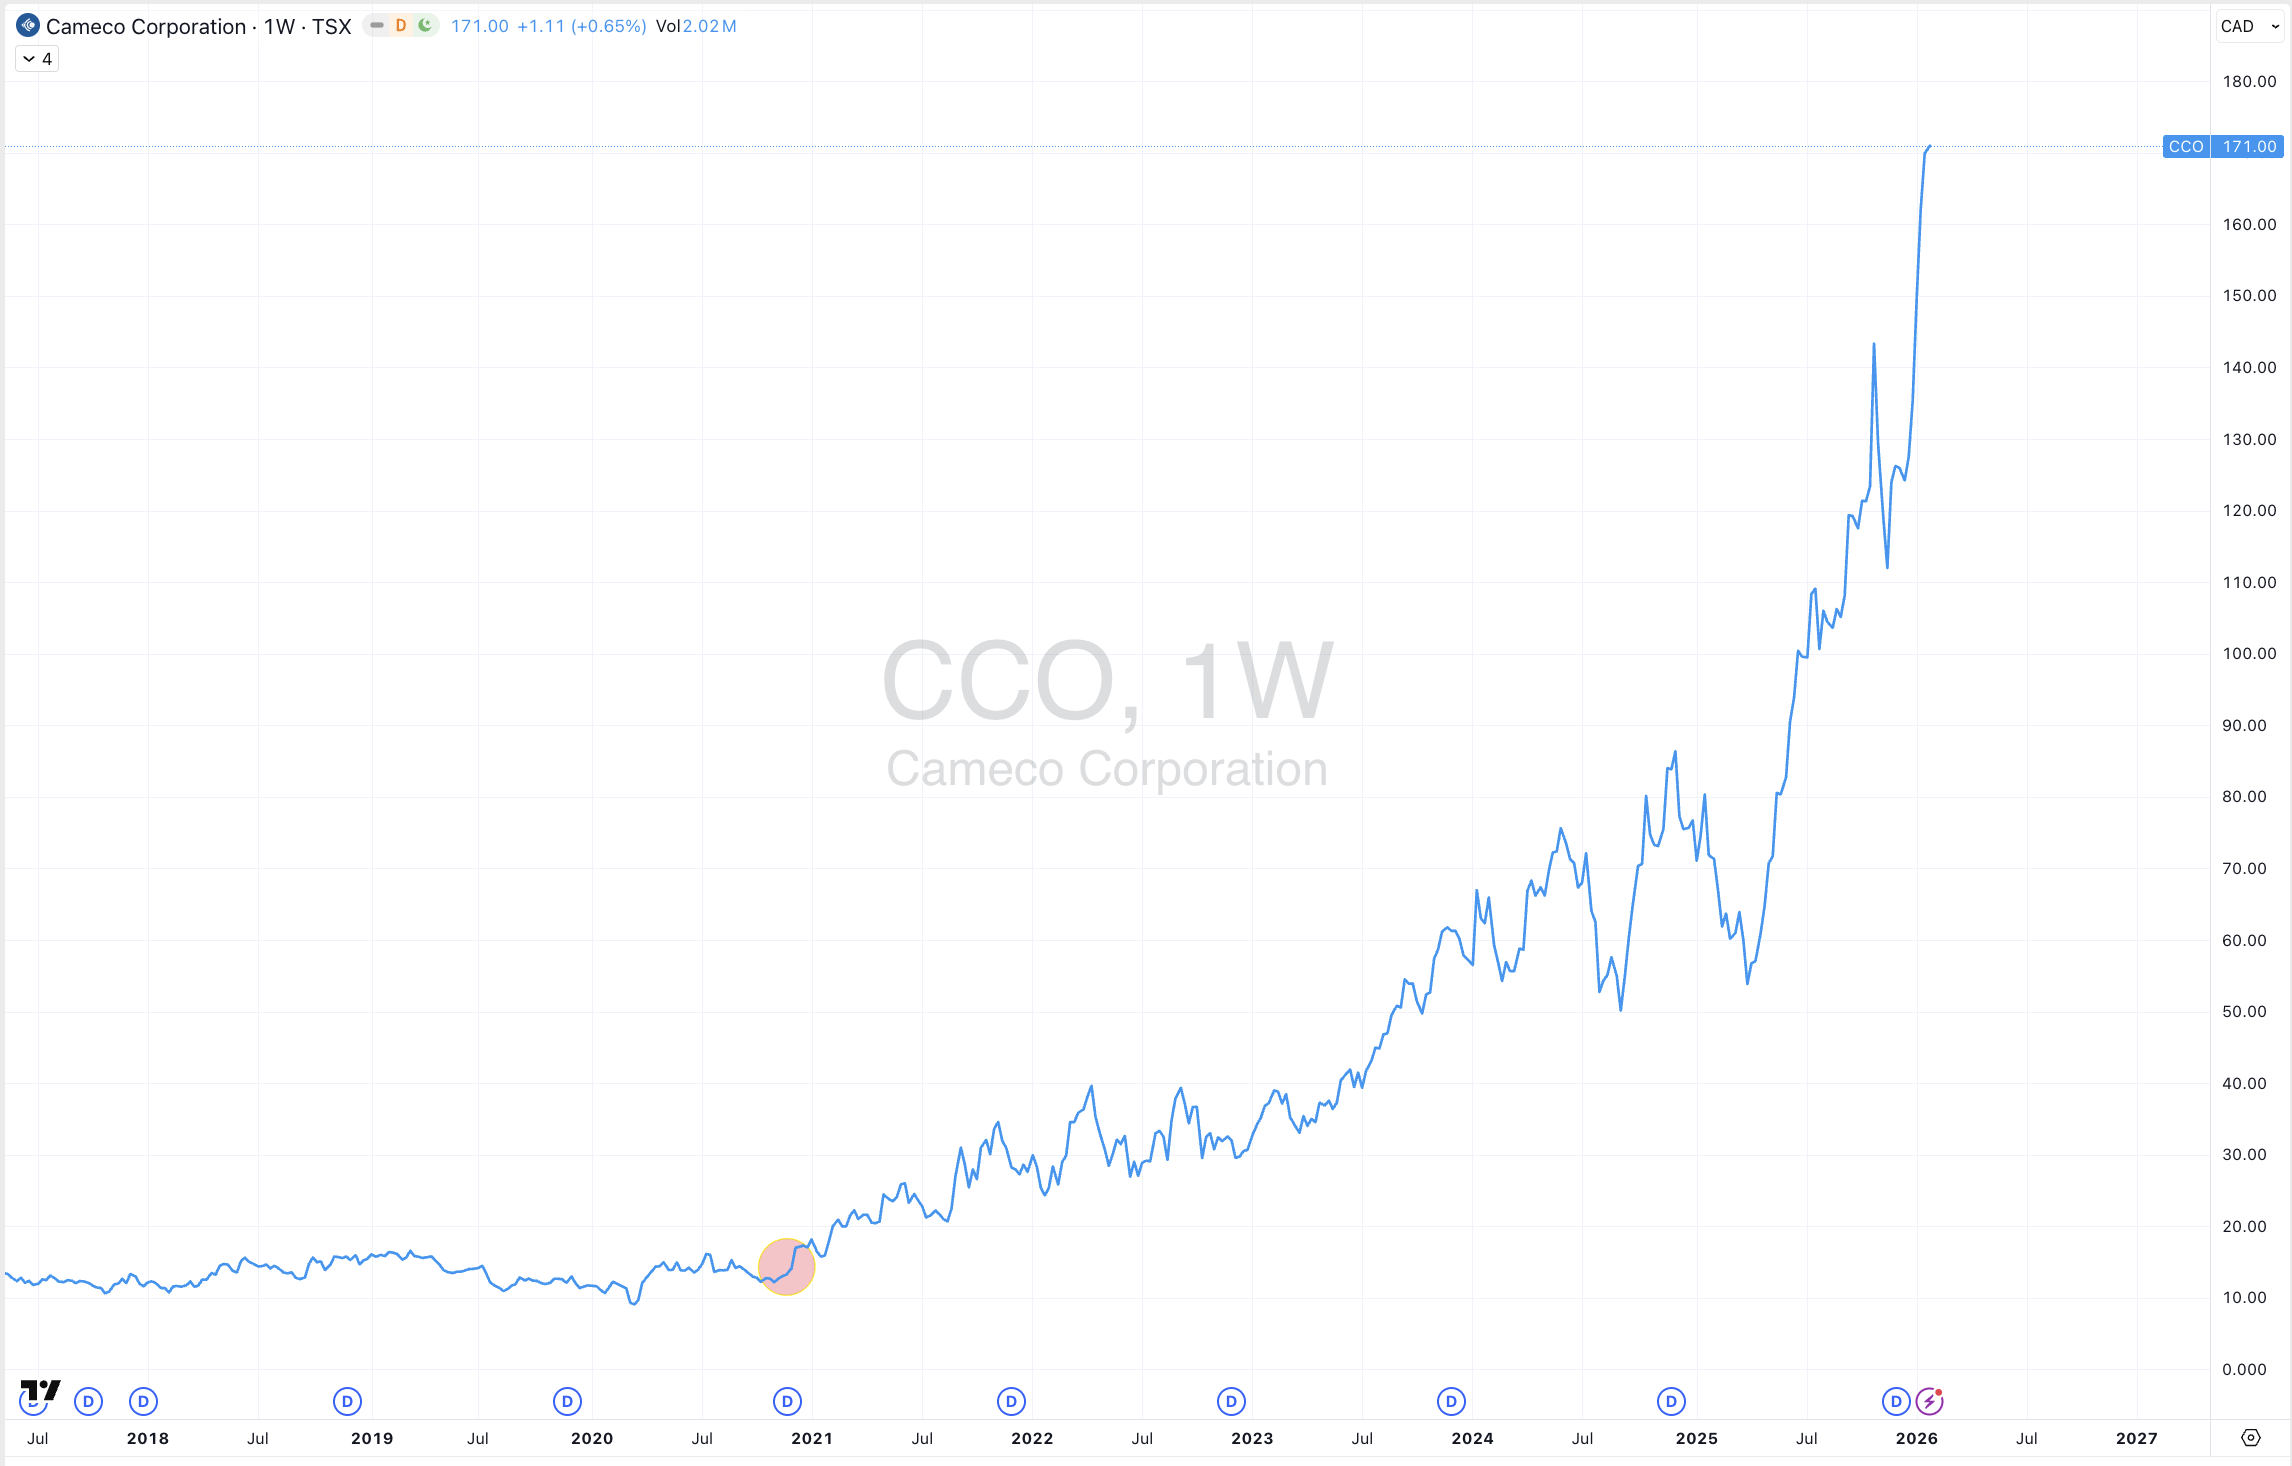
Canada’s TSX equity index *
FTSE 100 *
Poland’s WIG Index *
S&P Biotech Index *
ASX Small Caps
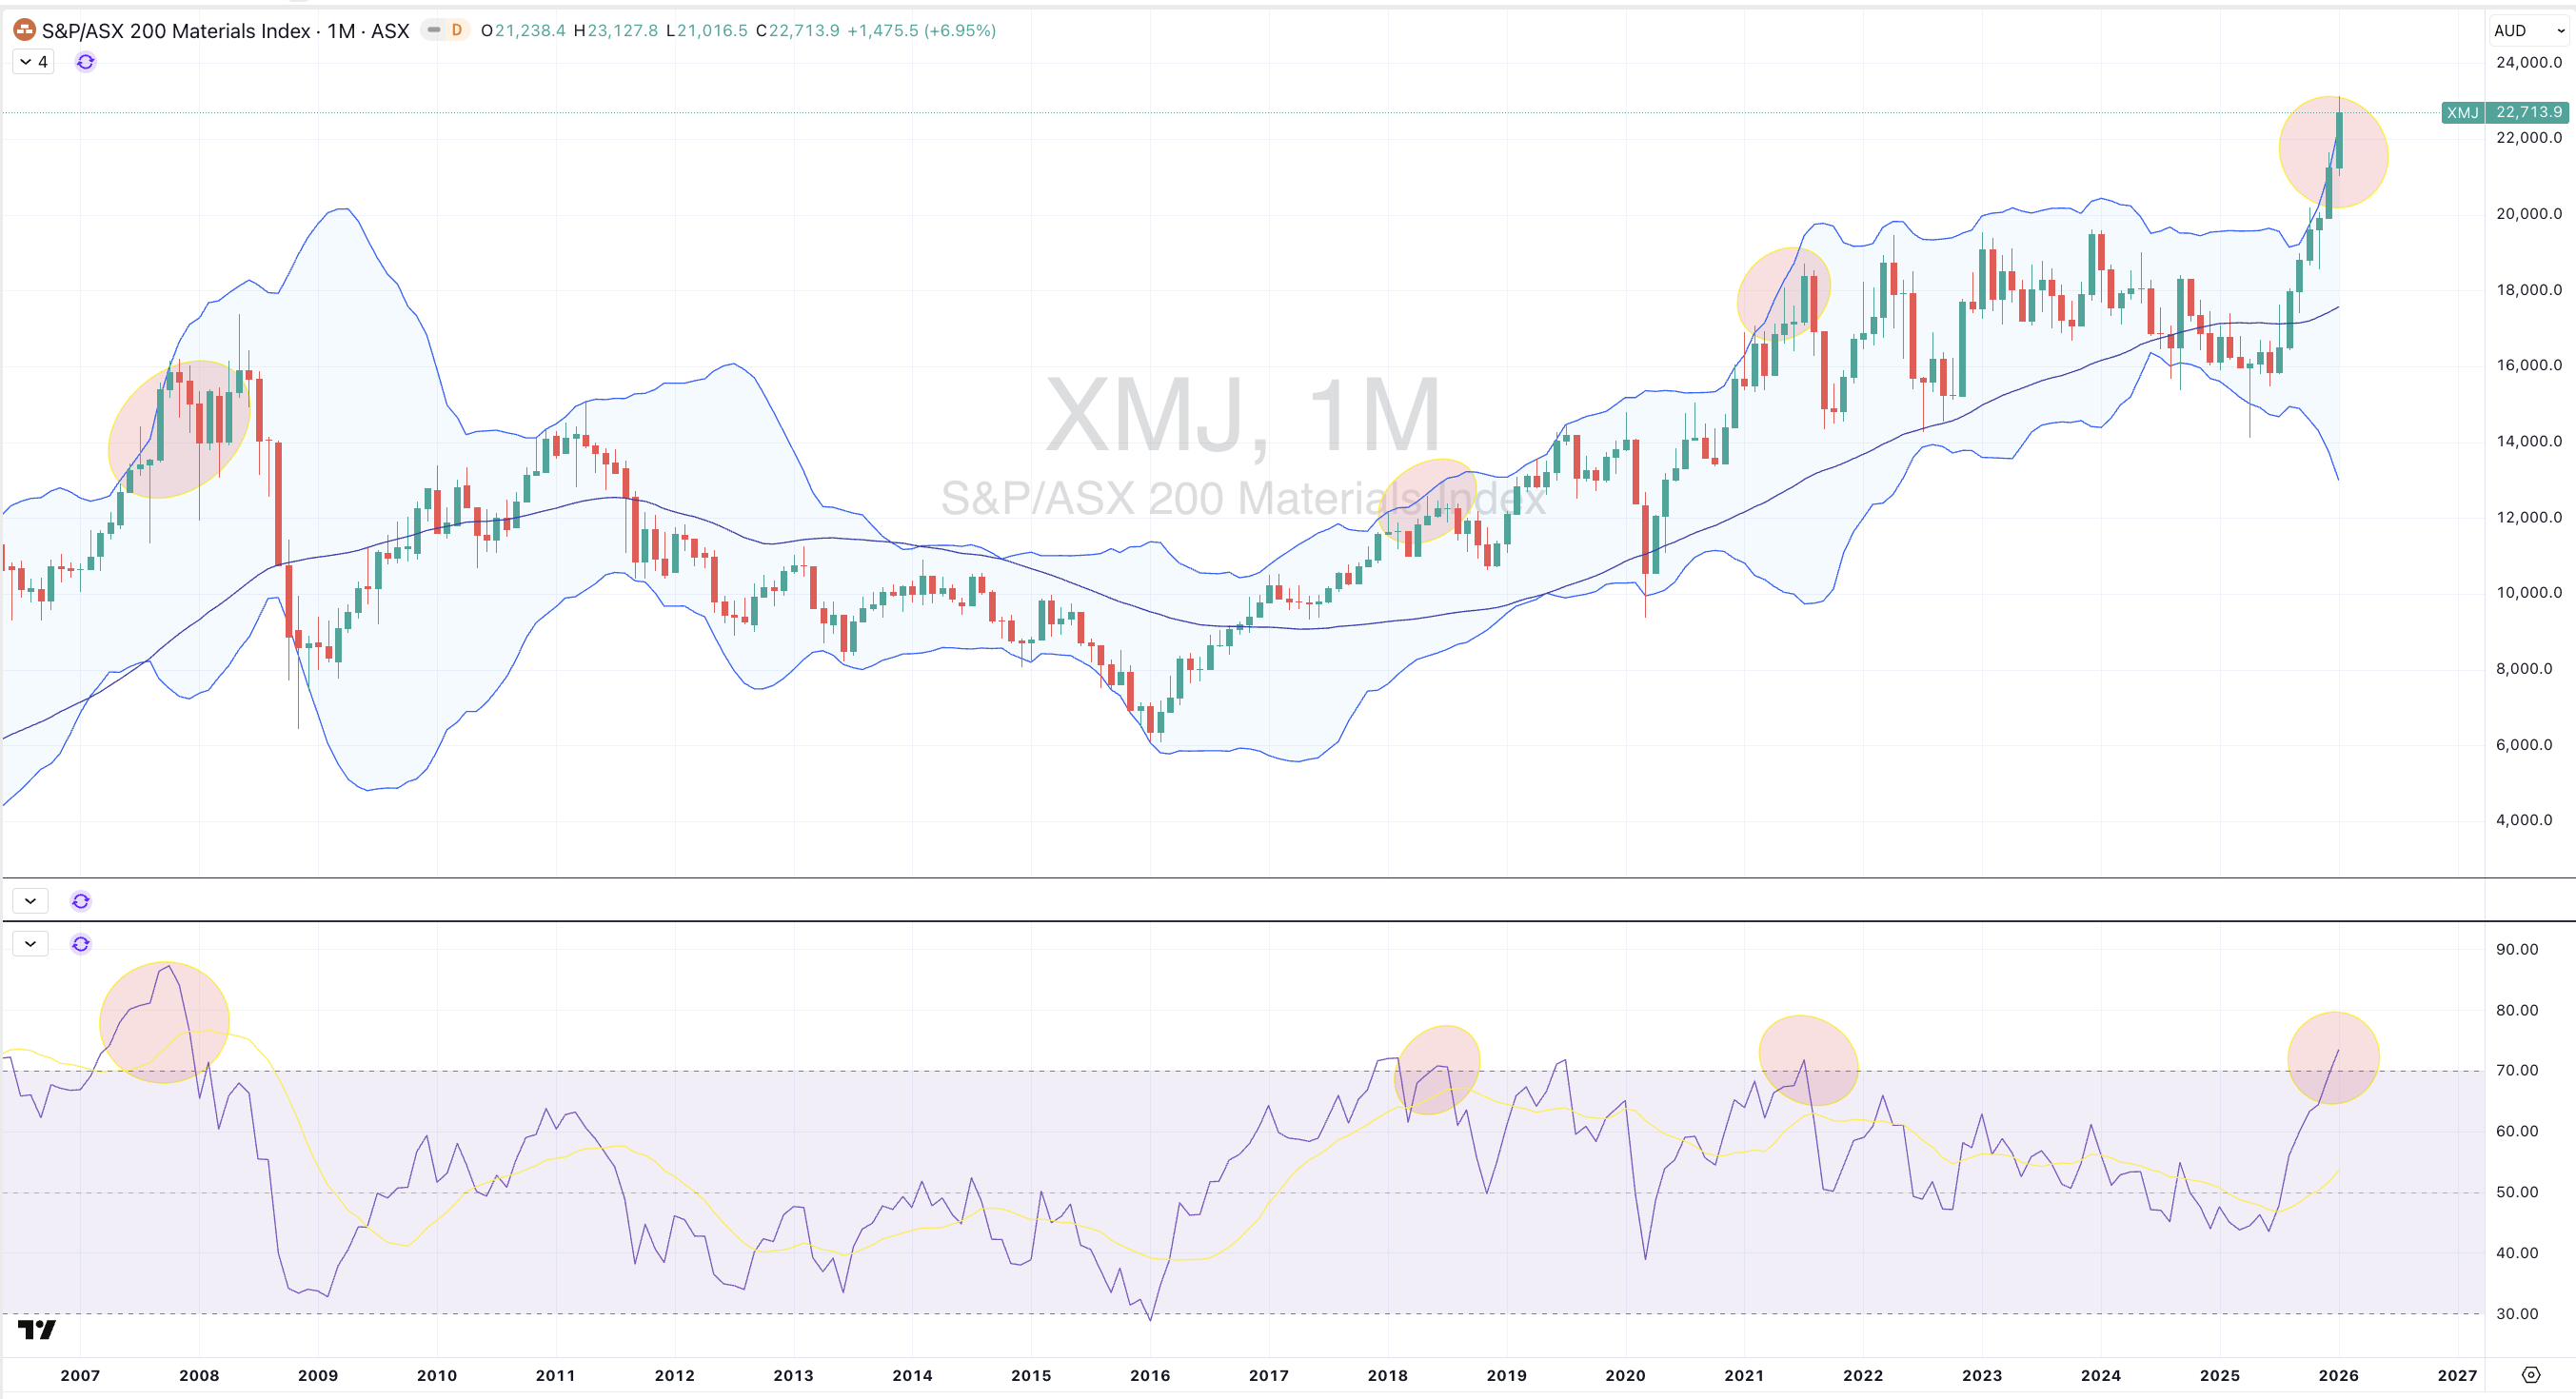
And the ASX Materials Index *
The Overbought Quinella (Both Overbought and Traded at > 2.5 standard deviations above the weekly mean)
Japanese 10 and 30 year bond yields
Australian Coking Coal
Bloomberg Commodity Index
Lithium Carbonate *
Lithium Hydroxide *
Tin *
Nickel *
Platinum
Uranium
Silver in AUD & USD *
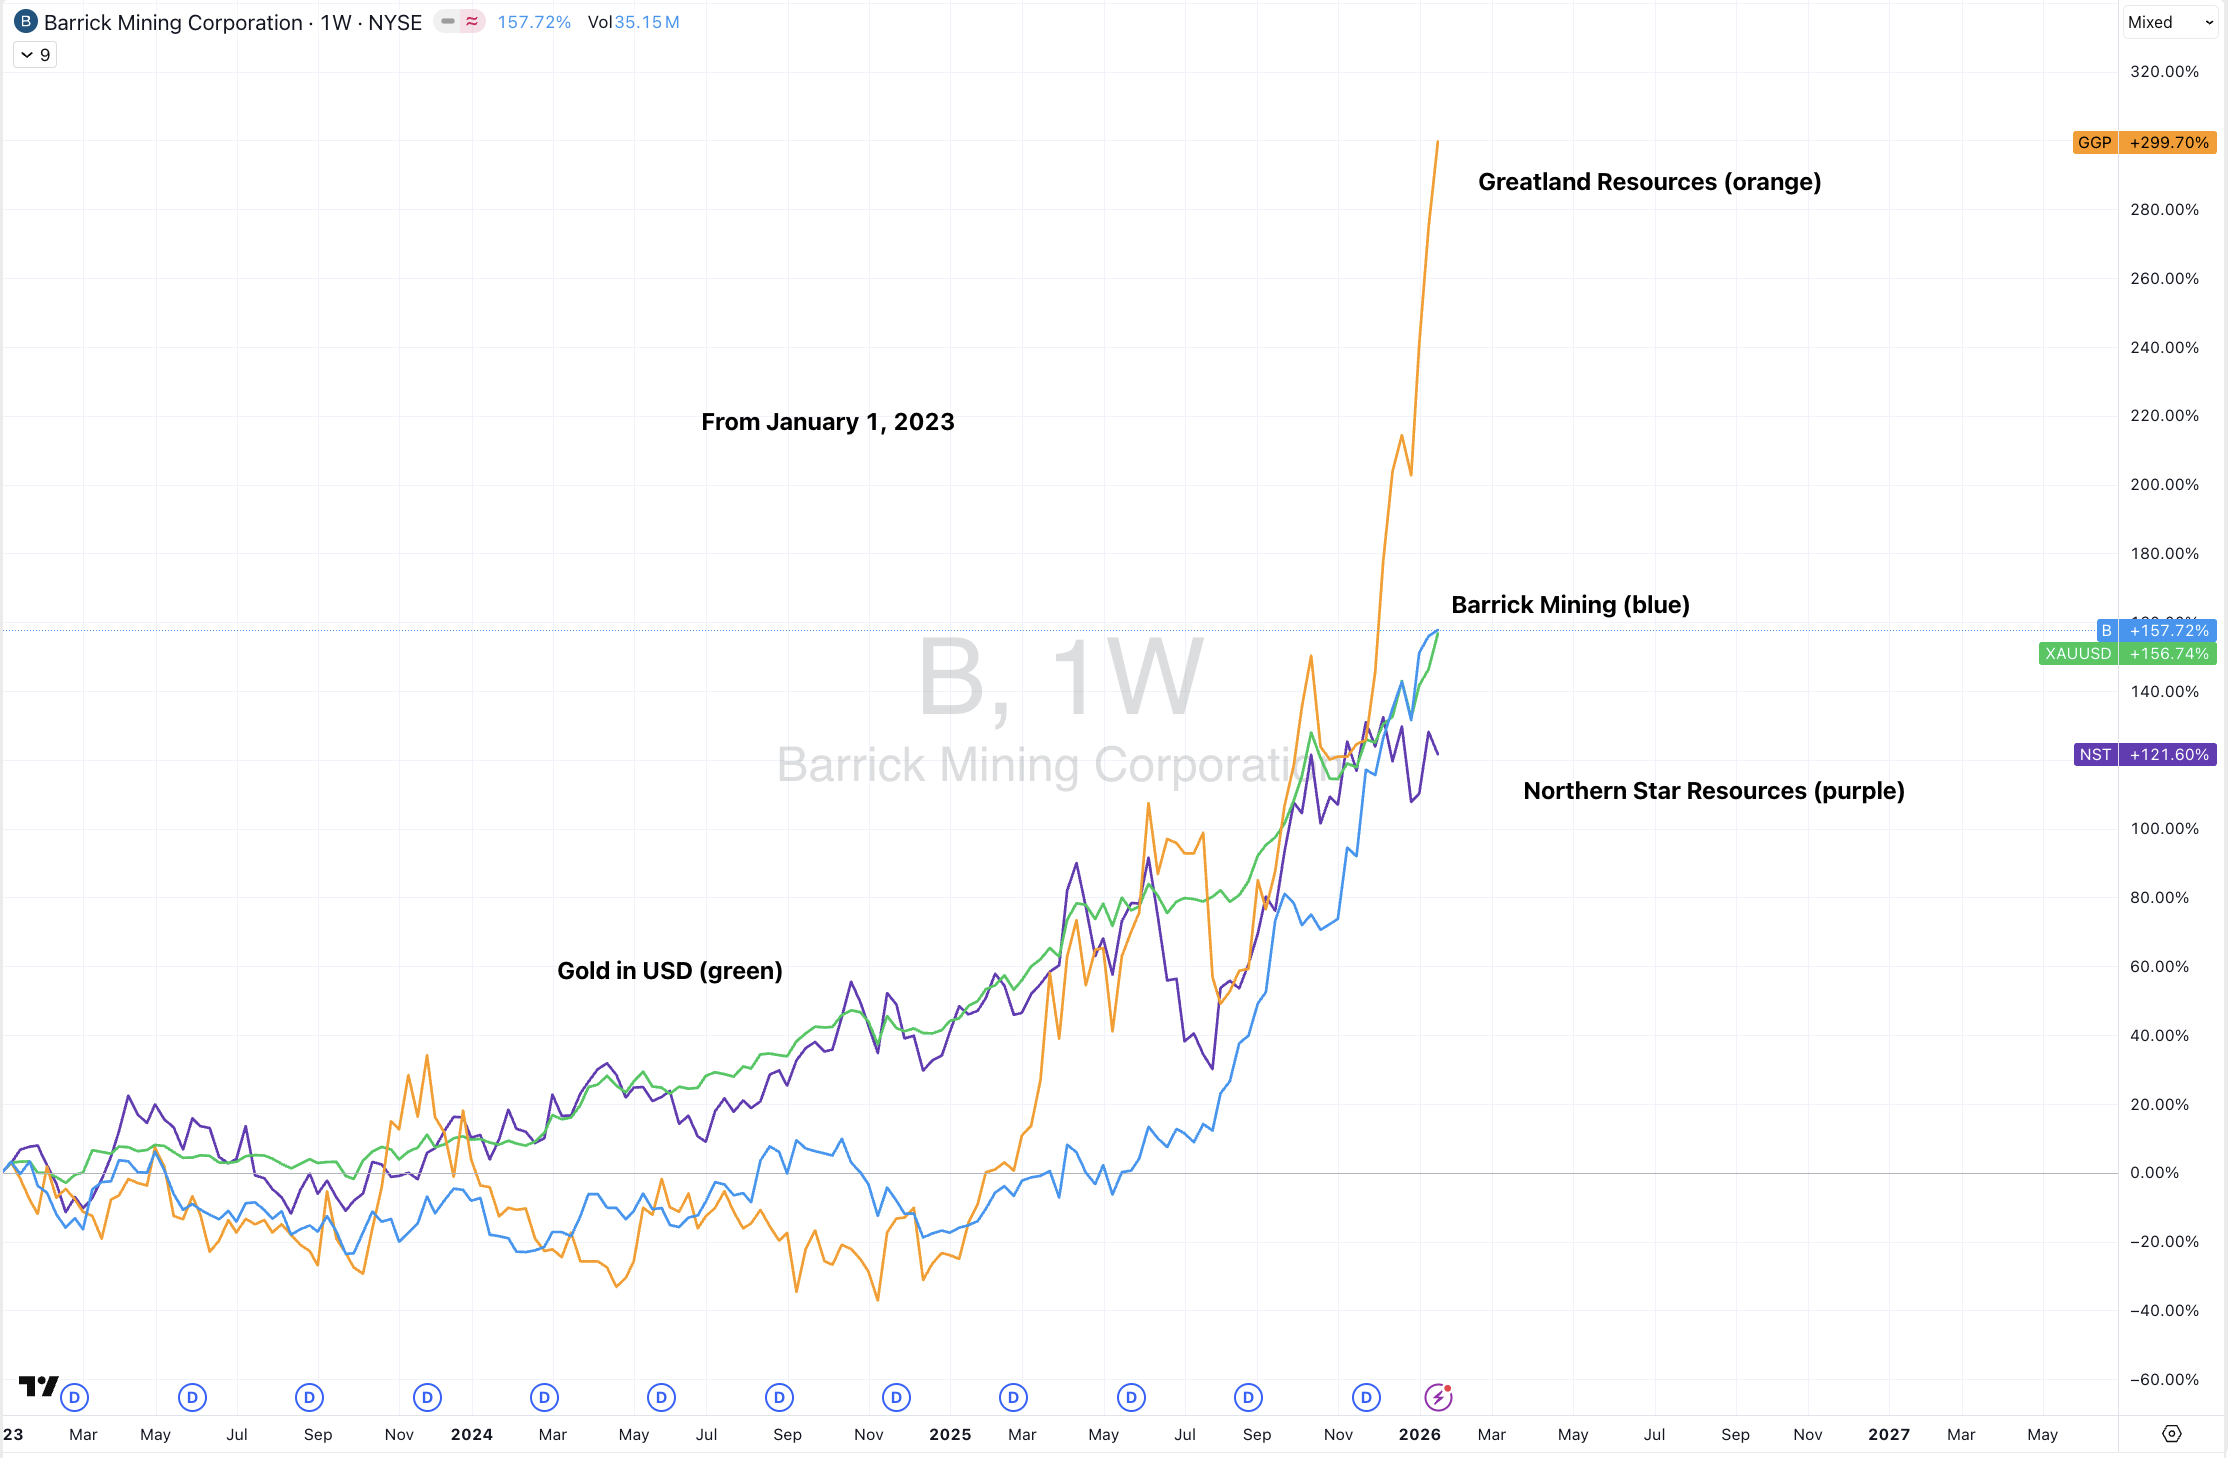
Gold in CAD, CHF, EUR and USD
AUD/IDR
AUD/INR
CLP/USD *
Hungary’s BUX Index *
Egypt’s EGX Index *
Brazil’s BOVESPA *
Mexico’s IPC Index
U.S. 600 Mid Caps
Vietnam’s VN Index *
And Turkiye’s BIST Index
Extremes below the Mean (at least 2.5 standard deviations)
Copper/Gold Ratio
Corn
CHF/AUD
USD/CHF
USD/SGD
Oversold (RSI < 30)
U.S. 3 month bill yield
Sugar #16 *
JPY/AUD *
USD/CLP *
The Oversold Quinella (Both Oversold and Traded at < 2.5 standard deviations below the weekly mean)
Cocoa
USD/MXN *
USD/SEK
USD/ZAR
Notes & Ideas:
Government bond yields rose.
Aussie curve near overbought.
AU10-2 spread ner overbought too.
U.S. high yield ‘yields’ are falling.
IEF mean reverted.
Japanese yield climbing streaks continue.
Chilean 2’s left oversold territory.
Chilean 10-2 spread isn’t overbought.
Korean 10 year yields have risen for 5 weeks.
U.S. 3 month bill yield is close to oversold, for first time since August 2025.
U.S. 3 year bond yield has advanced for 5 weeks, while the 3’s and 5’s mean reverted, upwards.
Equities bias was for lower prices.
We are seeing a growing list of indices registering overbought extremes.
The TA35 and BIST have climbed for 4 weeks.
TAIEX, KOSPI, FCATC and STI are in 5 week winning streaks.
The FTSE 250 and the SOX have risen for 6 weeks.
Poland’s WIG has climbed for 7 weeks.
The All World Developed-ex USA & Austria’s ATX have climbed for 9 weeks.
Pakistan’s KSE and Nasdaq Transports have soared for 11 straight weeks.
Copenhagen and PSE snapped 4 weeks of higher prices.
Helsinki and Stockholm fell and broke 5 winning weeks.
And Norway’s OBX, Czechia’s PX and Spain’s IBEX fell and broke 8 weeks of advance.
Commodities were mixed but mostly higher, again.
Gases, Oil, Fuels, Shipping Rates, Nickel, Tin, Tin and Precious Metals were the notable gainers.
Cocoa, Lumber, Sugar and Oats were the few decliners.
Heating Oil has risen for 4 weeks.
Brent and WTI Crude are in a 5 week winning streak.
Lithium Hydroxide has advanced for 6 weeks.
The U.S. Gulf Urea price and Orange Juice have risen for 7 weeks.
Australian Coking Coal has soared for 8 weeks.
Uranium’s winning streak extends to 9 weeks.
Newcastle Coal has mean reverted.
Baltic Dry Index rose and broke 5 weeks of decline.
Cocoa has sunk for 4 weeks but its collapse following its parabolic rise is more impressive.
North European Hot Rolled Coil Steel is also in a 4 week losing streak.
Palladium rose but didn’t make a new high.
Rubber fell and snapped a 6 week advance.
While Natural Gas rose 70% for the week, snapping a 6 week losing streak and easily recovering its 38% loss over that time.
Currencies were busier, but mixed.
Many Aussie (risk-on) and Yen (risk-off) pairs are back in the list.
CAD was weaker.
AUD/EUR has risen for 5 weeks.
GBP/EUR is in a 6 winning streak.
CHF/AUD has fallen for 5 weeks.
PHP/USD rose and broke its 4 week losing streak.
Inversely, the USD/INR has climbed for 5 weeks.
And, the USD has fallen against the South African Rand for 9 weeks.
The larger advancers over the past week comprised of;
Aluminium 1.6%, Bloomberg Commodity Index 5.3%, Brent Crude 2.7%, Baltic Dry Index 12.4%, WTI Crude 2.9%, Palm Oil 2.5%, Copper 2%, Heating Oil 5.3%, LNG in Yen 12.4%, Lithium Hydroxide 2.6%, LME Aluminium 3.1%, Natural Gas 70%, Nickel 6.5%, Orange Juice 4.3%, Palladium 11.3%, Platinum 18%, Gasoline 3.1%, Robusta Coffee 3.6%, Tin 18.1%, S&P GSCI 3.8%, CRB Index 3.4%, Dutch TTF Gas 8.5%, Gasoil 3.2%, Uranium 4.4%, Silver in AUD 11.2%, Silver in USD 14.7%, Gold in AUD 5.2%, Gold in CAD 6.8%, Gold in CHF 5.4%, Gold in EUR 6.4%, Gold in GBP 6.4%, Gold in USD 8.5%, Gold in ZAR 6.3%, Wheat 2.2%, BUX 2.3%, EGX 7.2%, IBB 3.2%, Bovespa 8.5%, TAIEX 1.8%, KSE 2.2%, KOSPI 3.1%, Mexico 1.6%, NBI 3.1%, SA40 1.9%, SET 3%, IGPA 3%, XBI 3.1%, ASX Materials 1.5% and BIST rose 2.6%.
The group of largest decliners from the week included;
LME Cocoa (19%), CBOT Cocoa (17%), Lumber (2.4%), Sugar (1.5%), Oats (1.6%), KBW Banks (2%), CAC (1.4%), China A50 (2.3%), DAX (1.6%), MIB (2.1%), NIFTY (2.5%), PSE (2%), PX (1.5%), Sensex (2.4%), SMI (2%), ASX Financials (1.9%) and the ASX Industrials fell 1.5%.
January 25, 2026
By Rob Zdravevski
rob@karriasset.com.au