Bitcoin doesn’t march to its own drum
June 12, 2025 Leave a comment
Ya know that Bitcoin’s USD price is close correlated to the S&P 500 Index….
and when it’s not, often the SPX rises against BTC’s decline.
June 12, 2025
rob@karriasset.com.au

Trying to hear what's not being said
June 12, 2025 Leave a comment
Ya know that Bitcoin’s USD price is close correlated to the S&P 500 Index….
and when it’s not, often the SPX rises against BTC’s decline.
June 12, 2025
rob@karriasset.com.au
December 11, 2024 Leave a comment
Since November 1st, 2024, lululemon Athletica’s stock price has risen as much as Bitcoin.
The share price of Coinbase has nearly doubled the return produced by Bitcoin.
For all its financial engineering, MicroStrategy is somewhere in between.
p.s. I’ve sold the LULU holding and halved the Bloom Energy and Shopify positions.
December 11, 2024
by Rob Zdravevski
rob@karriasset.com.au
November 1, 2024 Leave a comment
Yesterday, I pasted some numbers of where Bitcoin (BTC/USD) has traded as a percentage above its 200 week moving average.
It’s been frothier while it confirms the mood to accept greater amounts of risk.
November 1, 2024
rob@karriasset.com.au

September 26, 2024 Leave a comment
The strength of Bitcoin’s (BTC/USD) daily trend is waning.
It’s weekly trend is turning lower.
I’ll look for it to trade to $50,400 (+/- $1,000) before deciding on a call for a call to $40,000.
In the interest of correlating BTC/USD to the mood in risk taking, I’ve overlaid the AUD/JPY in the chart below.
September 26, 2024
by Rob Zdravevski
rob@karriasset.com.au

September 20, 2022 Leave a comment
Bitcoin’s price action, trend and sentiment suggests it tests somewhere around the US$16,000 mark. +/- $600.
A drop in Bitcoin’s 30 day volatility precedes a trough in the price of BTC/USD which precedes ‘one more decline’ in the S&P 500 before itself finds a floor.
This would put my S&P 500 target around 3,645.
A bottoming process which builds into a rally in these two markets would cause much damage to all those huddled on the other side of the boat.
p.s. The direction Bitcoin also has reasonably good correlation with the Australian Dollar and commodity prices.
September 20, 2022
by Rob Zdravevski
rob@karriasset.com.au
March 11, 2022 Leave a comment
As a proxy and correlation for ‘risk-on’ and risk-off’ sentiment, Bitcoin is once again poised at a support level (~$38,000) worth watching.
And more so, as it remains in a medium term downtrend.
Failing to hold this near term support, Bitcoin should visit the $29,700 (+/- $250) area.
Such a 24% decline should coincide with my previous writings about a 20% decline in the S&P 500.
March 11, 2022
by Rob Zdravevski
rob@karriasset.com.au

January 6, 2022 Leave a comment
Bitcoin needs to hold $42,333 for now.
It’ll be telling for other risk assets,
Bitcoin could see the $26,000 – $23,000 level
More on other support levels #bitcoin later,
but isn’t trading at 500% above its 200 weekly moving average anymore, instead it’s now 126%.
Below is a weekly chart, the 200 week moving average has risen from $15,000 to $20,000 over the past 4 months, which is in keeping with my price and moving average convergence post dated, October 18, 2021.
January 6, 2021
by Rob Zdravevski
rob@karriasset.com.au
November 19, 2021 Leave a comment
But I thought crypto currencies were decentralised, anonymously owned/transacted and many steps removed from ‘the man’?
November 18, 2021 Leave a comment
$700 million for 20 years.
That’s a bit more than the $100 million / 30 years deal Enron had for Astro Field naming rights.
I wish we could read the Force Majeure clause
Is this a harbinger for the crypto industry?
History doesn’t suggest immediately and not within the next 2 years.
But it’s certainly a shift from having a naming rights sponsor who sells paperclips to one involved in the burgeoning industry of ‘crypto’.
November 17, 2021
by Rob Zdravevski
rob@karriasset.com.au
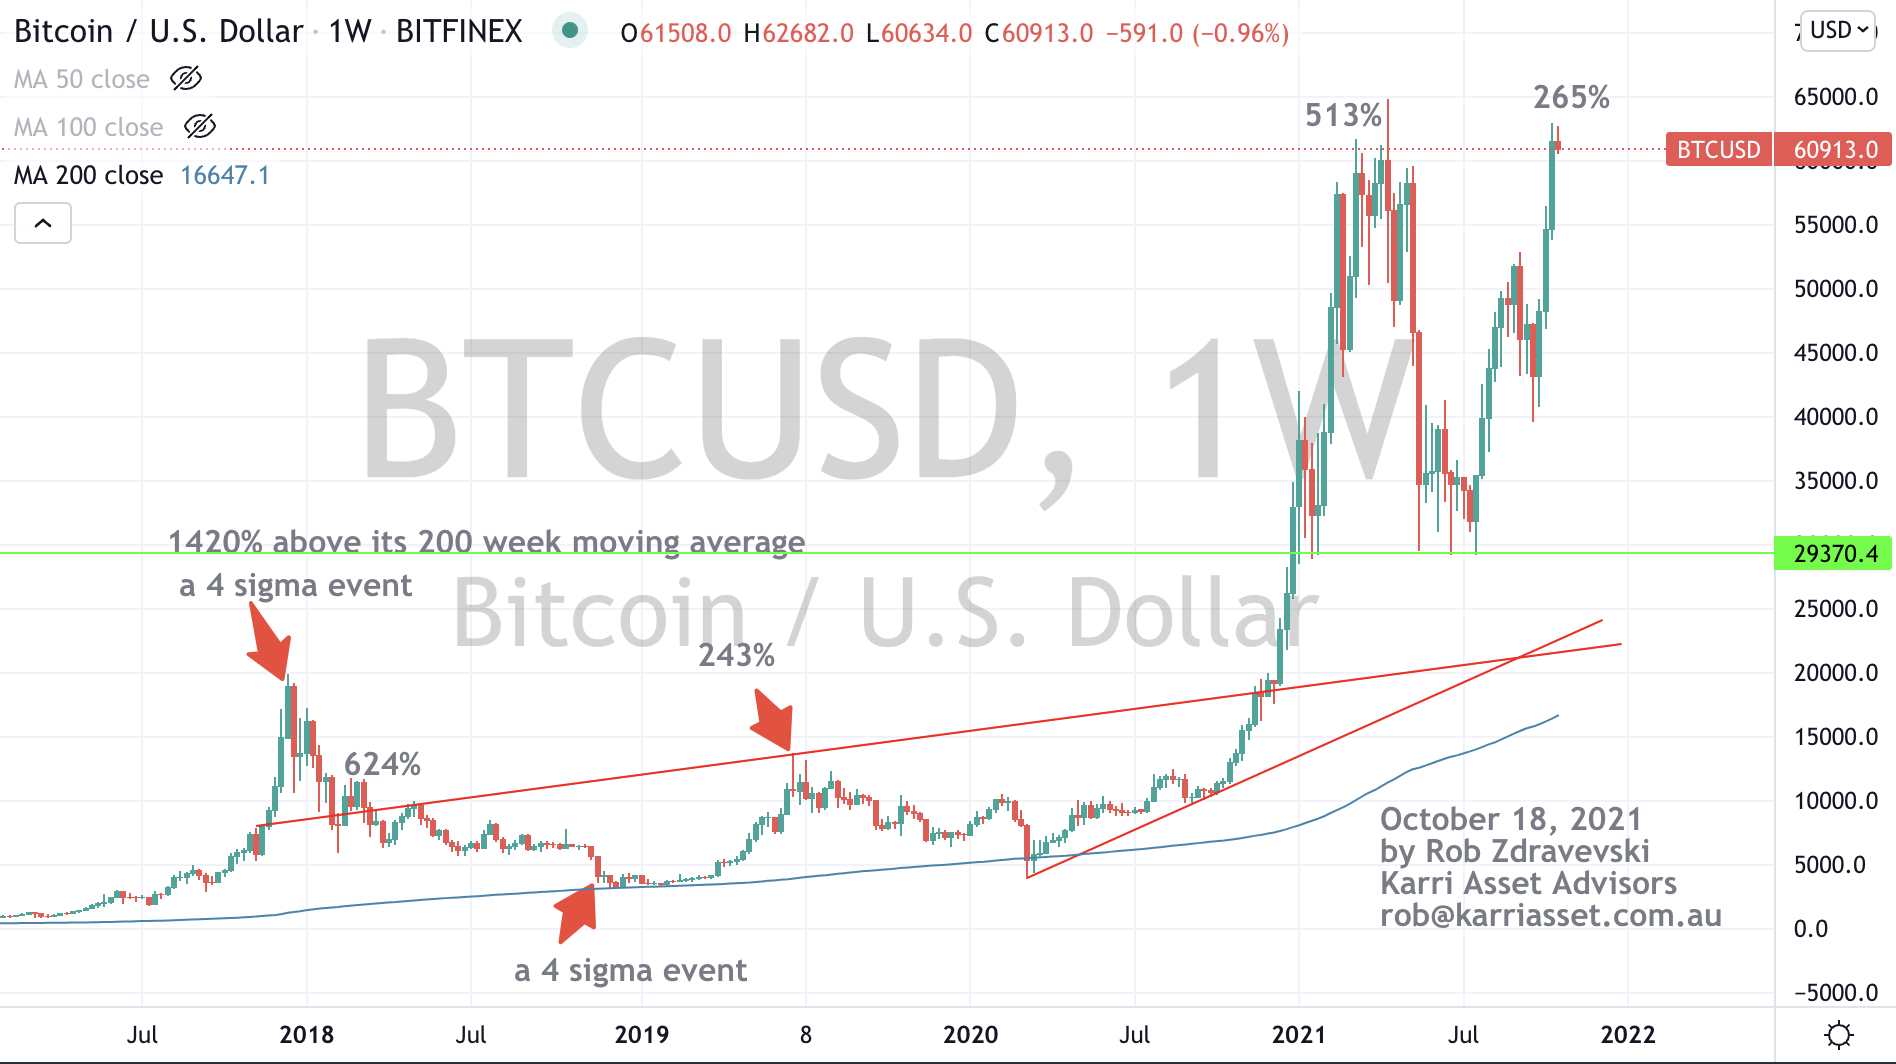
October 18, 2021 Leave a comment
Over the next 15-18 months, where does Bitcoin converge with its 200 week moving average?
How much does Bitcoin decline or how much does the mean ‘roll’ higher?
Probability suggests Bitcoin consolidates and digests itself lower than where it is today.
p.s. those notations serve as as a guide of the percentage Bitcoin was/is trading above its 200 week moving average.
October 18, 2021
by Rob Zdravevski
rob@karriasset.com.au