Today, #AngloAmerican (AAL) has said it received a #takeover offer from #BHP.
#AAL is now 48% higher since that December 13, 2023 note.
M&A activity is increasing and in this case, it is easier to buy existing copper and nickel mines, rather than developing them. BHP would also get 85% ownership of De Beers Group (diamonds) too.
If this deal closes, they won’t exactly become ‘private’ but certainly eases the quarterly investor and analyst palaver for AAL management.
Although, it is early at this dance, it’s always possible that a privately held suitor emerges with buying interest that doesn’t require any de-merger of Anglo American’s divisions or business lines.
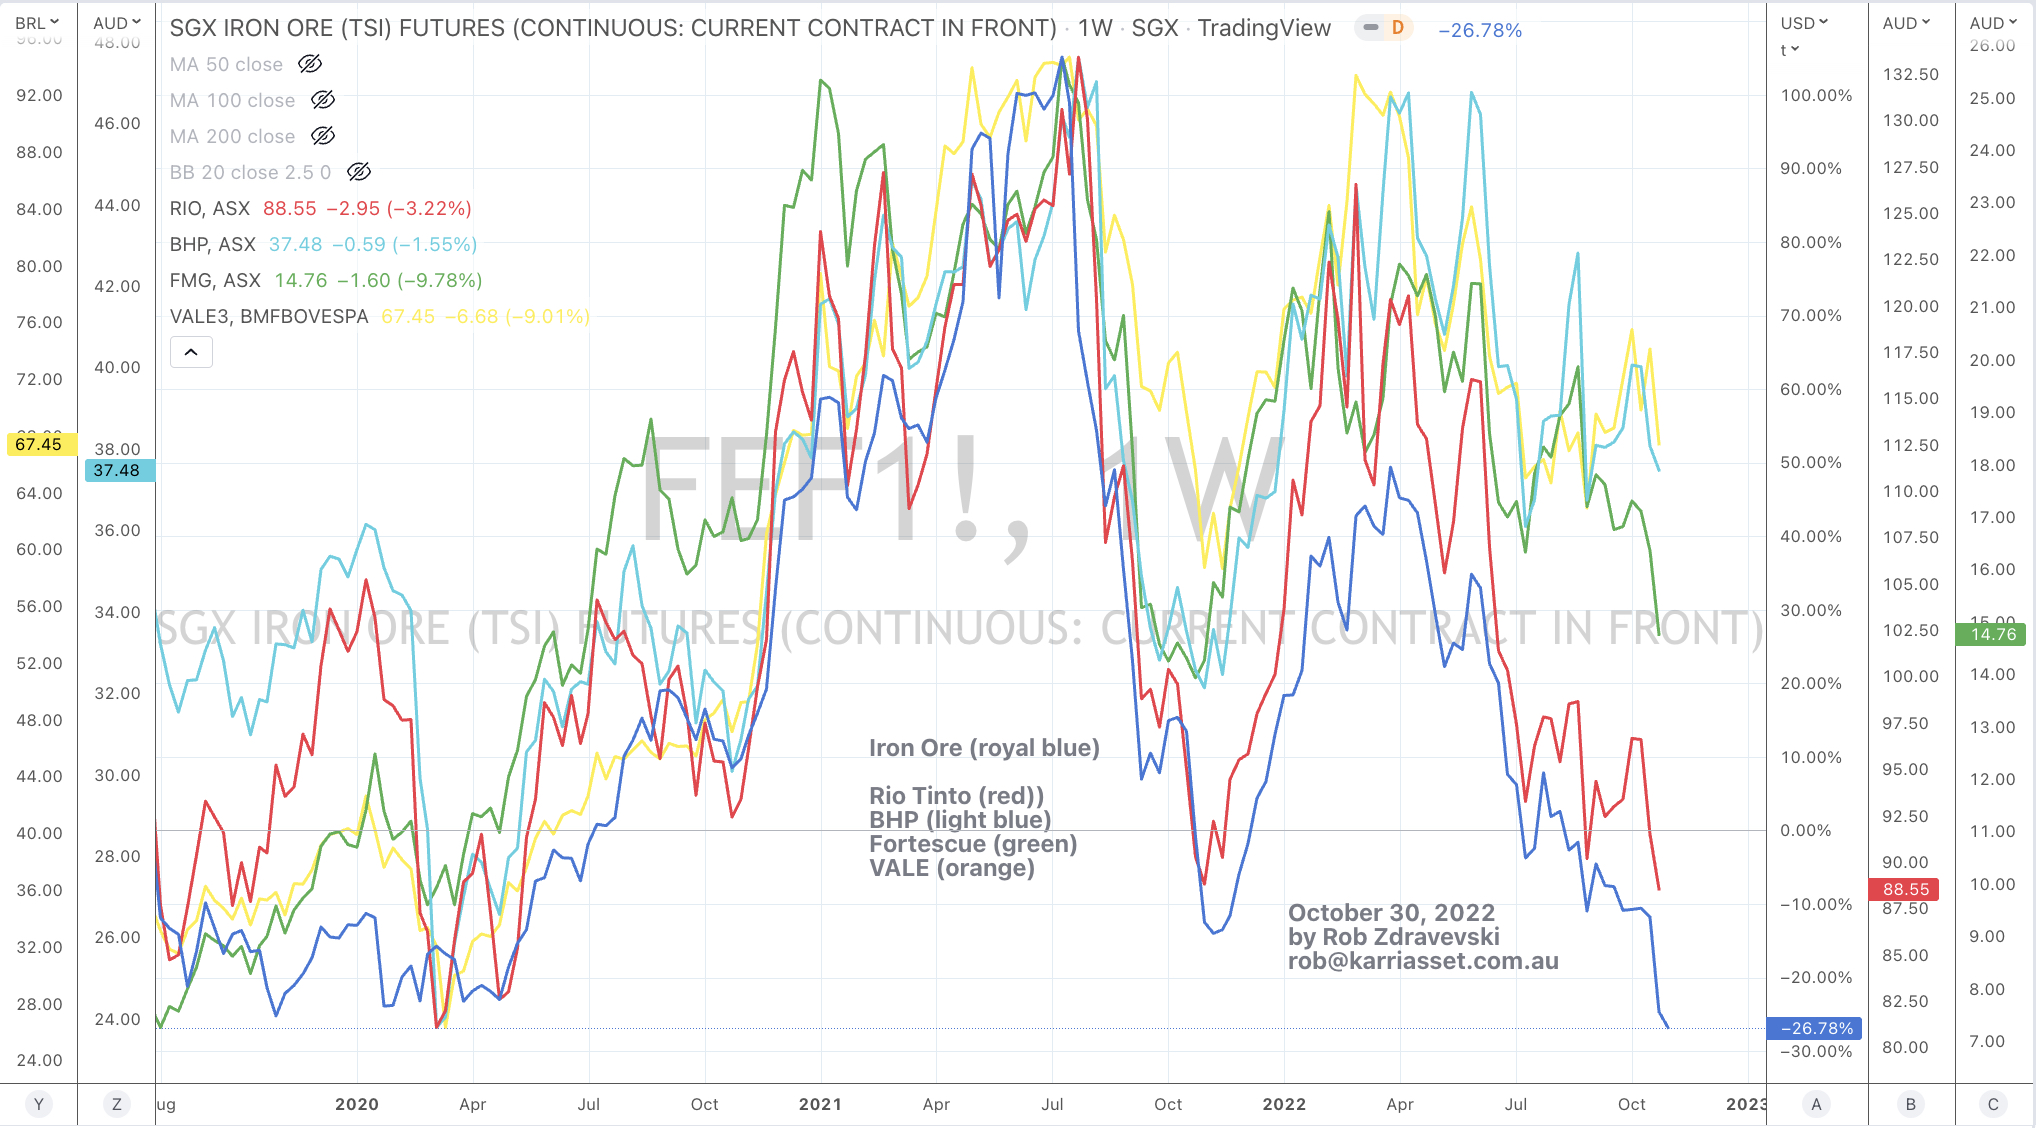
Here is a chart comparing the stock prices of Iron Ore’s Big 4 to the 62% grade Iron Ore price.
Rio Tinto is cuddling more sympathetically to iron ore’s recent decline.
Fortescue is next.
BHP less so.
VALE being the least.
The percentages that these stock prices are tracking Iron Ore’s price may be a representation of each company’s mine localities, corporate domicile, national allegiance or perhaps ‘politics’.
It may be a the market’s interpretation of who China may see as their preferred supplier?
The Thomson Reuters (core commodity) CRB Index hits its highest level since November 2014.
Weightings are particularly heavy towards energy and agricultural contracts.
The CRB is a whisker away from the target mentioned in this story written a few days ago, while the AUDUSD has hit my target of 0.7135.
This is part of my call of a peak for broader commodity prices.
Just take a look around the prices of Oil, Gasoline, Heating Oil, Corn, Wheat, Coffee, Cattle, Oats etc etc.
Also, the price action in Crude Oil is suggesting the recent run is waning.
#meanreversion
In turn, I am not owning any related equities across Oil & Gas, Bulk producers of grains and even miners of raw industrial/base metals.
It’s as good as it’s going to get for in this current wave.
So, what else to do…..
Well, I’ll wait…..
then I’ll watch the stock prices of companies who buy these raw commodities such as Kellogg, Starbucks, Kraft Heinz, Nestle, Nucor or Nippon Steel, as their input costs will fall, thus improving their margins.
…….also, the unloved precious metals are worthy of some attention, while the AUD/USD isn’t acting very constructively.
To many, it might seem perverse to Buy USD (and sell your AUD 0.7130) but that is what the market is telling me.
I’m also seeing divergences in currency correlations.
Take a look at the chart below showing the AUDUSD laid over the CRB Index and then the other is the price of BHP over the same currency cross.
I believe currency before I believe the equity.
For extra kicks, I’ve thrown a chart showing the price of Woodside Energy mimicking the CRB Index.
Here are some quips about mean reversion, knowing when not to chase something and insisting on a bargain, or perhaps ‘buying straw hats in winter’.
There is significance in BHP’s recent pullback, in the chart below, see the notable reversion to its 200 week moving average, note we are taking a long term view here, this chart is a weekly chart covering 25 years, invariably BHP mean reverts, parabolic moves see mean reversion quicker and savagely, and often a subsequent resumption of the previous trend, I don’t see a structural breakdown of the commodity supply complex and demand.
To coincide with a visit to the 200 week moving average, using Fibonacci calculations (it’s something I use to help pick an entry price), subjectively, BHP has retraced 62% of the advance from its March 2000 low, which is another way of weeding out those who bought late into the rally.
And over a slightly longer period, the chart below tells us that if BHP falls to $34.30, it represents a 50% retracement of a 6 year advance, which started at $14.13 in early 2016, $34.30 would represent an attractive risk/reward opportunity.
Rio Tinto has a similar analog and story. I’ll only post a simple weekly chart below, with its 200 week moving average.
Using my mean reversion principles, the chart below is a simple example of Wesfarmers, and when not to chase a stock, and help identify whether you are being the marginal buyer, WES has deviated to more than 50% above its 200 week moving average, never has it seen such an extreme, add high valuations and one would be a fool to have been a buyer above $50, in fact $50 is where probability suggested selling, citing the notion that the ‘fat part of the trade’ had been had.
From the book of ‘insisting on a bargain’ and depending on economic landscape and valuations, I wouldn’t interested buying this stock unless it saw $36-$42, wait for the mean reversion, otherwise it may make for a pedestrian investment.
In another example, I’ll show you what the craze in lithium related companies looks like, here is a chart of Pilbara Minerals (PLS.AX), it has a market capitalisation of A$6 billion, it’s trading at stratospheric levels above its 200 week moving average (WMA), at a current price of $2.05, it is trading at nearly 200% above its 200 WMA the recent rally resembles a parabola, don’t be surprised if new investors today end up halving their money in the next several months.
While the next price chart is of a quality gold producing company, called Evolution Mining (EVN.AX), it has a market capitalisation of A$6 billion, it’s trading at 15% below its 200 WMA, nobody likes Gold or gold stocks today, seems like buying a straw hat in winter?
Also appearing in the unloved category is Chinese equities, the Hang Seng China Enterprises Index (HSCEI) tracks the performance of major H-shares, H-shares are Renminbi-denominated shares issued by Chinese companies, they are listed on the Stock Exchange of Hong Kong, which are traded in Hong Kong dollars.
The HSCEI is trading on a current Price/Earnings (P/E) Ratio of 9, and its currently 20% below its 200 week moving average.
A ton of Iron Ore is now 25% cheaper than a ton of Jarrah firewood.
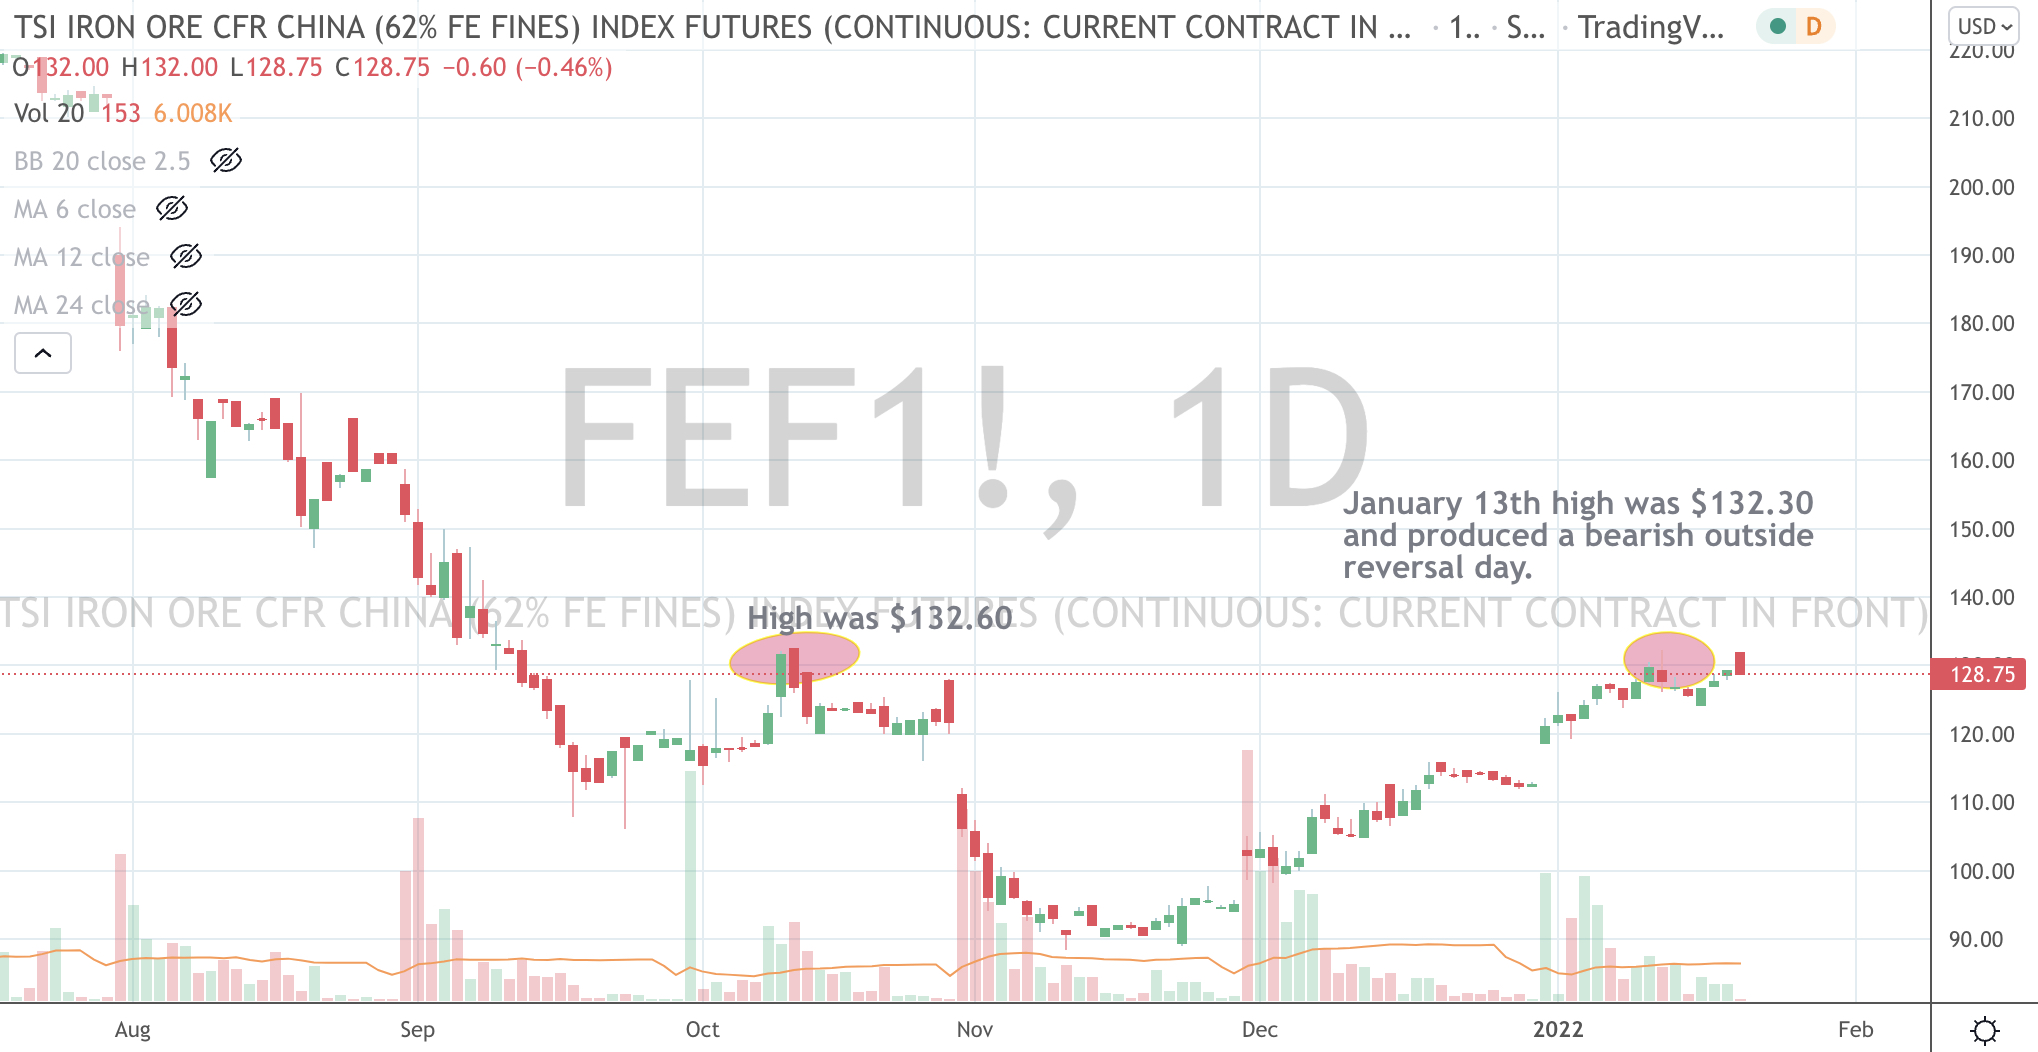
With all my writing about extremes and mean reversion, Iron Ore is reaching an interim point which increases probability of a ‘buying’ moment.
Currently, it is trading at US$145 per ton.
The chart below circles an area between US$124 and $132 which I think (in conjunction with my other indicators) present an opportunity for a ‘trading buy’.
Incidentally, that upward sloping line is Iron Ore’s 100 week moving average.
So, I’m looking for a 14% drop in the coming 15 days to satisfy a buying criteria and this will have an effect of your listed iron ore sensitive equities.
Once upon a time mining companies were making a lot of money by extracting ore from Australia’s crust.
Soon after, the government needed some money to pay for the debts they incurred as a result of the spending promises they made to the Australian public, in their attempt to remain elected to power.
They thought that they could invent a tax which charged mining companies for how much resources that they dig up and sell.
The tax was created. Some were happy and others weren’t. They was lobbying, protests, crying and demanding. The tax had a short life. The new government had mates in the mining sector. The tax was no longer alive.
It was OK ’cause the government still earned some sort of money from whatever businesses the large mining companies conducted, providing that they didn’t cleverly use their offshore subsidiaries to move around and book profits into.
The price of coal had already fallen, but nobody likes them anyway ’cause their industry is a visibly polluting one.
But oh oh – recently the price of Iron Ore has fallen.
This is how I see it,
Government let off the iron ore miners off the hook with the mining tax, less money for the government, then global demand slowed, the giants continued to increase supply, the price of iron ore fell, the companies made less profit but them increasing supply (coupled with falling commodity prices) also pressured the smaller miners, thus the giants are growing their market share, but government still needs more cash, there is no capital gains tax being paid of share profits because the stock prices of the major iron ore companies are the same as 5 years ago, thus shareholder return is poor, but hundreds of employees are making more than $400,000 per year.
It’s important to keep the gravy train going by any means you can, whether you manage to dupe government, the economy or shareholders.
Yet they still are on the look out for federal government help to assist them with their plight of iron ore prices being below their cost of production.