’til the cows come home
June 24, 2026 Leave a comment
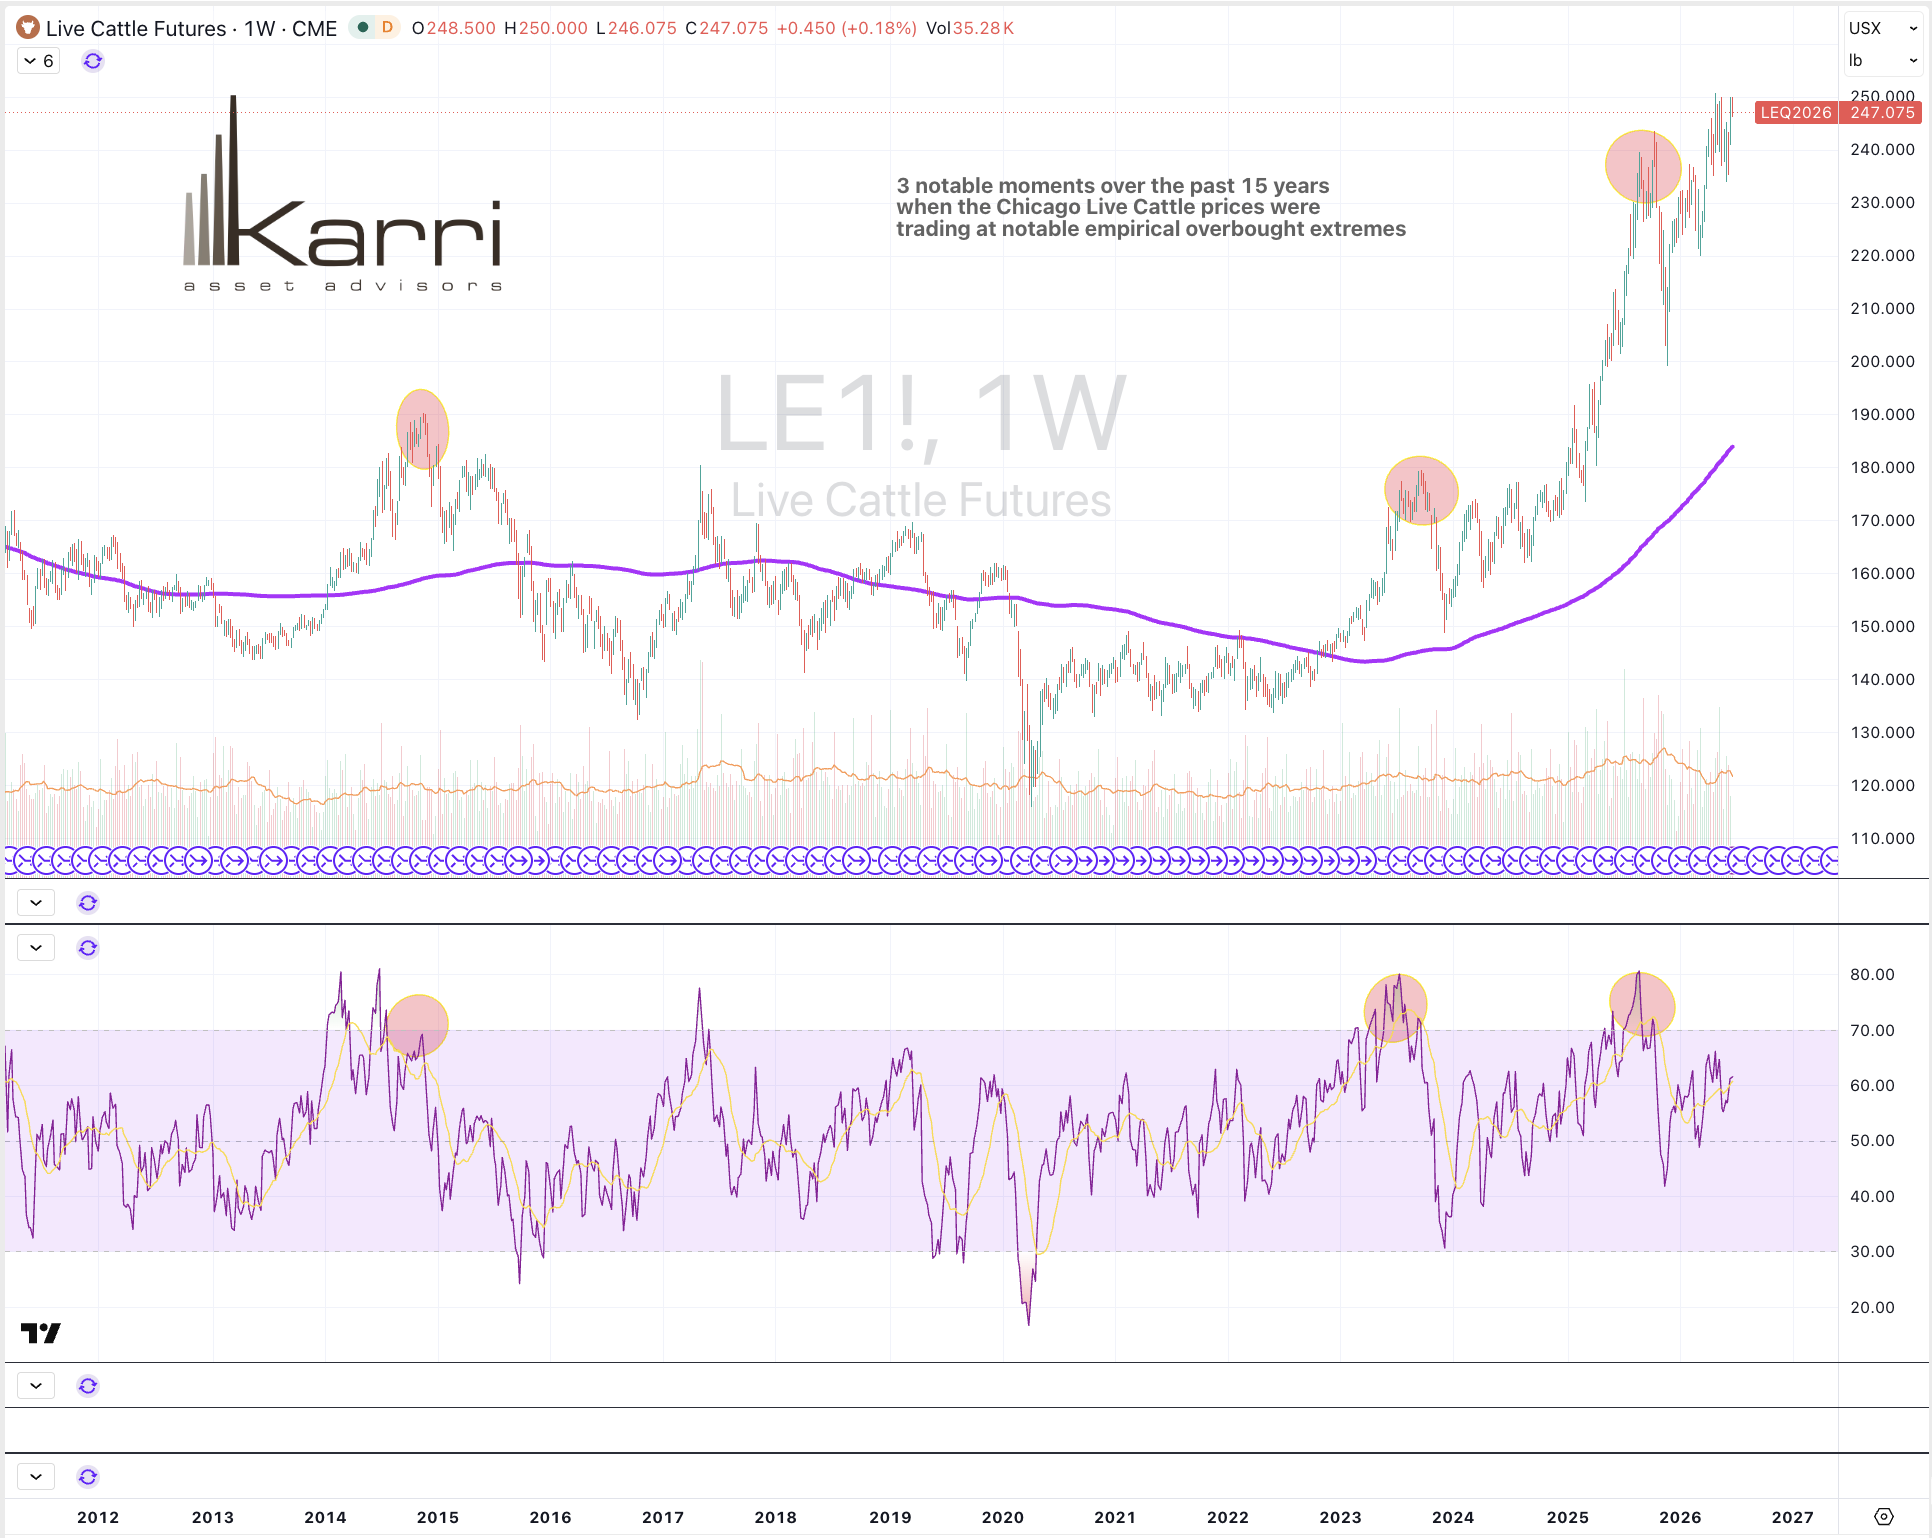
Times when you should sell a little more of your cattle herd than usual
June 23, 2026
Trying to hear what's not being said
June 24, 2026 Leave a comment
Times when you should sell a little more of your cattle herd than usual
June 23, 2026
June 21, 2026 Leave a comment
A weekly Macro, Cross Asset review of prices trading at extremes which may generate future investment ideas and opportunities.
The following assets (on a weekly timeframe) either registered an Overbought or Oversold reading and/or have traded more than 2.5 standard deviations above or below its rolling mean.
n.b. pricing of (commodity) futures contracts is only considering the immediate front month.
* denotes multiple week inclusion
Extremes above the Mean (at least 2.5 standard deviations)
U.S 3-month bill yield
COP/USD
XBI biotech ETF
Overbought (RSI > 70)
Copper/Gold Ratio
Russian 10-year government bond yields *
Rubber *
AUD/CHF
USD/IDR
Austria’s ATX Index *
Italy’s MIB *
Spain’s IBEX
Taiwan’s TAIEX *
South Korea’s KOSPI *
Nasdaq 100
Nikkei 225 *
SOX *
And Poland’s WIG Index *
The Overbought Quinella (Both Overbought and Traded at > 2.5 standard deviations above the weekly mean)
U.S. 5-year bond yield minus U.S. 5-year breakeven inflation rate
Singapore’s Strait Times
Extremes below the Mean (at least 2.5 standard deviations)
U.S. 5-year breakeven inflation rate
Nickel
Corn *
CAD/USD
MYR/USD *
HSCEI Index
Hang Seng Index *
Oversold (RSI < 30)
U.S. 10-year bond yield minus U.S. inflation rate *
North European Hot Rolled Coil Steel *
Lean Hogs *
CHF/AUD
Russia MOEX Index
The Oversold Quinella (Both Oversold and Traded at < 2.5 standard deviations below the weekly mean)
U.S. 10-year minus U.S. 2-year bond yield spread
U.S. 10-year minus U.S. 5-year bond yield spread
Notes & Ideas:
Government bond yields were mixed and quiet.
India’s & Türkiye’s 10-year bond yield along with the U.S. 10-year inflation breakeven rate have declined for 4 weeks.
Chile’s 2-year bond yield has sunken for 6 weeks.
The U.S. 5-year inflation breakeven rates have fallen for 5 weeks.
Various inflation breakeven spreads appear in this week’s list.
Russia’s 10-year bond yield has climbed for 8 weeks.
And Japan’s 30-year yields rose to break 4 weeks of decline.
Equities were mostly higher.
A few indices swapped spots with those that departed.
Dubai’s DFM Index is in a 4-week winning streak.
CAC has risen for 5 weeks.
Indonesia’s IDX has risen 10% in 2 weeks.
Vietnan’s VN Index rose and broke its 4-week losing streak.
The Hang Seng has fallen for 6 weeks.
The Dow Jones Transports rose and snapped a 4-week winning streak.
And Thailand’s SET fell and broke its 7-week winning streak.
Commodities had a bias for weakness, again.
Cocoa, Coffee, Cocoa and Wheat were the notable gainers.
Coal, Oil, Gases, Distillates, Silver, Platinum and Urea were amongst the decliners.
Brent Crude has sunk 14% in the past fortnight.
Lumber has risen for 4 weeks.
Bloomberg Commodity Index, S&P GSCI, CRB Index and Lean Hogs have fallen for 5 weeks.
Cotton rose and snapped a 5-week losing streak.
Iron Ore rose and broke 6 weeks of consecutive decline.
Gold priced in AUD and ZAR have declined for 6 weeks.
Platinum and Middel Eastern Urea prices have declined for 7 weeks.
And U.S. Gulf Urea prices are in a 9-week losing streak.
Currencies were quiet, again.
The Aussie rose except against the IDR and INR.
Those latter pairs have eased from their recent overbought status.
The Loonie and Swissie were weaker, again.
COP/USD has risen for 5 weeks.
A few more currency pairs left the extreme list
Yen was mixed.
And the USD was firmer, again.
The larger advancers over the past week comprised of;
Aluminium 2.8%, Cocoa 9.5%, Cotton 4.3%, Palm Oil 3%, Arabica Coffee 5.7%, Lumber 1.5%, Cattle 2.3%, Dutch TTF Gas 3.8%, Oats 2.4%, Wheat 3.2%, Shanghai Composite 1.5%, CSI 300 3.4%, All World Developed ex USA 1.5%, ATX 4.3%, IDX 2.8%, DFM 3.5%, EGX 3.6%, FCATC 7.2%, MIB 2.6%, IBB 1.8%, IBEX 3.1%, Dublin 2.2%, TAIEX 5.2%, Nasdaq Composite 2.4%, KLSE 1.7%, KSE 3.8%, KOSPI 11.4%, Nasdaq 100 2.6%, Nikkei 225 7.9%, Nifty 1.7%, Stockholm 2.1%, PSE 3.8%, Sensex 1.7%, SOX 7.3%, STI 3.3%, SX5E 1.7%, Vietnam 1.8%, XBI 5.2%, ASX Financials 1.7%, ASX Small Caps 2.6% and Türkiye’s BIST rose 5.7%.
The group of largest decliners for the week included;
Richards Bay Coal (3.6%), Rotterdam Coal (3.7%), Bloomberg Commodity Index (1.9%), Brent Crude (7.8%), Baltic Dry Index (3.4%), Lean Hogs (2.6%), JKM LNG (14.8%), JKM in Yen (16.9%), Lithium Carbonate and Hydroxide (1.7%), Newcastle Coal (4.3%), Nickel (2.3%), Orange Juice (2.9%), Palladium (1.9%), Platinum (2.3%), S&P GSCI (3.8%), CRB Index (1.8%), Urea U.S. Gulf (3.7%), Gasoil (6.4%), Urea Middle East (8.8%), Silver (4.7%), Gold in USD (1.5%), DJ Transports (4.2%), HSCEI (4.8%), Hang Seng (3.2%), BOVESPA (1.6%), KRE (2.3%), OBX (2.2%), Helsinki (1.6%), TA35 (4.6%) and the Nasdaq Transports fell 1.7%.
June 21, 2026
By Rob Zdravevski
rob@karriasset.com.au
June 20, 2026 Leave a comment
On this day, 1 year ago, I published a newsletter (link below) which included a bunch of price charts and were implied the direction of assets or securities featured.
https://mailchi.mp/karriasset/taking-the-markets-temperature-june-25
I say ‘implied’ because the more direct suggestions and price entries were
reserved for clients.
The major point that I made was that I didn’t see any structural problems in the equity markets.
I followed on by predicting the air being let out of certain markets, which
occurred in equity indices such as the DAX.
And in the section titled,
“Making money in any type of market conditions”,…….
the Dow Jones Transports, Healthcare ETF, Palladium, Nickel, Thailand’s SET and China’s CSI 300 Index rose somewhere between 30% – 100% in the 12 months since that note was published.
June 20, 2026
Rob Zdravevski
rob@karriasset.com.au
June 20, 2026 Leave a comment
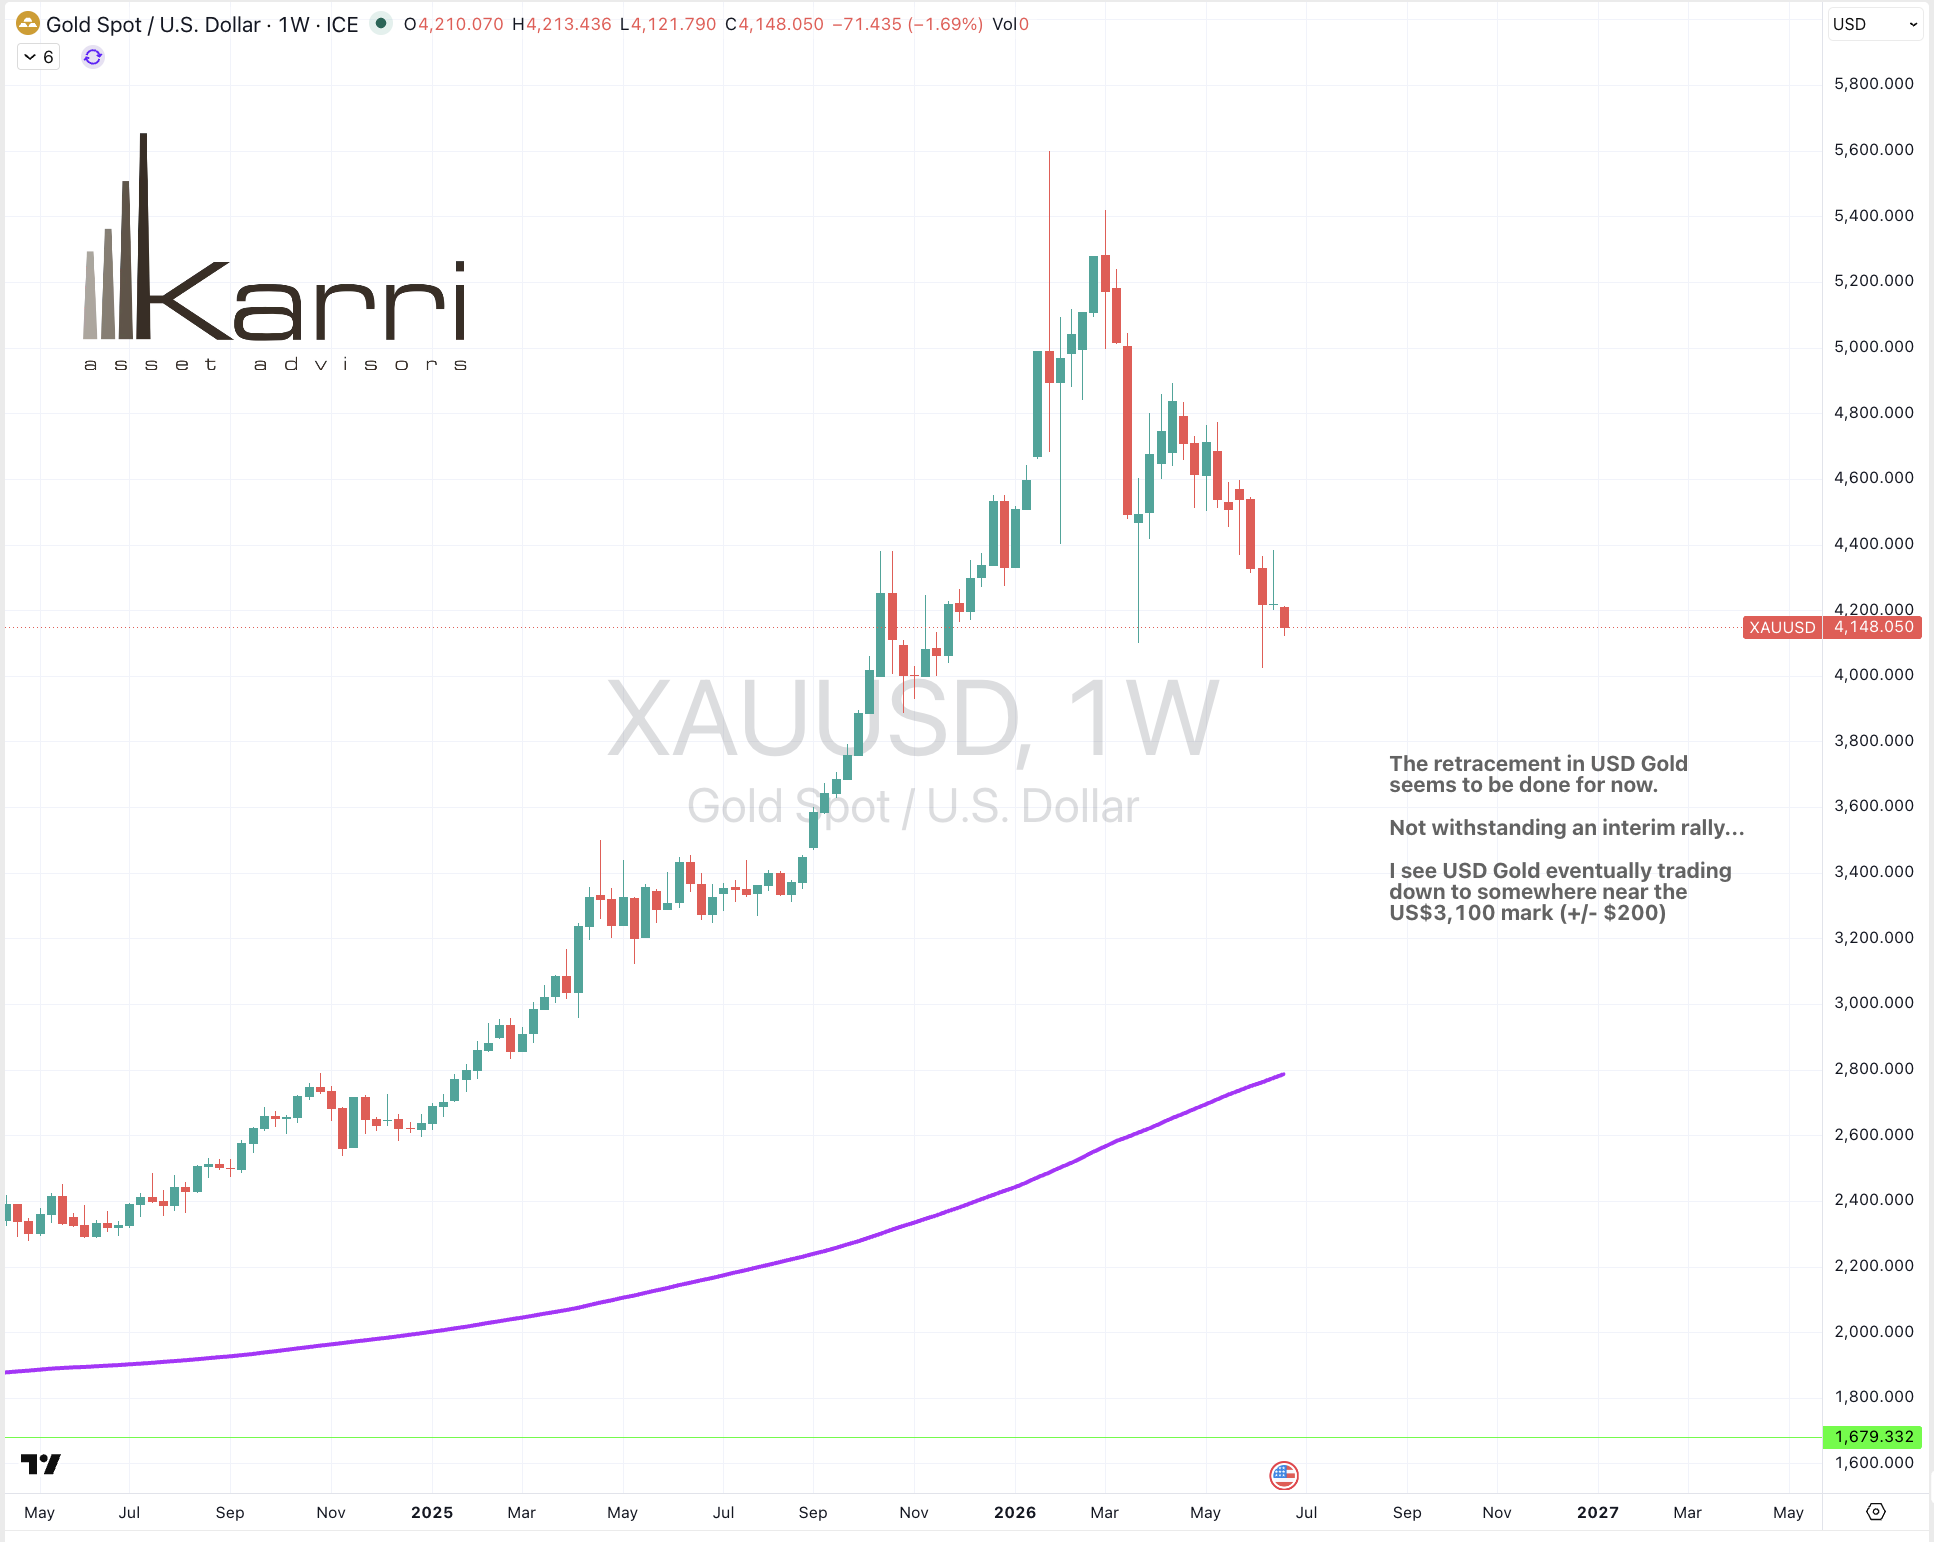
The retracement in USD Gold seems to be done for now.
Not withstanding an interim rally…….
I see USD Gold eventually trading down to somewhere near the US$3,100 mark (+/- $200)
June 19, 2026
June 19, 2026 Leave a comment
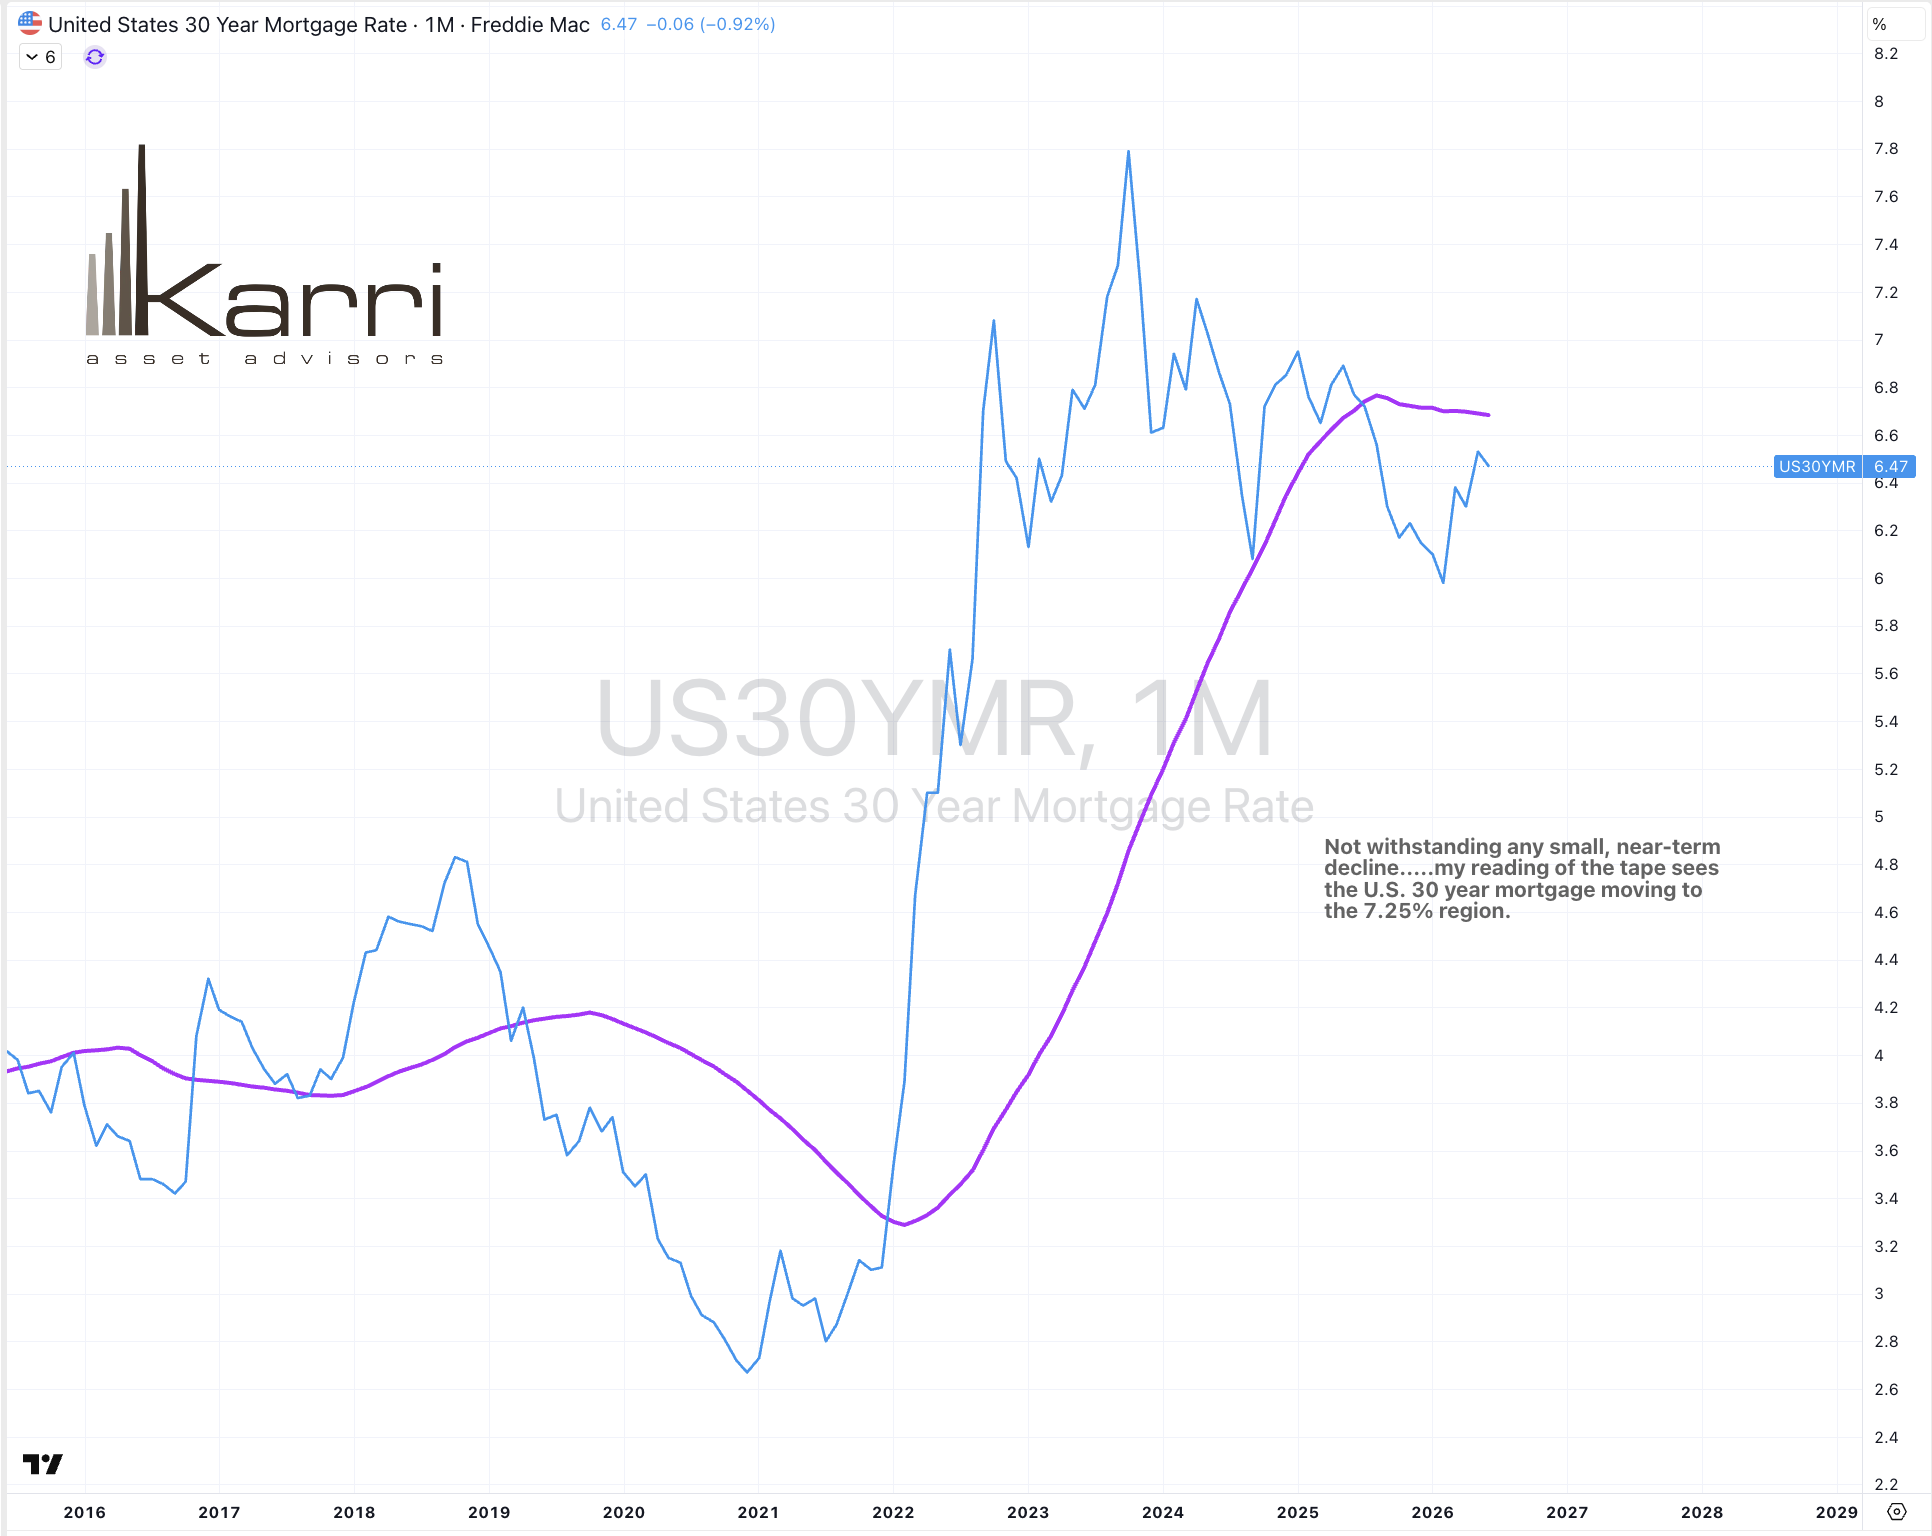
Not withstanding any small, near-term decline…..my reading of the tape sees the U.S. 30 year mortgage moving to the 7.25% region.
June 19, 2026
rob@karriasset.com.au
June 18, 2026 Leave a comment
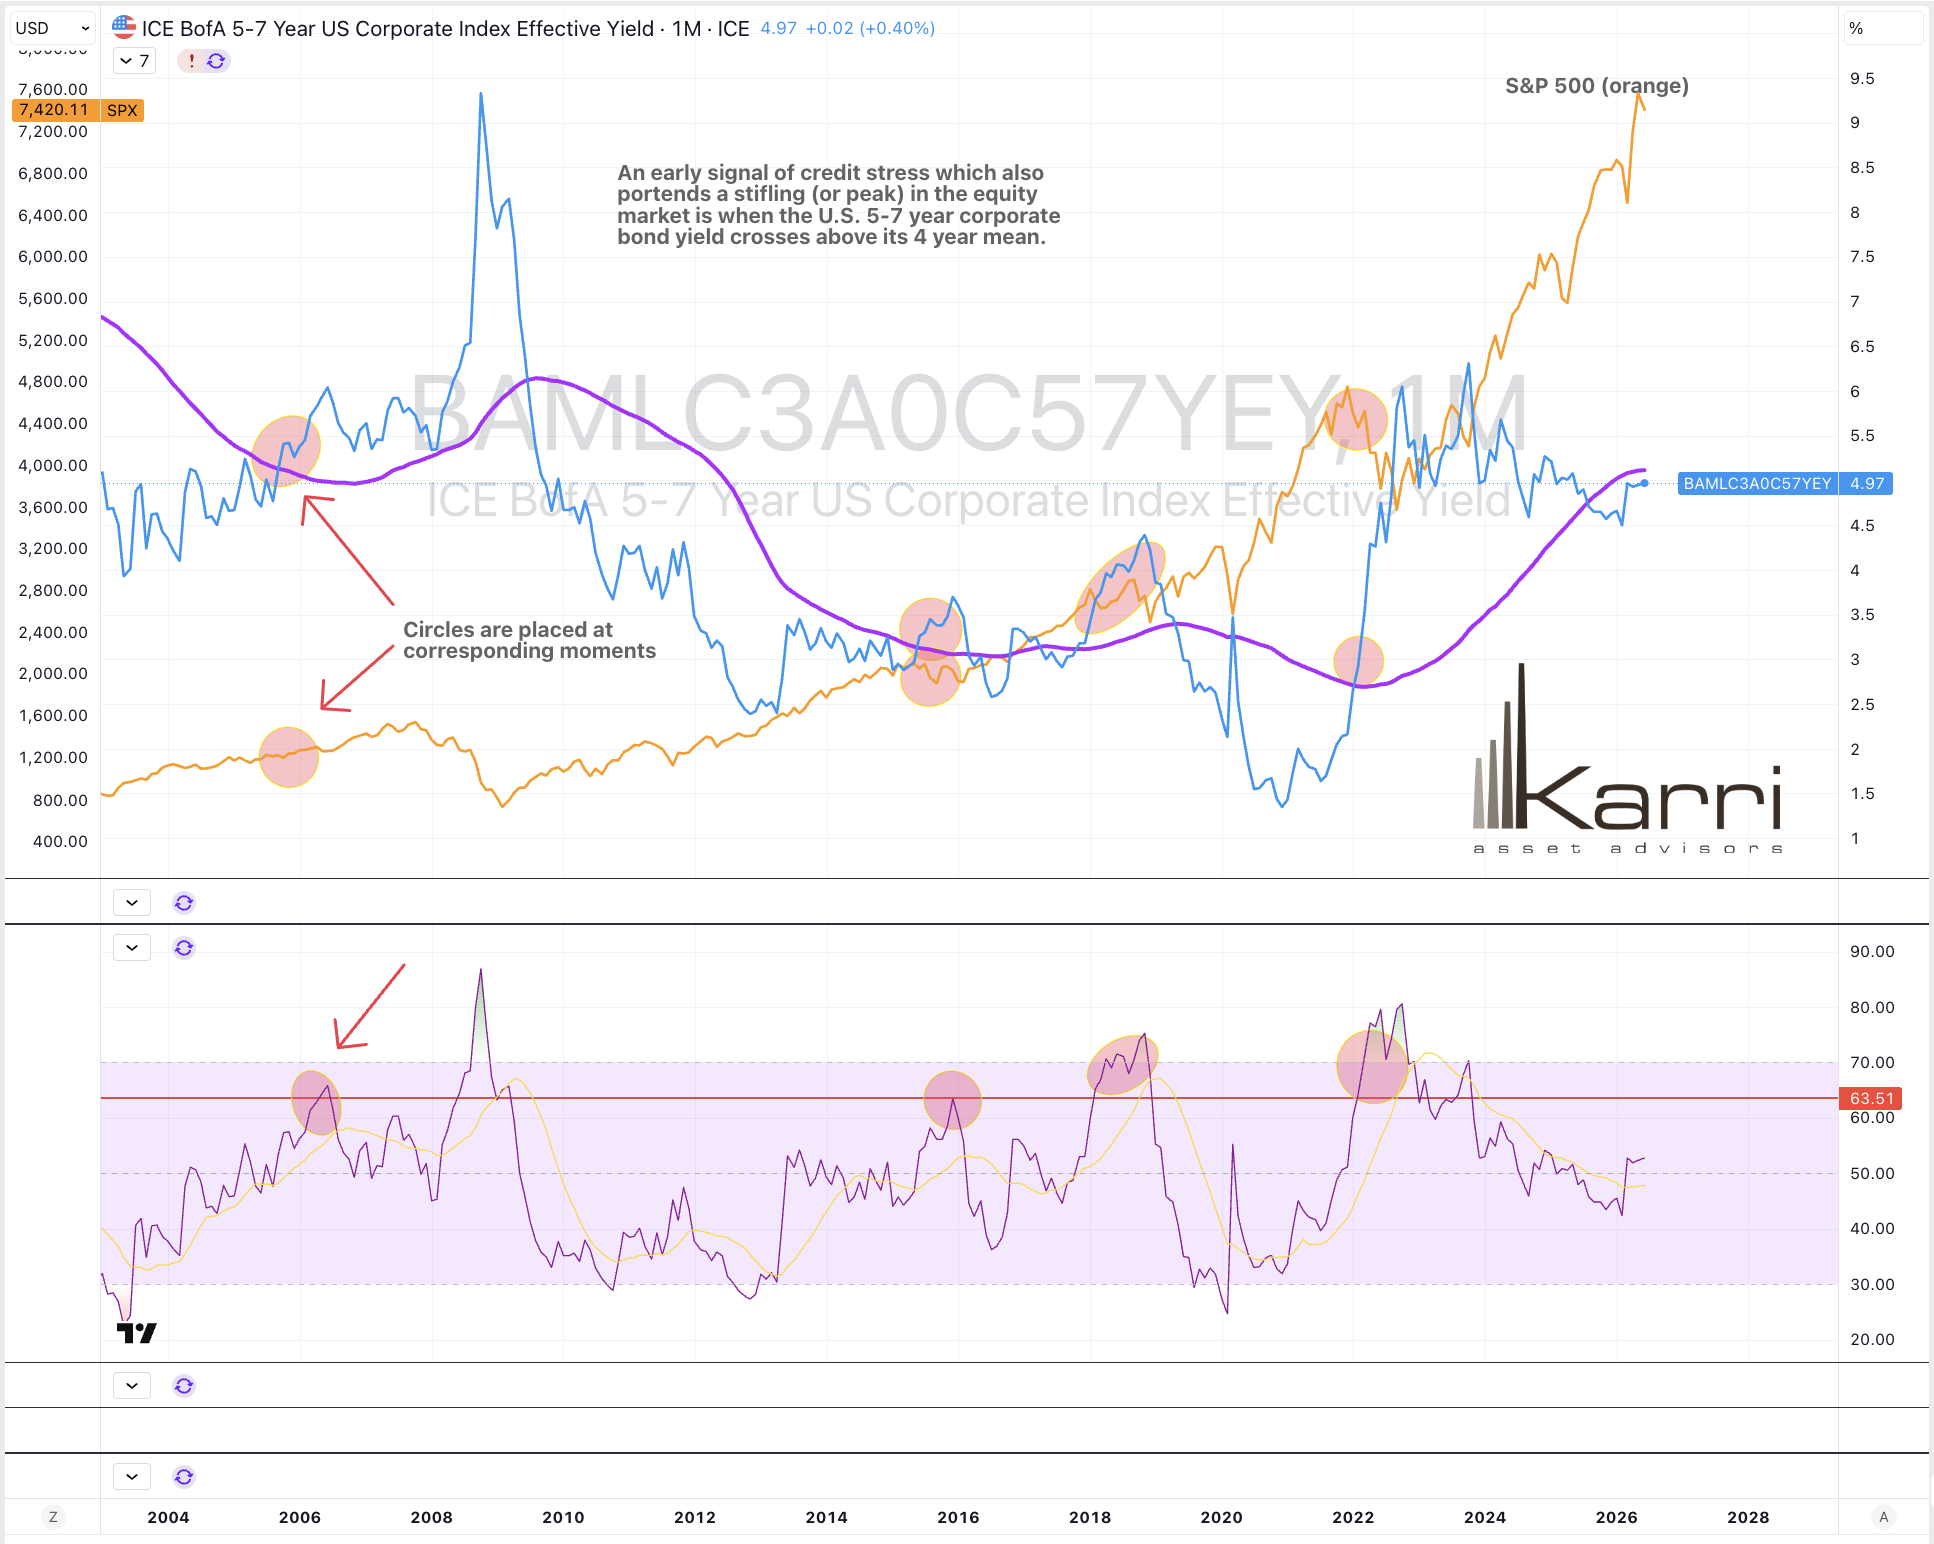
An early signal of credit stress which also portends a stifling (or peak) in the equity market is when the U.S. 5-7 year corporate bond yield crosses above its 4 year mean.
June 18, 2026
rob@karriasset.com.au
June 18, 2026 Leave a comment
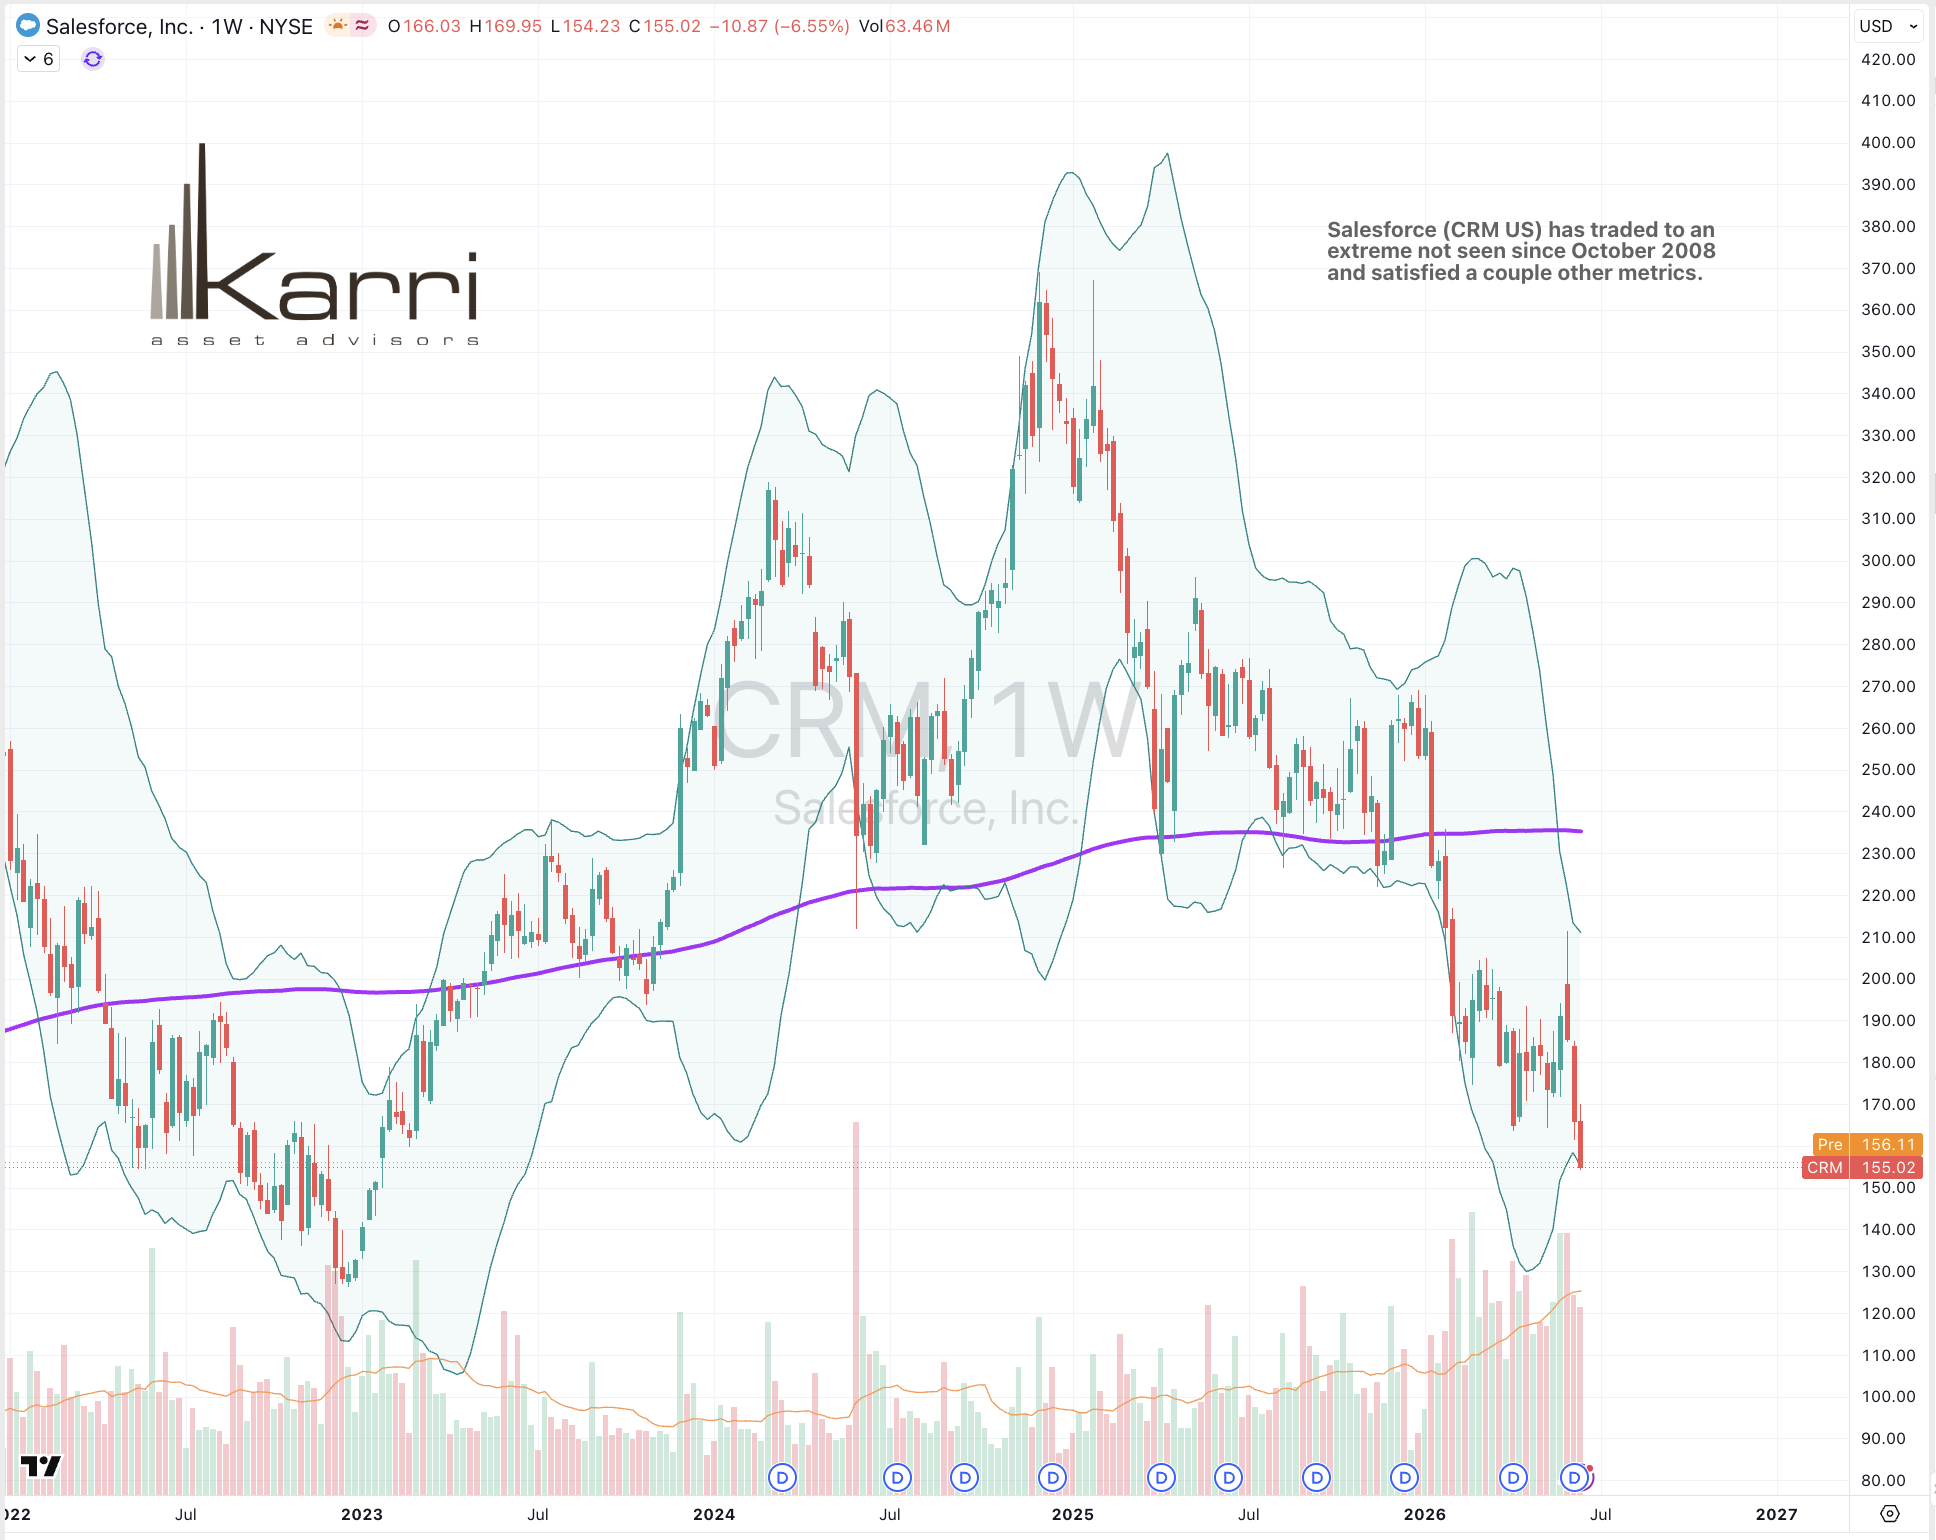
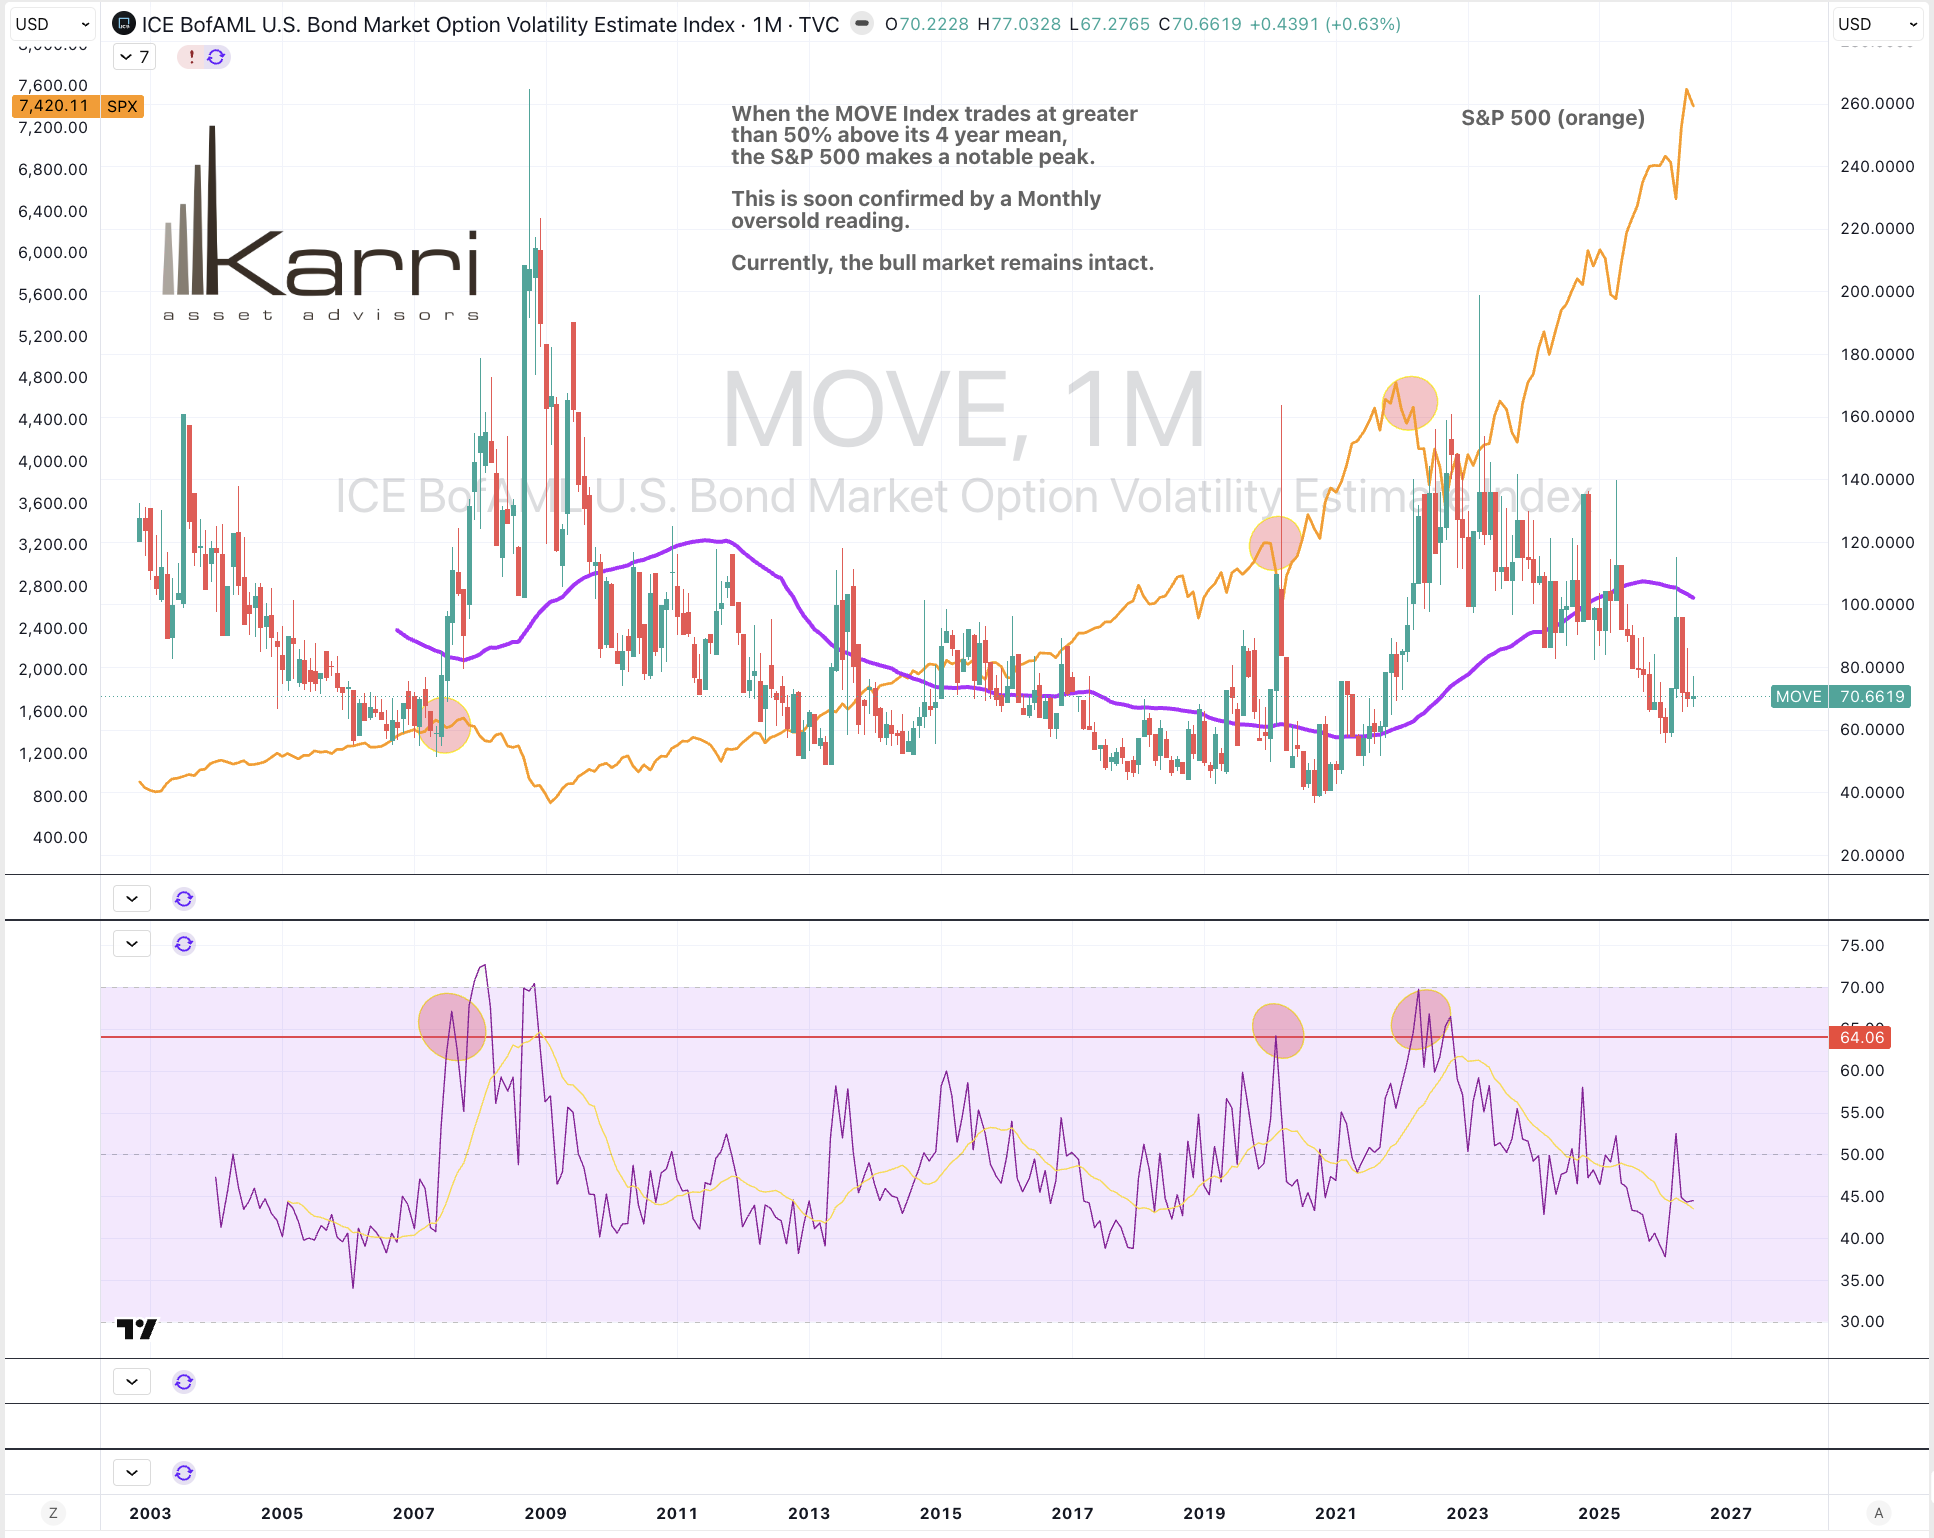
I’m not seeing any stress in the credit markets and so, the equity bull market remains intact.
June 18, 2026
rob@karriasset.com.au
June 18, 2026 Leave a comment
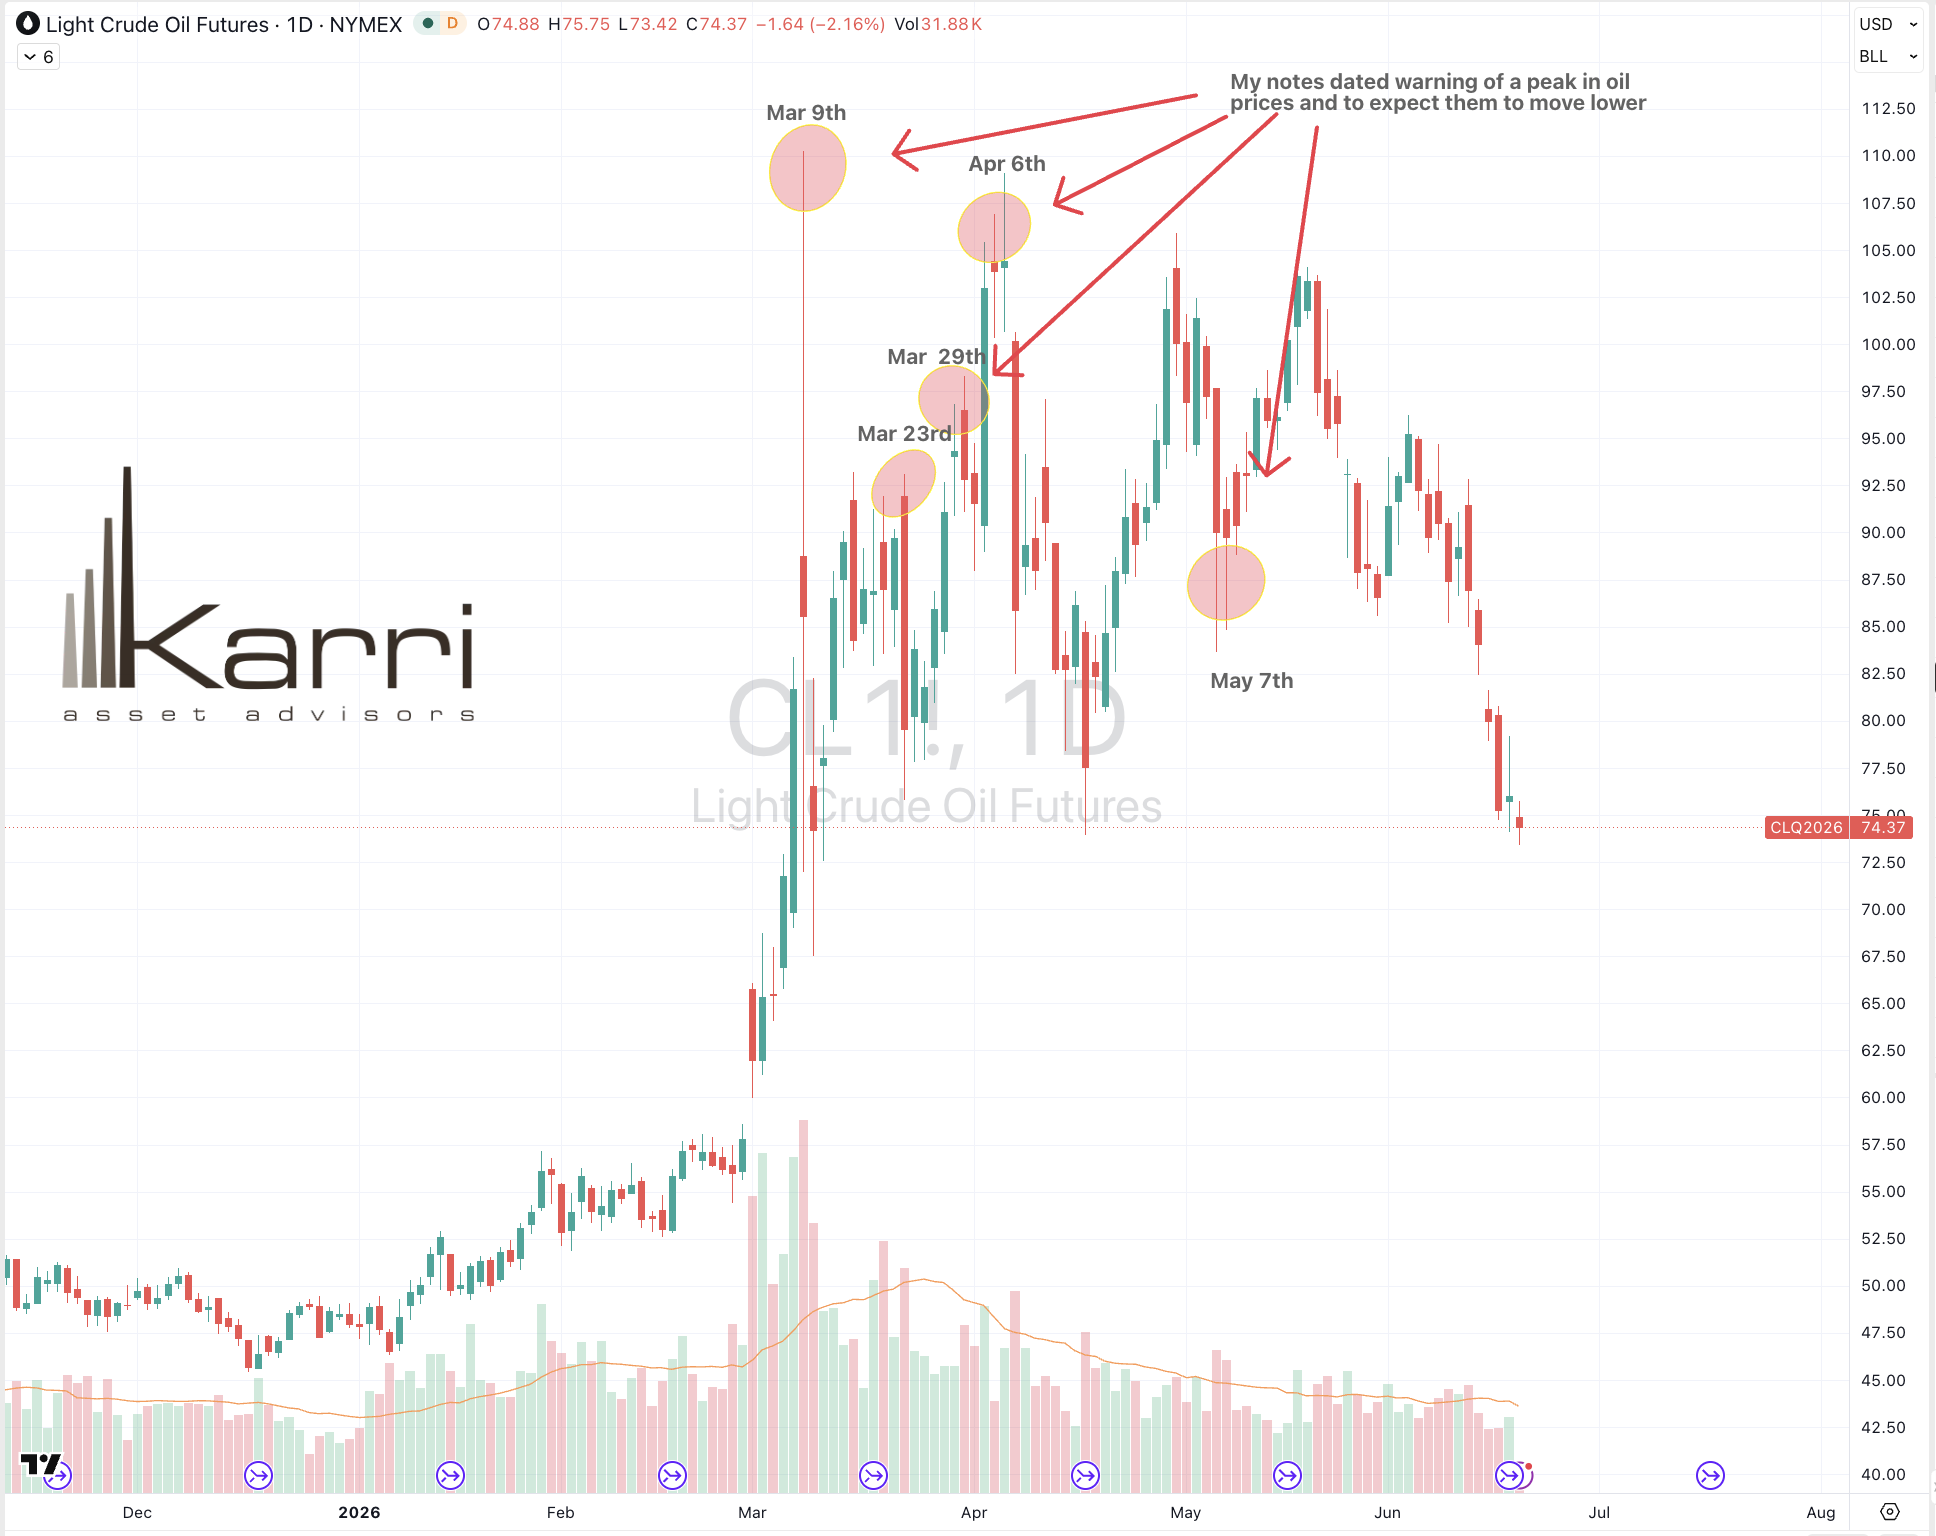
The attached graphic points to the dates when I posted notes warning of a peak in oil prices and to expect them to move lower.
Links to those noted are also included below.
The March 23rd note says that with WTI Crude trading at $99, that I was expecting it to fall $30 rather than rise $30.
Incidentally, the stock prices of many Oil companies peaked between March 23rd – 30th.
Today’s price of $74, isn’t far from completing that $30 decline.
The signals told me not to buy Oil and instead short it, while the noise was telling many others something quite the opposite.
I think seeing $59 remains possible.
June 18, 2026
rob@karriasset.com.au
June 17, 2026 Leave a comment
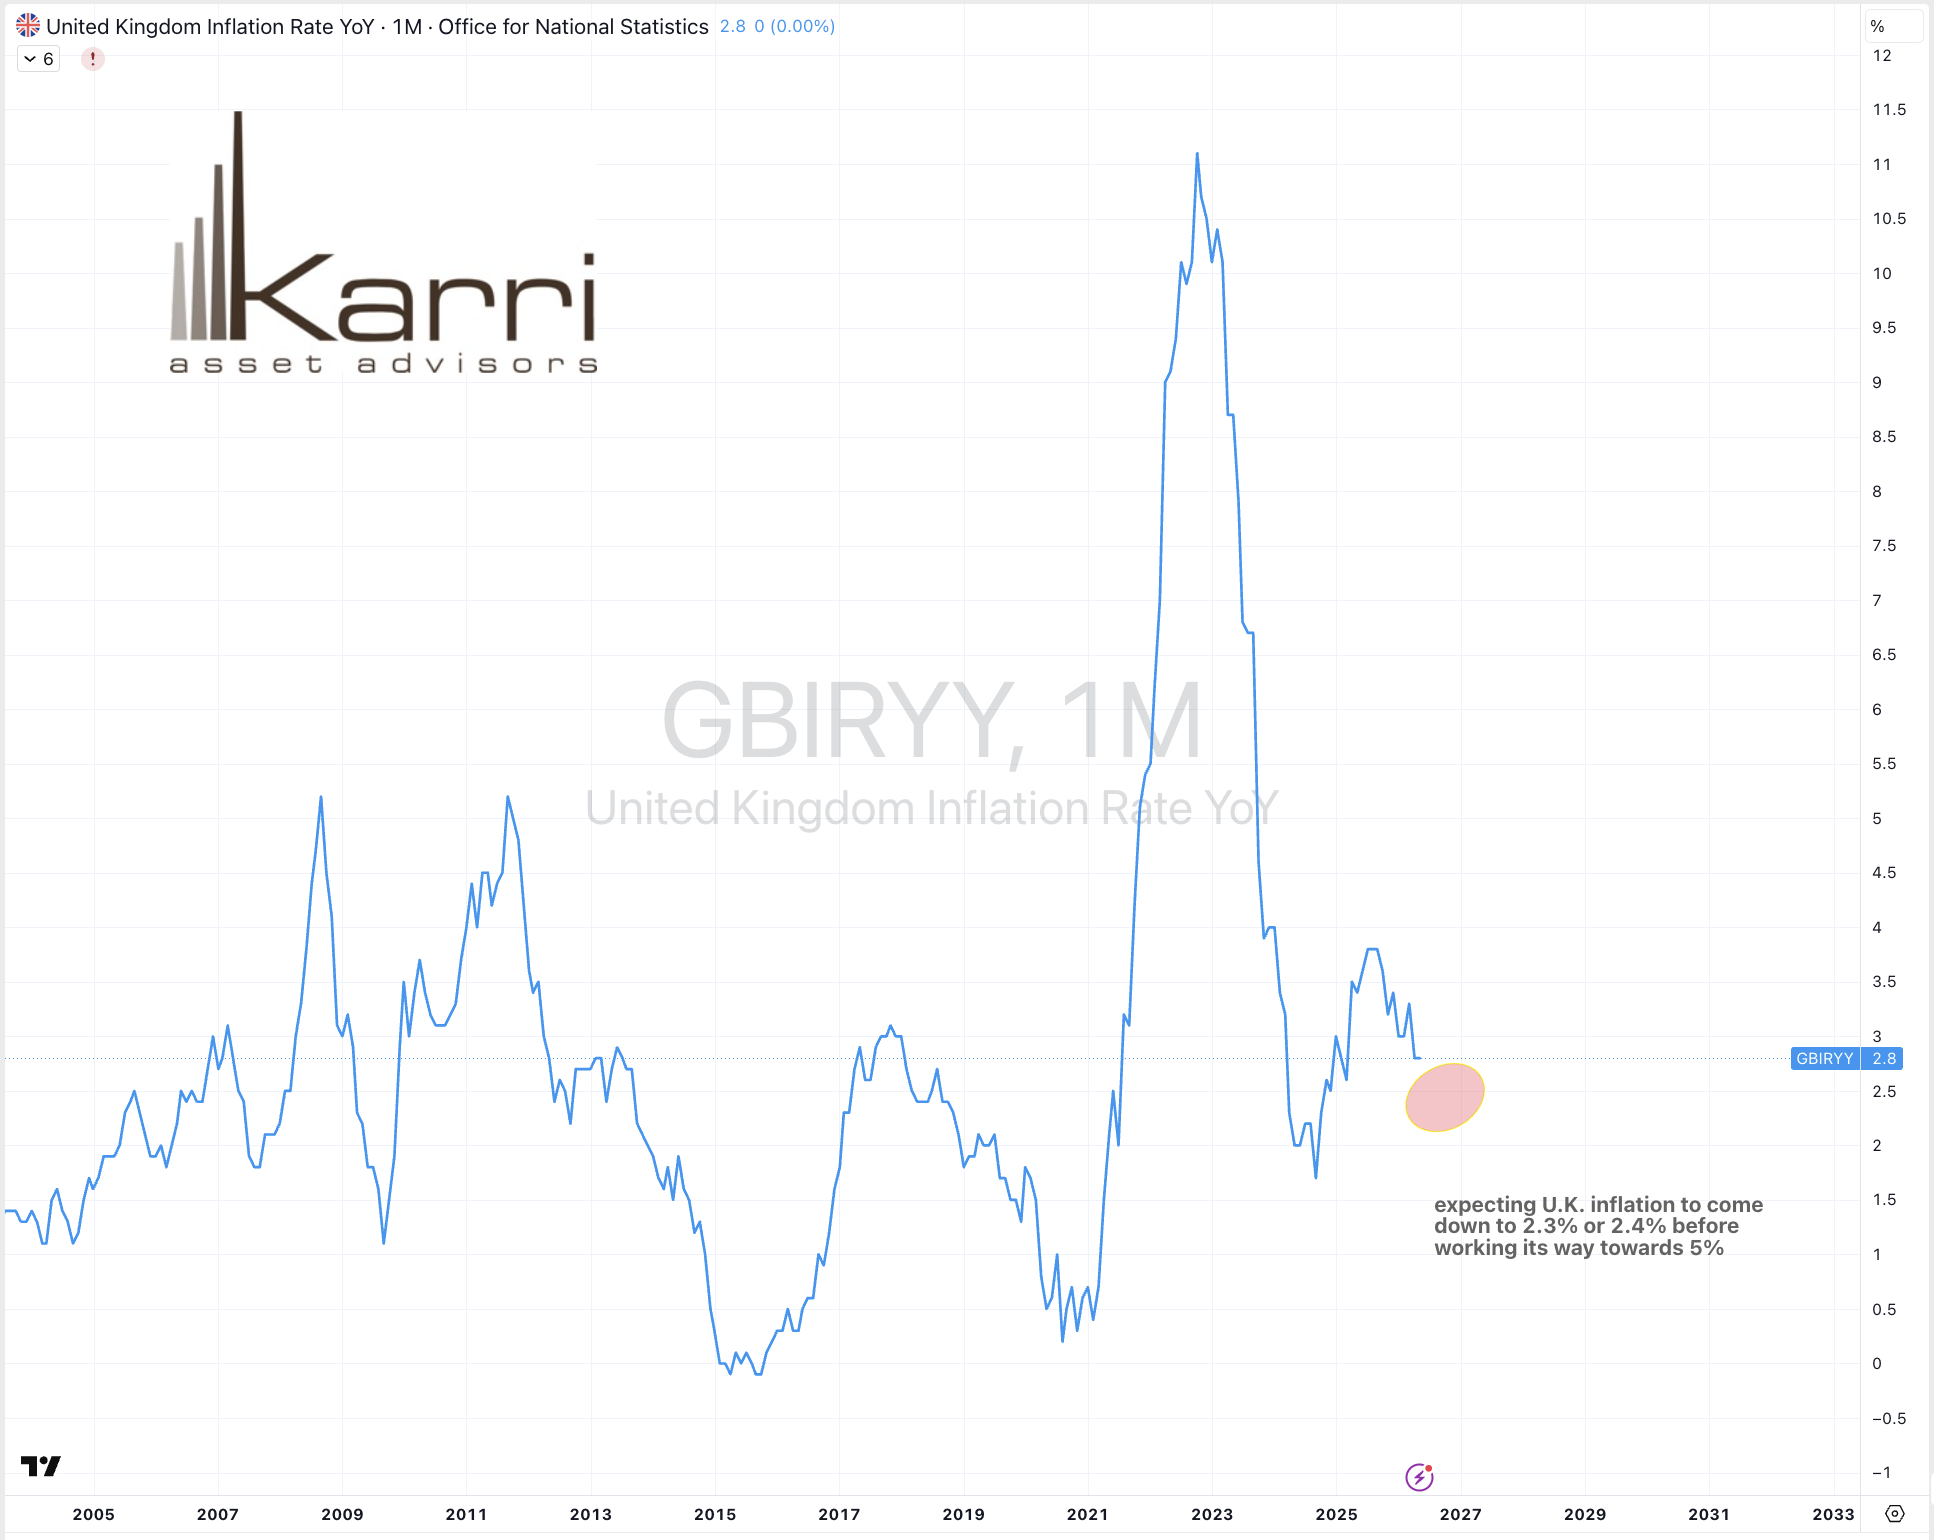
My read of U.K. inflation rate is expecting it to ease from its current 2.8% down to the 2.3% – 2.4% level before making its way towards 5% over the next 18 months.
June 17, 2026