Re-visiting the weakness in Yen

This chart shows the percentage that the USD/JPY is trading above its 200 week moving average.

The extension that we are seeing currently is quite a rare moment.

Many of the previous percentage peaks coincided with the currency cross simultaneously touching 2.5 standard deviations above its rolling weekly mean and it registered a weekly Overbought reading.

October 22, 2022

by Rob Zdravevski

Karri Asset Advisors

rob@karriasset.com.au 

What’s next for Natural Gas prices

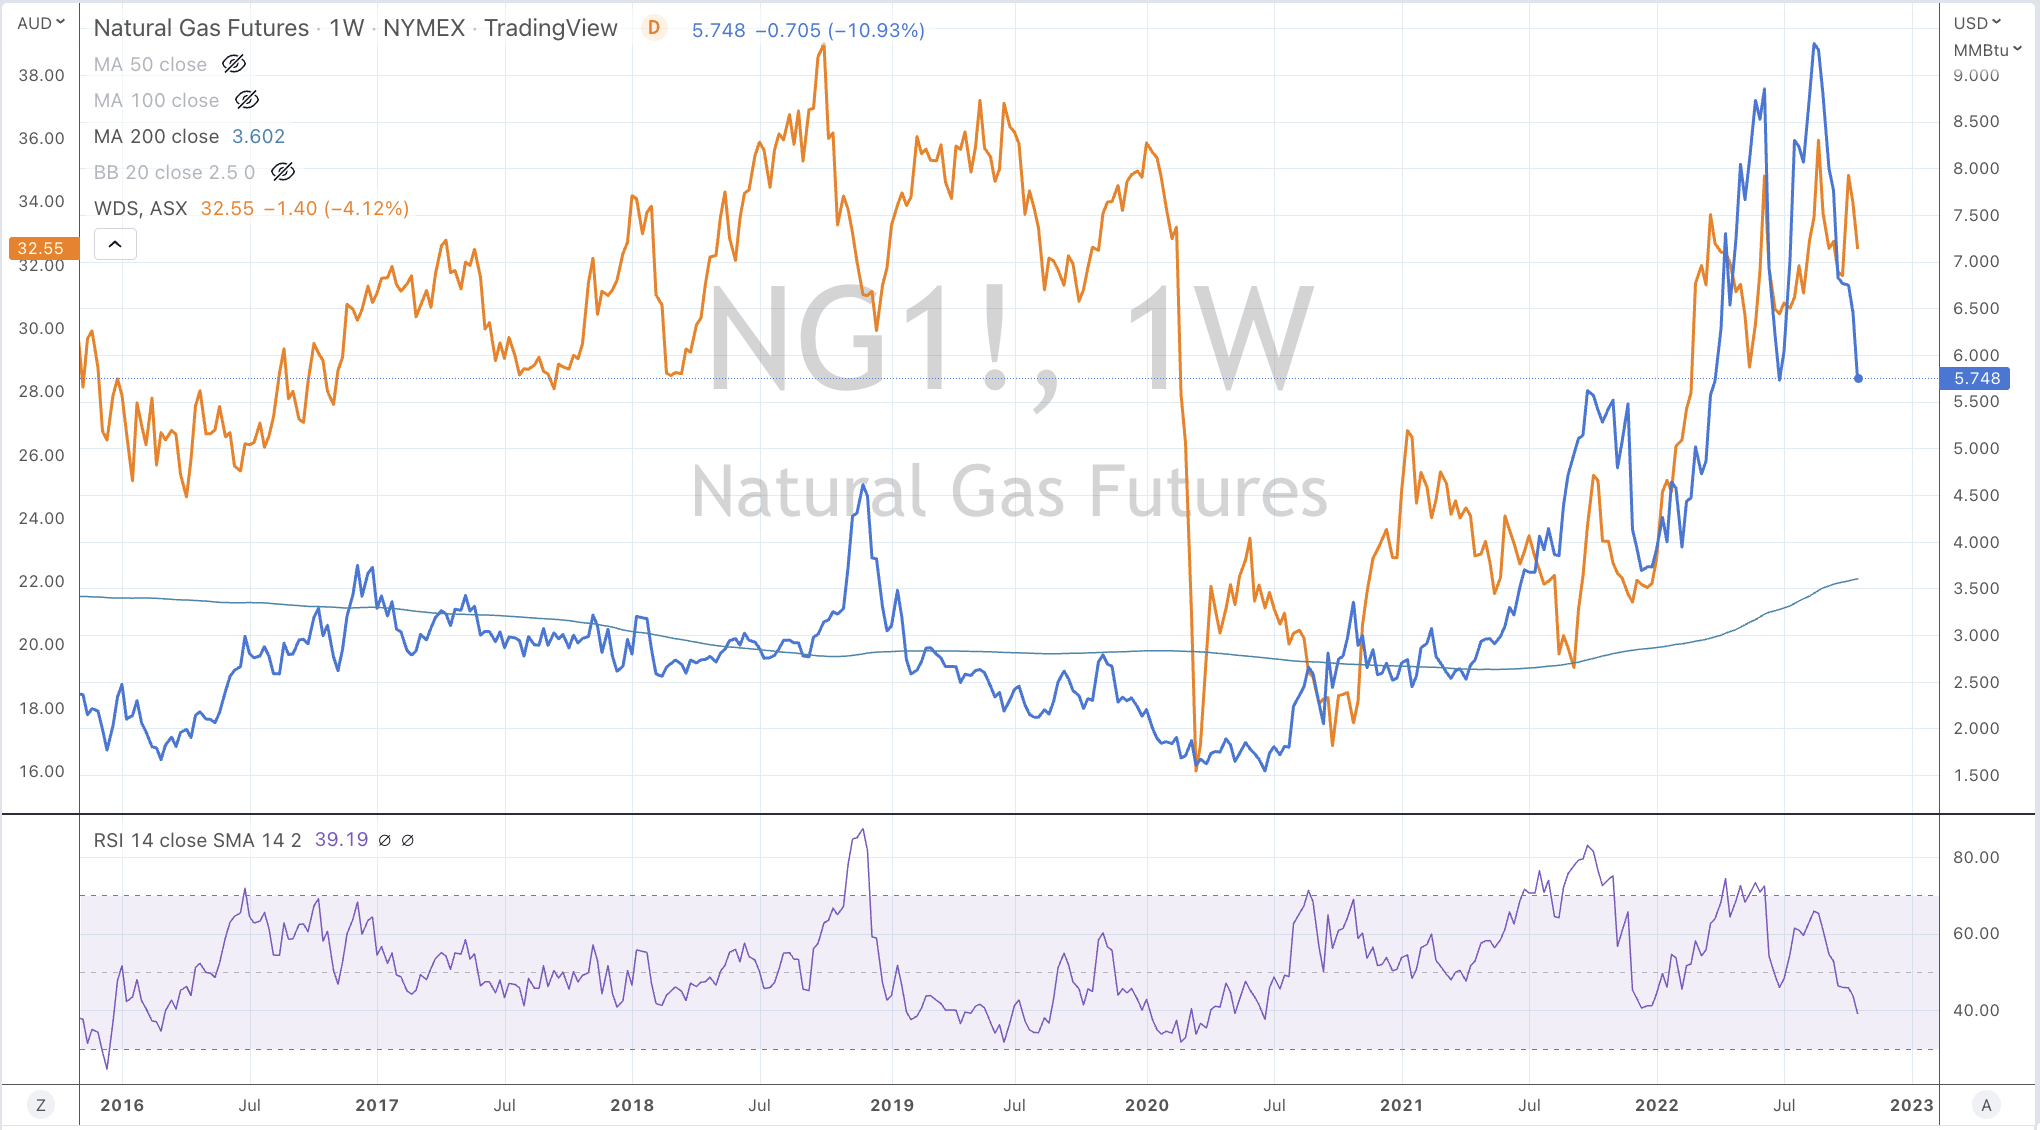
Today, the price of Natural Gas reached my $5 target, having halved from its (exuberant) $10 peak, only 2 months ago.

My series of posts commenced on June 7th, 2022 when I called Natural Gas the ‘mother of all peaks’.

https://lnkd.in/dAY–5aP

In mid-late August 2022, I started to publish my views that the price of Henry Hub Natural gas would halve.

I warned of the risks chasing parabolic price moves in Natural Gas in this post.

https://lnkd.in/dDrqzSxr

On August 25th, 2022, 2 days following the peak and the original post, I made my $5 price target call and cryptically cited that it would have a negative affect of the stockmarket.

https://lnkd.in/dWbHANU5

The S&P 500 closed at 4,199 on August 25th 2022. 

Today, the S&P 500 closed at 3,753.

Even after this week’s 4.7% advance, the S&P has declined 10.6% over the past 2 months.

Then, this next note was written when Natural Gas reached its half way point at $7.50

https://lnkd.in/dDrqzSxr

On Sept 23rd, (a month into this trade), I refined the timing of when I expect to see my $5 target reached.

I said, “I see $5 in Natural Gas being reached in the last days of October or into the first 10 days of November 2022.”

https://lnkd.in/dFknc56p

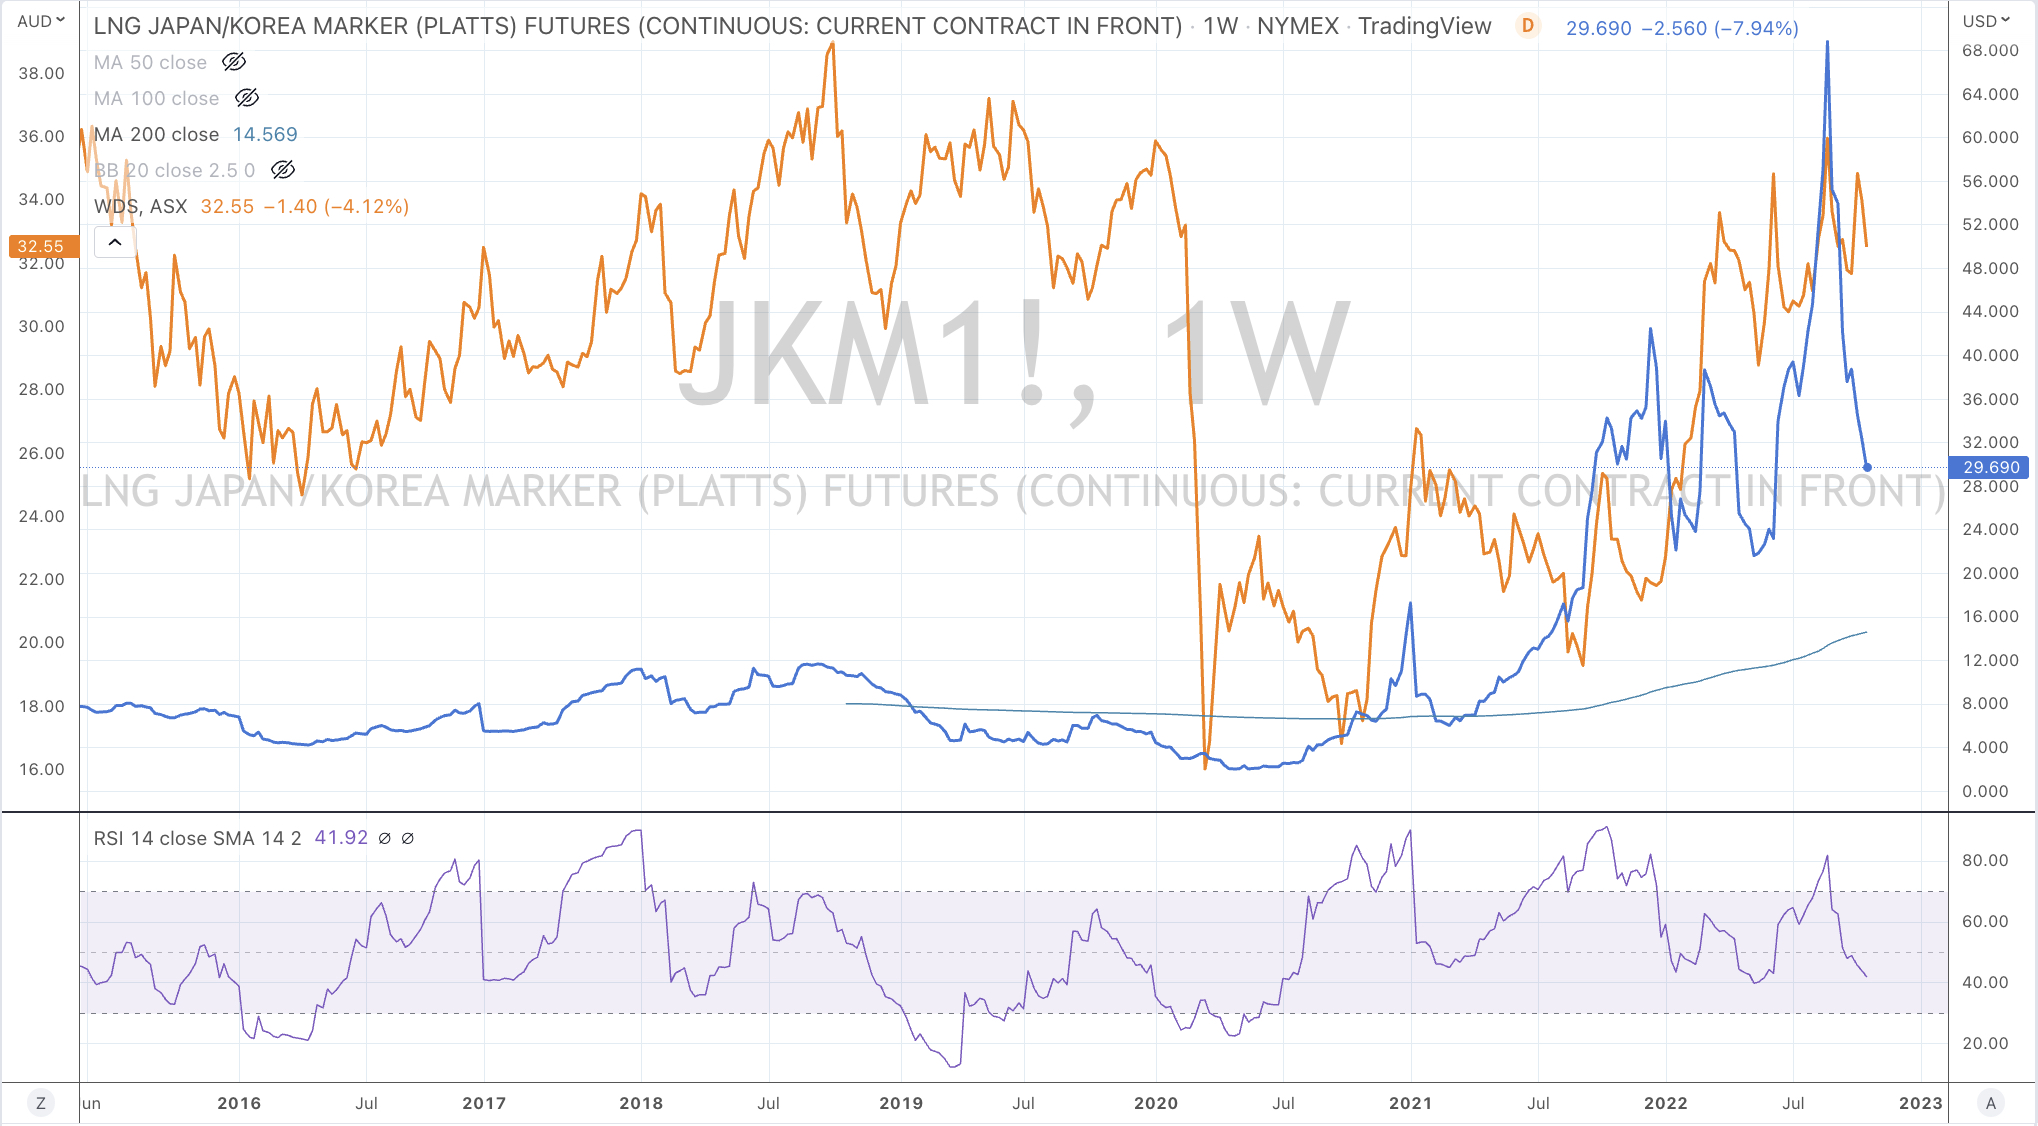
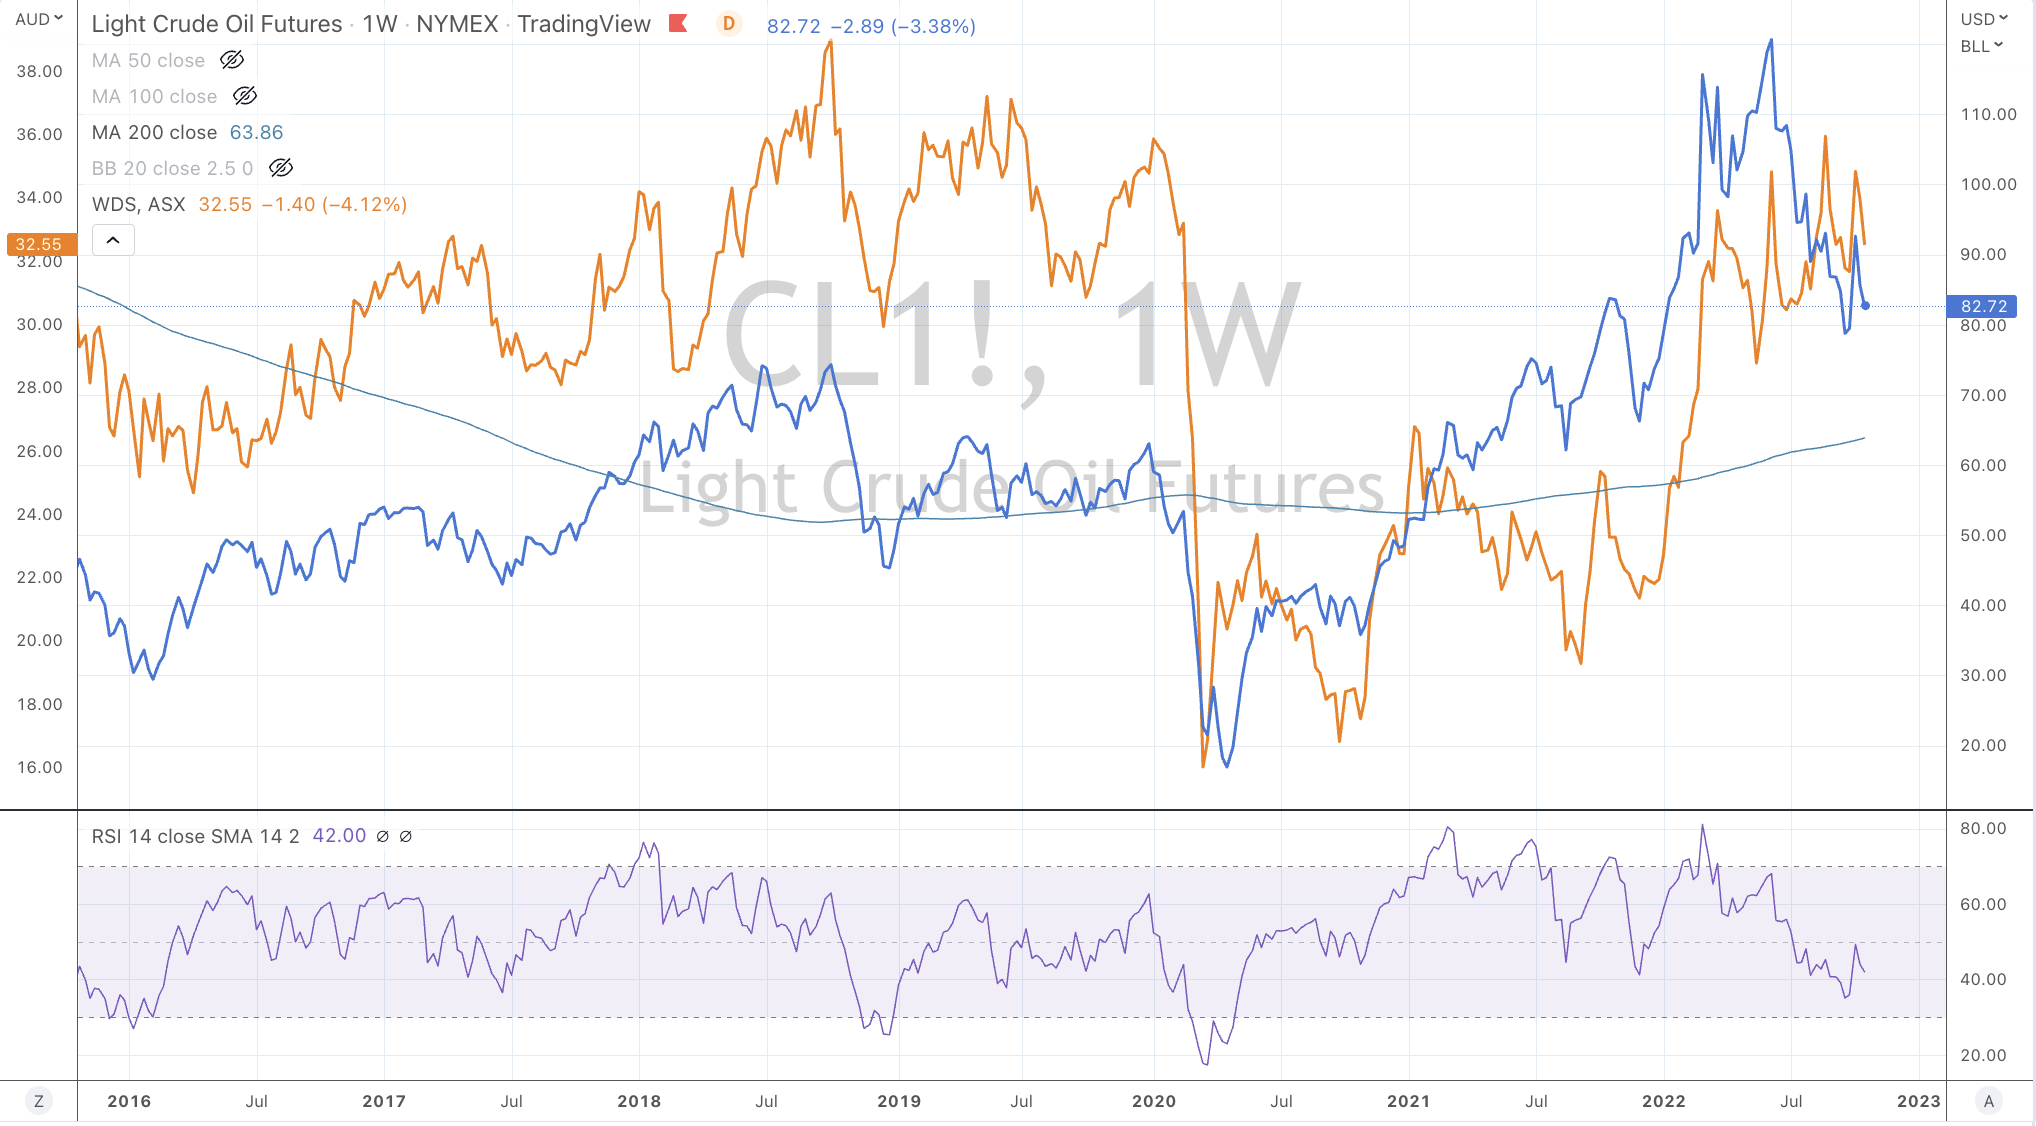
And this decline in Natural Gas (and pending moves across the energy complex) should have correlating effects to energy stocks and inflation, or rather deflationary effects.

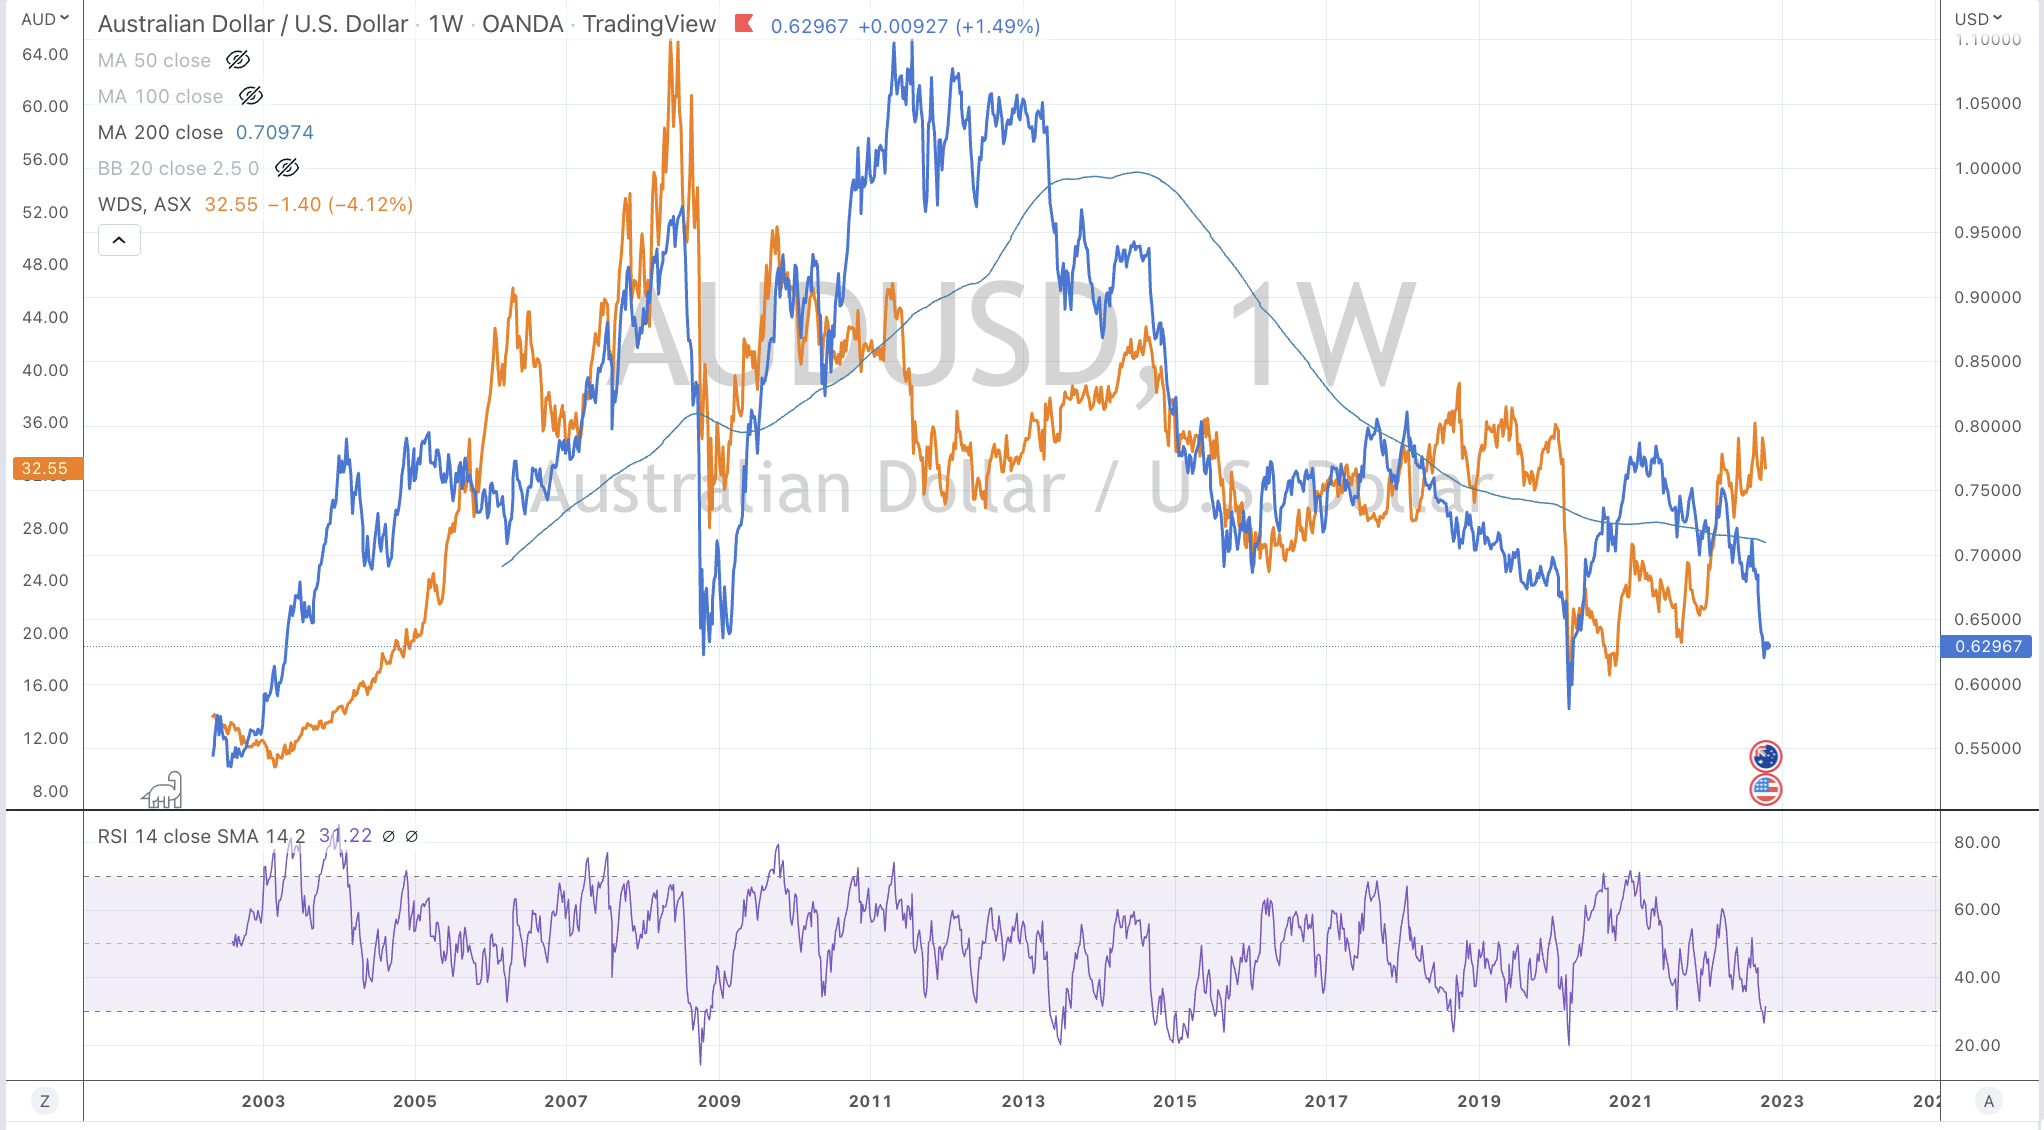
In early September, I wrote about the correlation of the U.S. Natural Gas price with the Australian inflation rate

https://lnkd.in/dDrqzSxr

A few days ago, I added these comments along the same thinking.

https://lnkd.in/ditshZgv

https://lnkd.in/g3gCn4HZ

And highlighted the massive declines amongst the previously rampaging ‘other’ gas prices.

https://lnkd.in/dbff-YCS

Today, the price of Natural Gas reached my $5 target.

What’s next for the Natural Gas price?

I would expect a bounce over the next week or so before the weakness resumes.

Statistically, NG has declined for 8 weeks consecutive weeks. A streak that is hasn’t seen since for 10 years.

Natural Gas saw a 6 week declining streak in mid 2014 when it fell from $4.26 to $2.94.

A 7 week losing streak in 2010 and a 9 week streak of weekly declines in the 1st quarter of 2012.

Commodities, currencies, equities and bond yield seldom string together more than 7 consecutive weeks of one-way travel.

However, the downtrend across a few timeframes remains intact.

$4.76 – $4.80 is a major support for the Natural Gas price.

A decisive break below that, pending my other indicator work may increase probability of a visit of to $3.38 – $3.44 region.

$4.20 would be a more plausible bottom.

October 22, 2022

by Rob Zdravevski

rob@karriasset.com.au   

Accenture stock action update

A $248 target that I was looking for in Accenture was touched last week

Accenture’s stock price completed a mean reversion towards its long term 200 week moving average

However, the downtrend in the stock price remains intact as does the strength of the trend.

While this suggests more weakness in the stock price, I’ll watch whether the stock makes ‘lower lows’.

A ‘higher high’ to reverse this decline from $417, would require the stock to trade back above $323.

I’ll keep in mind that whenever a low is recorded, I wont be thinking that this stock automatically bounces or reverts to those previous lofty heights.

ACN needs to hold $241 next

October 20, 2022

by Rob Zdravevski

Karri Asset Advisors

rob@karriasset.com.au

TSLA is nearing my downside target

This is a story of knowing when not to chase something.

It is a message about being careful amidst hype, cult and zealousness

It’s not necessarily something I was interested in shorting.

I find shorting difficult.

I have been calling the price of Tesla lower for a good year or so.

9 months ago, I wrote (in this note), “we’ll look for a visit to $650, then $567 while $519 would represent a good shake-out.”

That was the pricing of Tesla stock before the 3 for 1 stock split.In today’s after-market action, following its latest quarterly release sees TSLA shares trading at $208 (or $624 in pre-split prices)
The 200 week moving average which I continue to reference in stories I tell, sits at $157.That mean should rol up to the $161 region in the next few weeks.$161 is equal to $483.
Which meets and is a little lower than that pre-split target of $519.


8 months earlier, I wrote this note. My timing was off.

3 months ago, this was posted.

October 22, 2022

by Rob Zdravevski

rob@karriasset.com.au

Energy stocks correlations

The next directional move in Woodside shares hinge on the direction in and or a combination of the Japan/Korea LNG Marker, the U.S. Natural Gas price, the West Texas Intermediate (WTI) Crude Oil prices along with the AUD/USD.

The charts below show the various correlations between Woodside shares and those assets.

My analysis of Woodside shares suggests that has a further 15% downside risk to $28, which is where I will be a buyer.

I may perform this exercise across other energy related equities.

JKM LNG Marker (in blue) versus Woodside

Henry Hub Natural Gas (in blue) versus Woodside

WTI Crude Oil (in blue) versus Woodside 

AUD/USD (in blue) versus Woodside 

October 19, 2022

by Rob Zdravevski

rob@karriasset.com.au

Gas prices halve, no surprise

Who would’ve thought that Gas prices could go down, let alone halve.

Well, the Dutch TTF Gas price has as has the Japan Korea LNG Marker (JKM) price.

It may seem perverse that this can happen but not really to others.

Henry Hub Natural Gas has nearly halved from its $10 peak.

Well, its currently $6 and nearing that $5 call I made in this note;

Market forces tend to fix extreme moves in prices.

October 18, 2022

by Rob Zdravevski

rob@karriasset.com.au

Still not time to buy the ASX 200

When the S&P Goldman Sachs Commodity Index (SPGSCI) registers a Weekly Oversold reading, it may provide a ‘safer’ moment to buy the ASX 200 (XJO) Equity Index

Safer, doesn’t the lowest or ‘best’.

It’s a reminder to space out the accumulation of the XJ) whilst the SPGSCI is wallowing in Oversold territory.

At the most wicked periods of declines seen in 2008 and 2020, the maximum drawdown of 20% from the first moment the SPGSCI went Oversold.

In every other occurrence, we didn’t a drawdown of more than 7% from the minute the SPGSCI trickled into Oversold territory.

While I use a number of other indicators to help finesse entry prices, I always remind myself that ‘no one deserves the bottom’.

As a side note, this study also tells me to wait for lower commodity prices which will also reflect on related equities in that sector.

Keep in mind that the phrase ‘commodities’ covers the whole basket.

There are specific commodities which are already or closer to buying levels today.

October 17, 2022

by Rob Zdravevski

rob@karriasset.com.au

Aussie vs Canadian Loonie is nearly Oversold

A Weekly Oversold reading in the AUD/CAD signals a reasonable buying opportunity in the ASX 200

One hiccup occurred in September 2018 denoted by the red vertical line.

The AUD/CAD isn’t Oversold at the moment, nor is the ASX 200

October 17, 2022

by Rob Zdravevski

rob@karriasset.com.au

Health Check – the Copper/Gold Ratio

Checking in on the Copper/Gold Ratio and if it is Oversold on a Weekly basis because its coincides with a “low” in the S&P 500.

We saw the most recently occurrence in June 2022.

We can also look at the Copper/Gold Ratio as an indicator of the economy’s health.

A glass half-full suggests the economy currently isn’t ‘too sick’

A glass half-empty view ponders that the economy is heading into sickness.

There is no written rule that the Copper/Gold Ratio needs to ‘double dip’ into Oversold territory again. It may already have done its ‘sickness’ signalling and we haven’t seen it make such a double dip before.

Would would it take to do so?

One scenario would be to see the Copper price trade to $3.00 (12% lower than today) while the price of Gold remains steady.

My studies suggest this is plausible while Copper’s medium term trend remains downward.

It’s worthy to note that the Copper/Gold Ratio (HG/GC) correlates well with the direction of interest rates and currently there is a notable divergence occurring, with U.S. 10 year bond yields drifting higher and apart from the HG/GC.

That’s for another post.

October 17, 2022

by Rob Zdravevski

rob@karriasset.com.au

Being a ‘markets guy’ is an occupational hazard

I remember watching a program on Bloomberg in October 2021 where Eric Schatzker interviewed Lloyd Blankfein, in which the latter described himself as a “markets guy”.

These type of people know the price of many things in many markets around the world and as Mr Blankfein said, it’s an occupational hazard.

After last Thursday intra-day reversal in the U.S. stockmarket, where the market fell 2.5% and then rose 5% to close, up 2.5%…..Mr Blankfein said this, “This is one of those trading days where if you had the news in advance (above-expected CPI), you REALLY would have lost a lot of money.”

He’s not a prolific quote dropper but he does, they’re good.

Another is, “The best traders are not right more than they are wrong. They are quick adjusters. They are better at getting right when they are wrong.”

And then there is this one, “At the end of the day, it’s not a normal condition to have interest rates at zero.”.

October 16, 2022

by Rob Zdravevski

rob@karriasset.com.au