Energy stocks correlations
October 19, 2022 Leave a comment
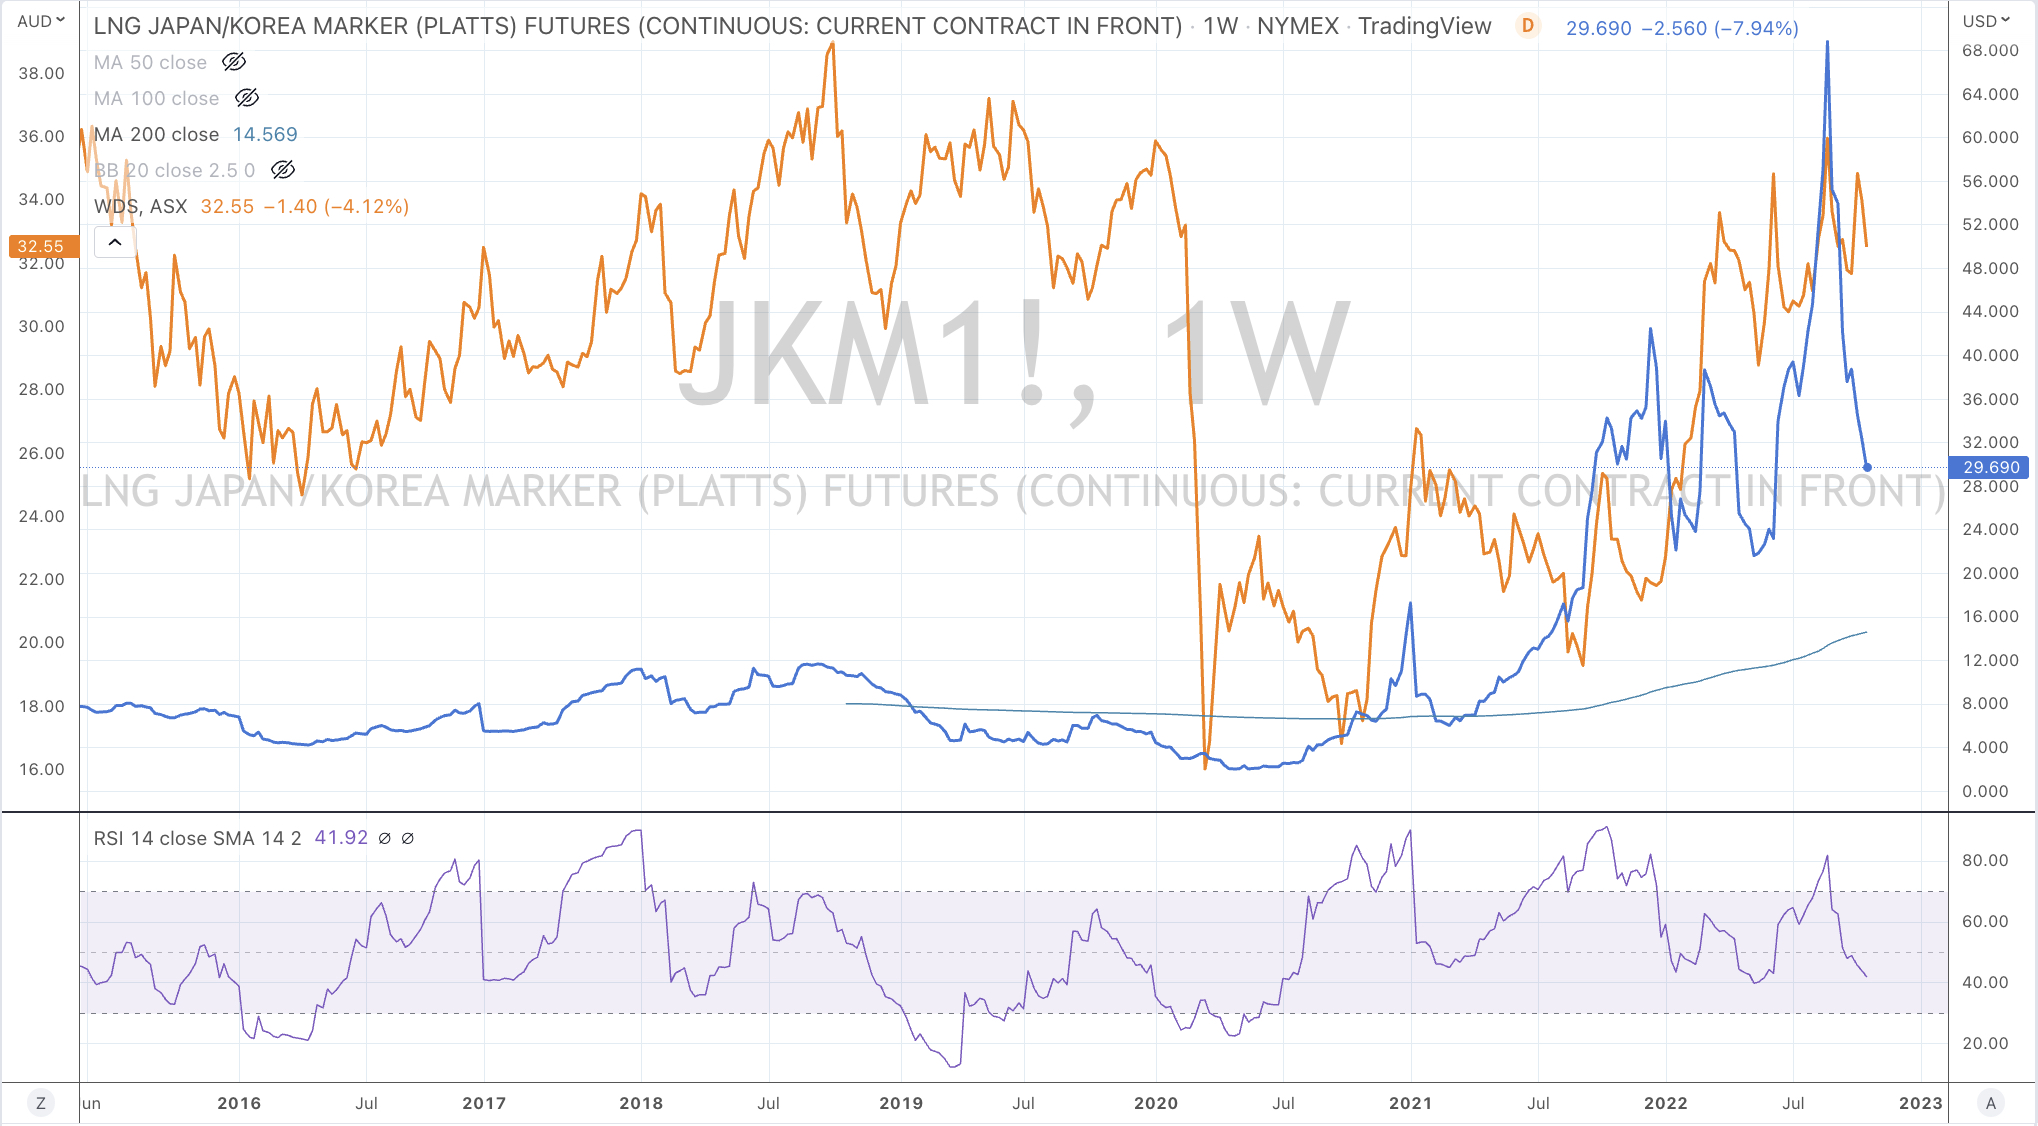
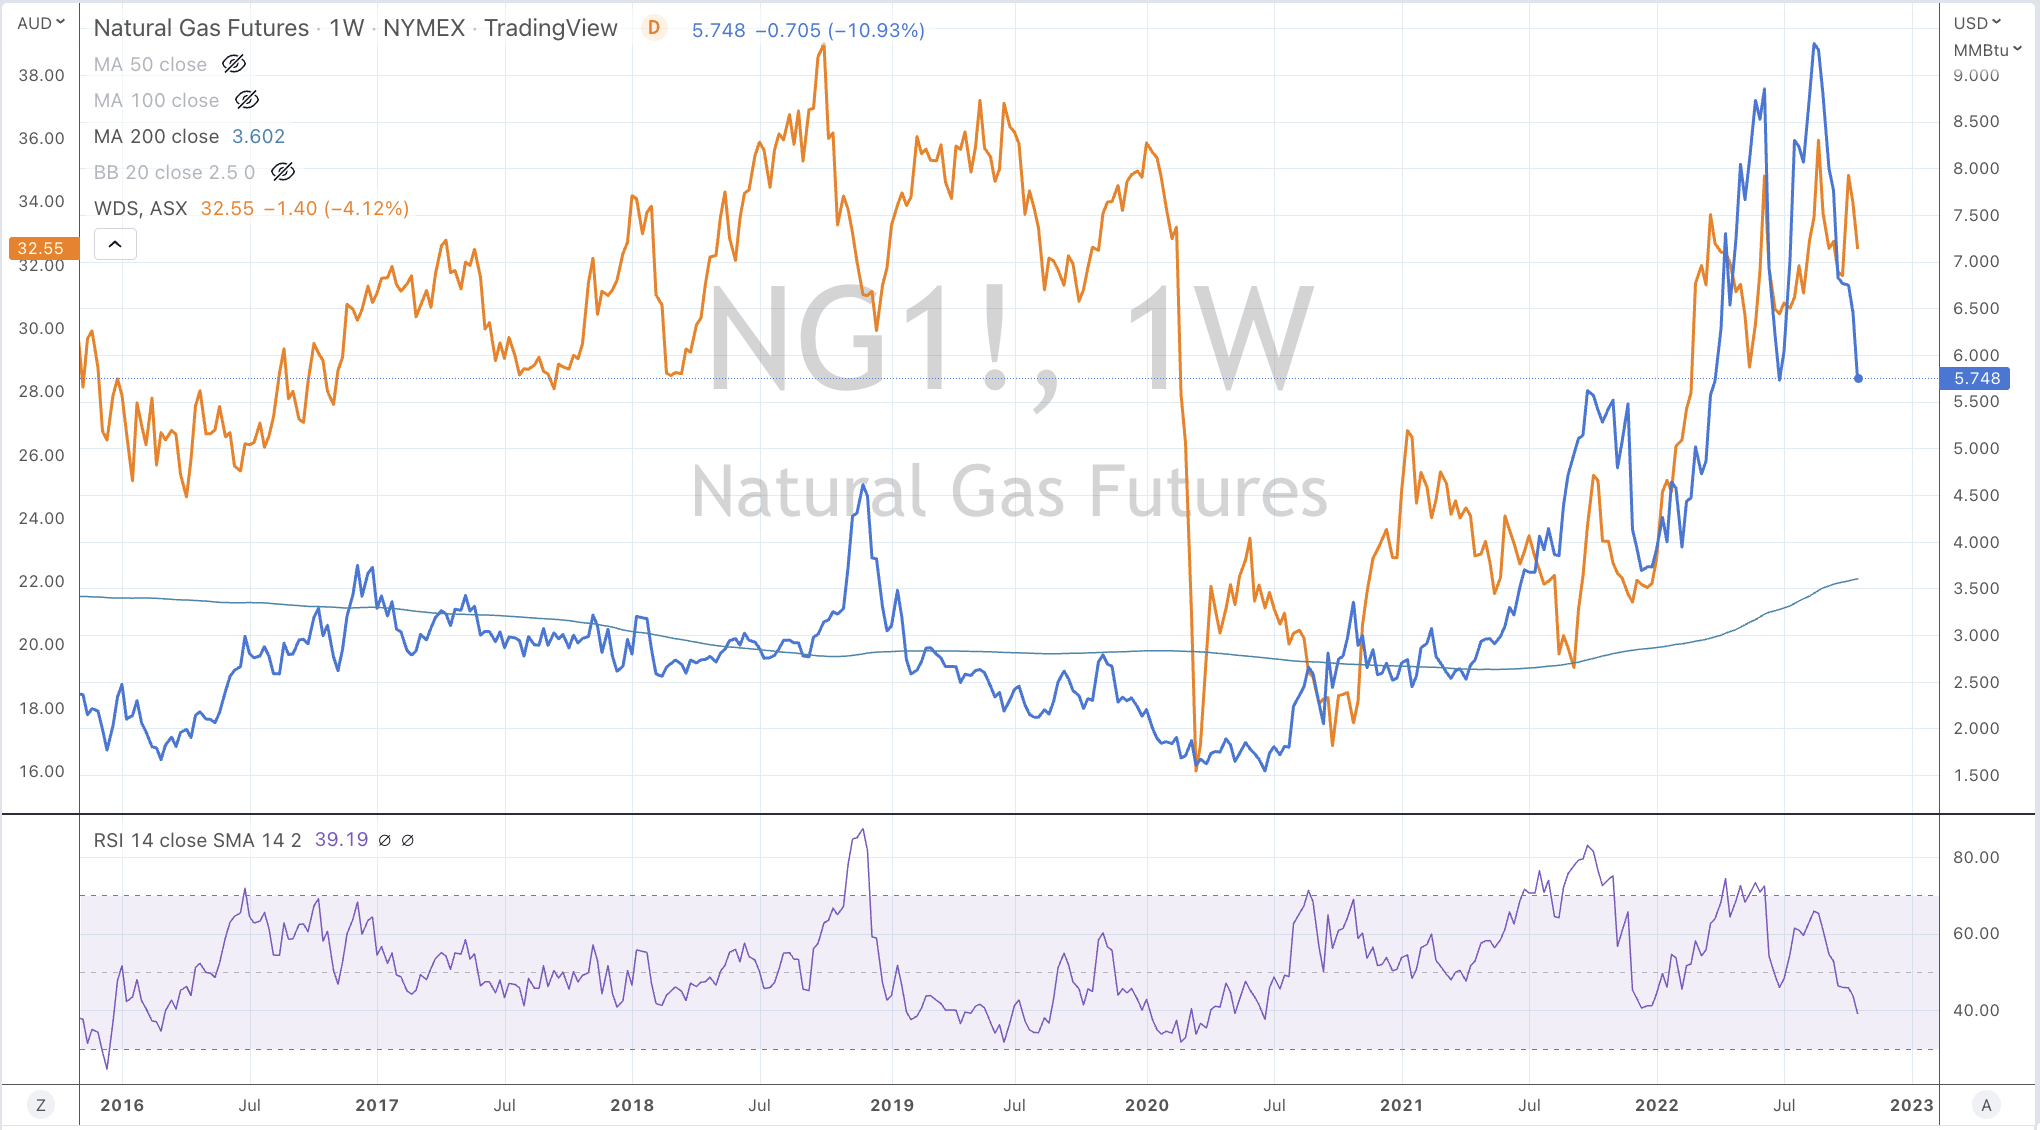
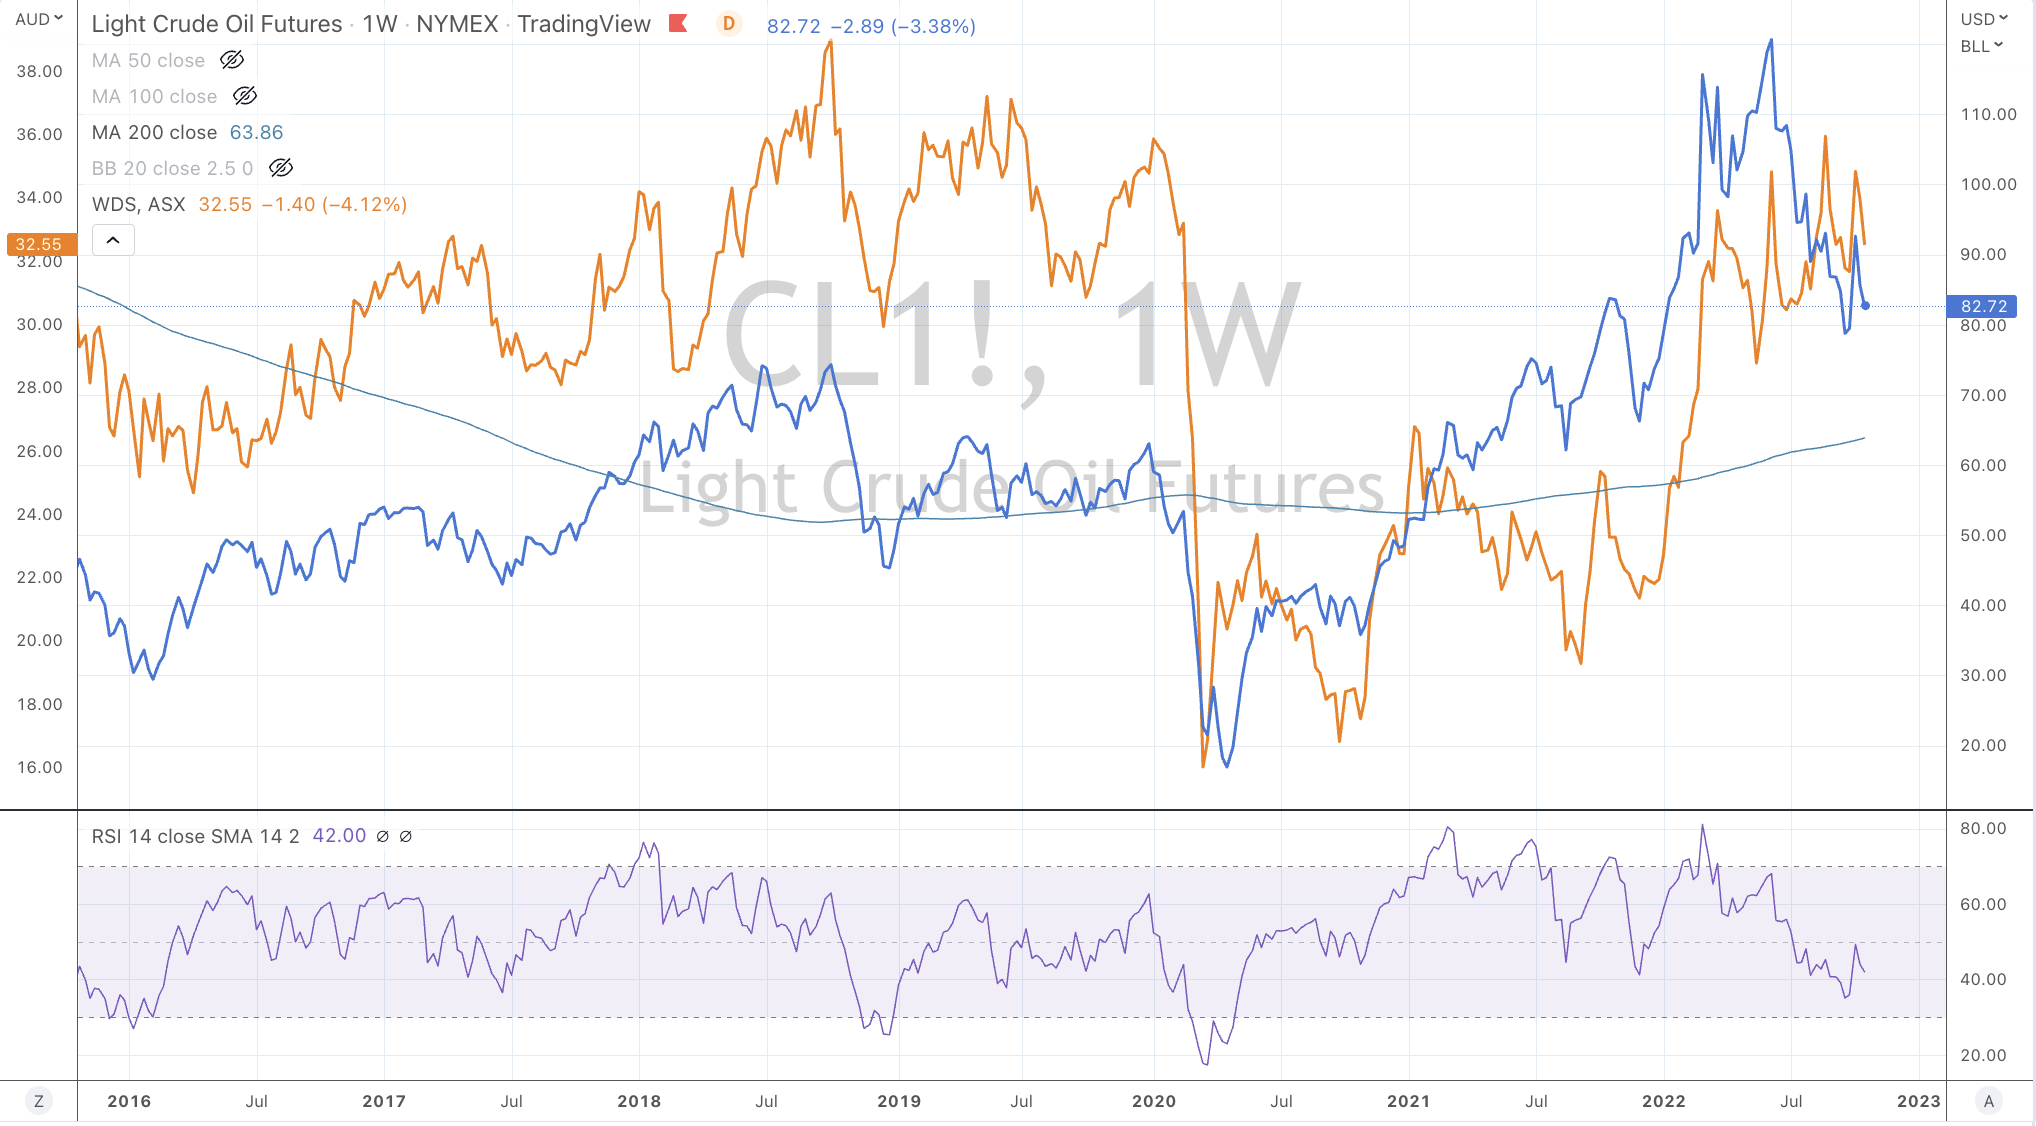
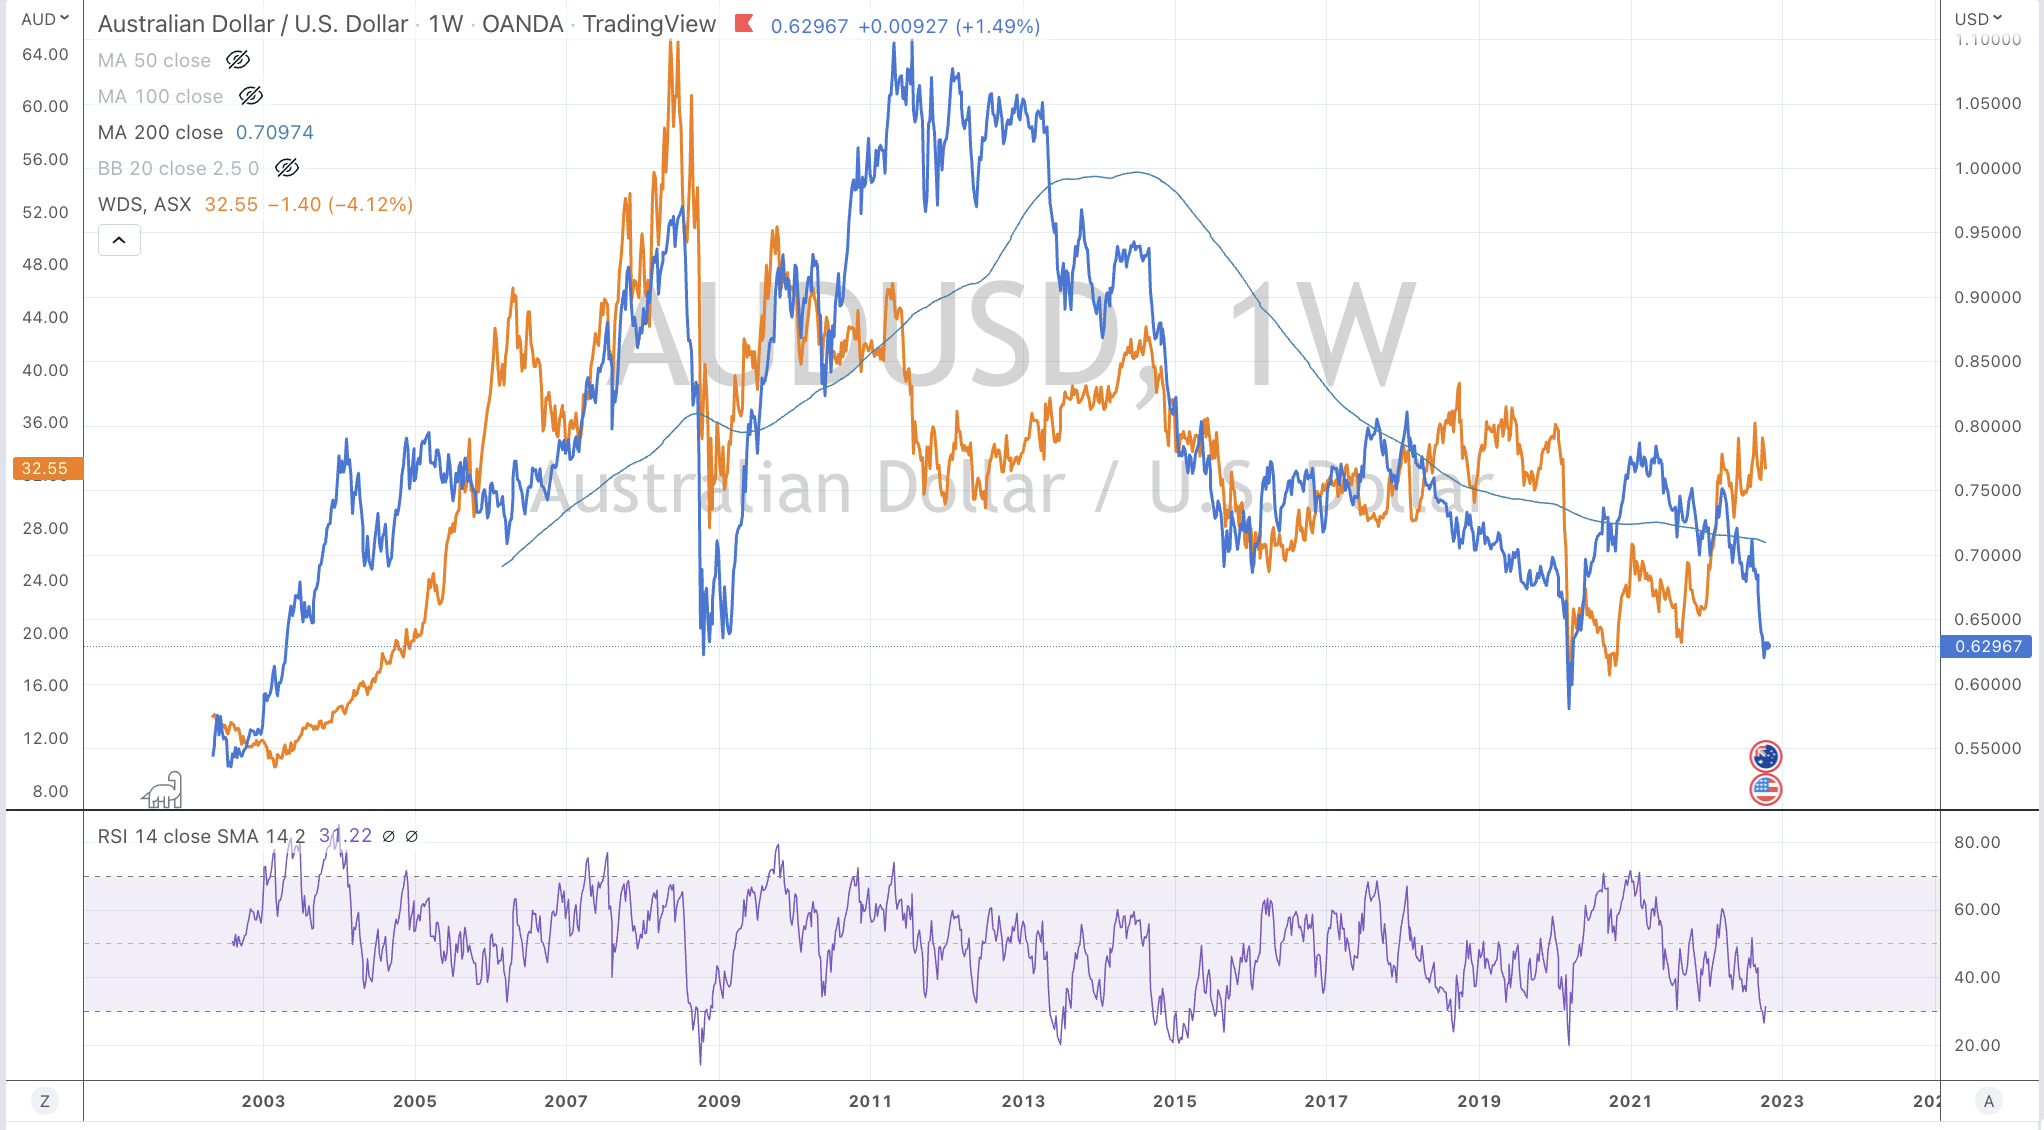
The next directional move in Woodside shares hinge on the direction in and or a combination of the Japan/Korea LNG Marker, the U.S. Natural Gas price, the West Texas Intermediate (WTI) Crude Oil prices along with the AUD/USD.
The charts below show the various correlations between Woodside shares and those assets.
My analysis of Woodside shares suggests that has a further 15% downside risk to $28, which is where I will be a buyer.
I may perform this exercise across other energy related equities.
October 19, 2022
by Rob Zdravevski
rob@karriasset.com.au
