Still more downside in Tesla
July 7, 2022 Leave a comment
In this January 2022 note about Tesla’s stock price, I said…..
“If Tesla’s stock price breaks below $835, $814 is a minor stopping point, beyond that we’ll look for a visit to $650, then $567 while $519 would represent a good shake-out.”
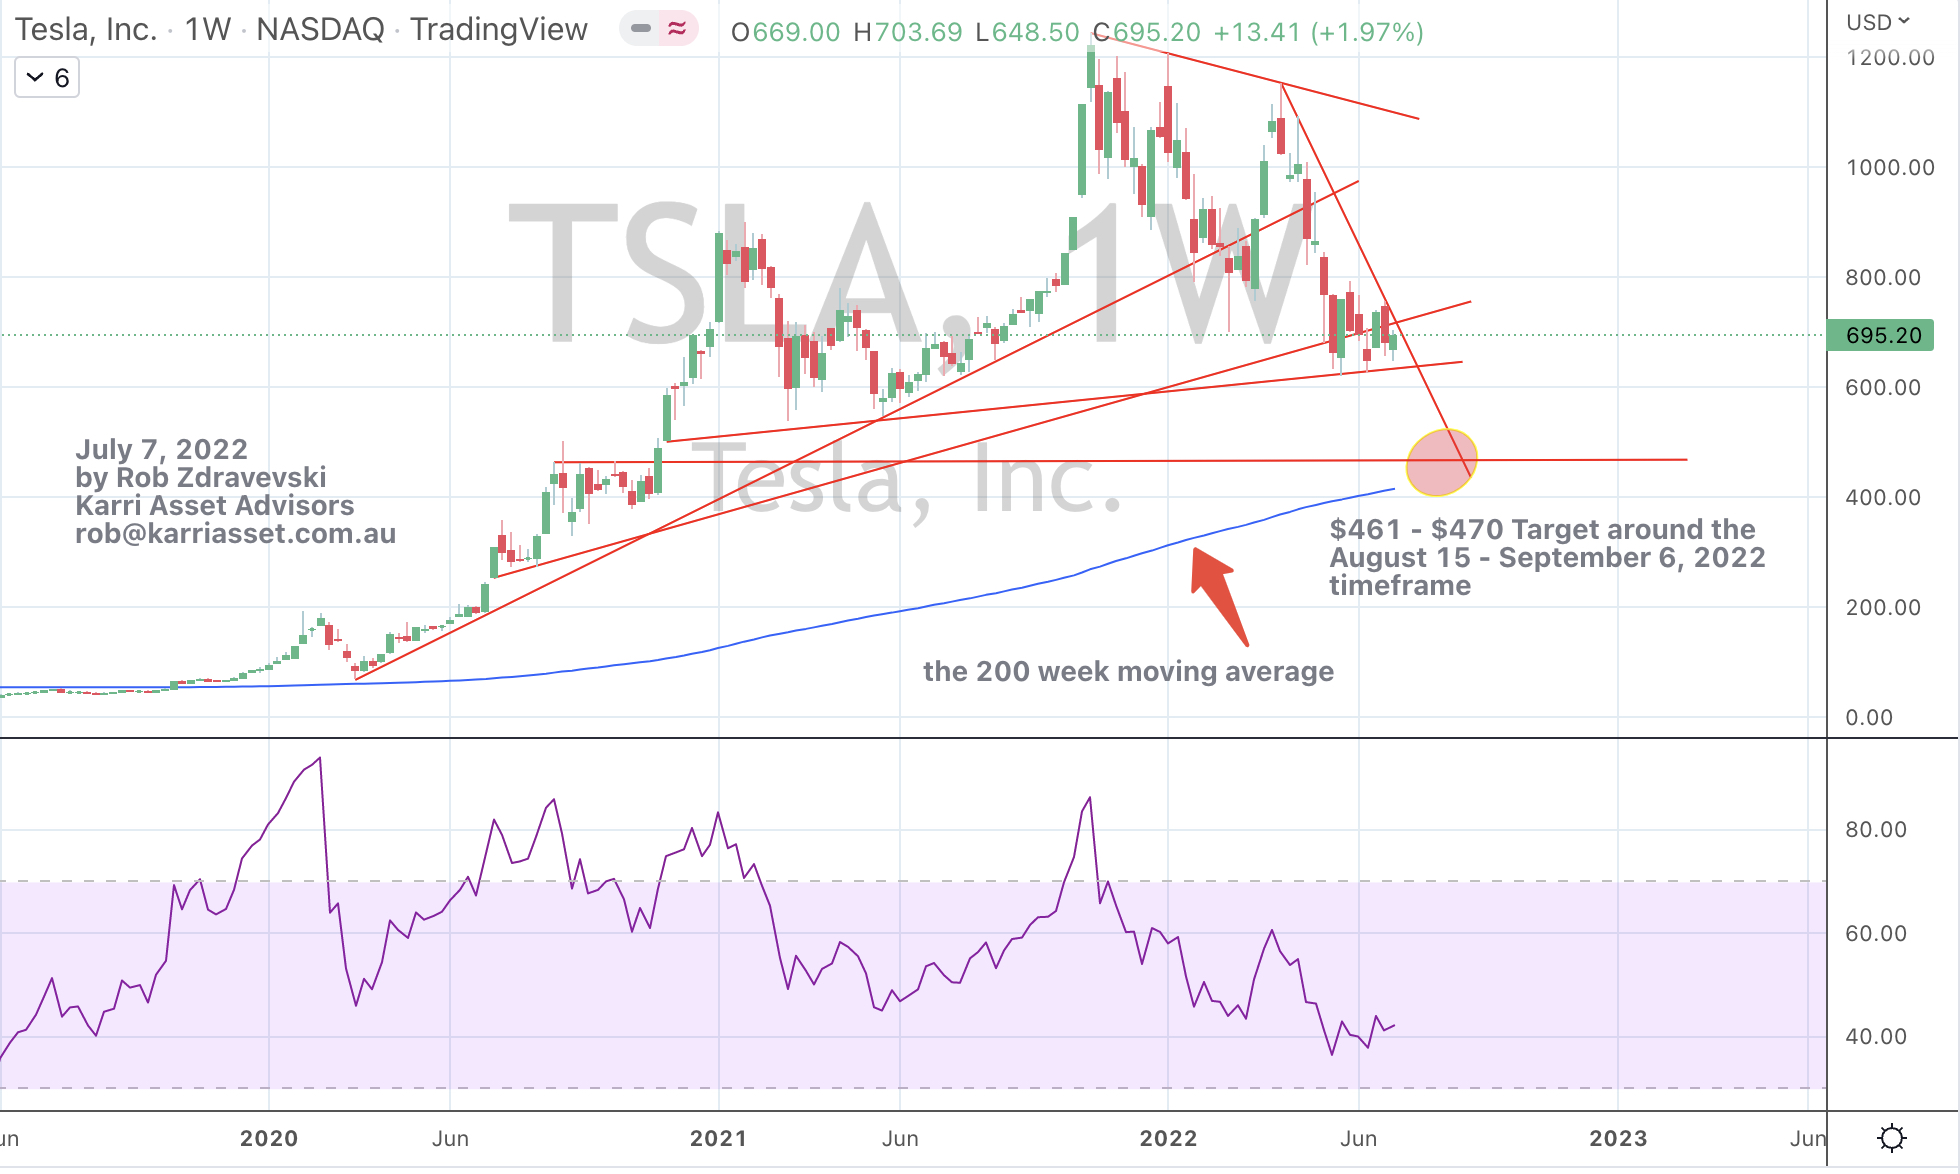
Since then, the chart below shows that it broke below that $835 support, while it didn’t reach $650, it paused at $700 before attempting its next rally, which didn’t produce a ‘higher high’.
Today, Tesla’s stock price is sitting just above that $650 and I still see Tesla on track to test those lower prices mentioned in that January 2022 post.
For a bit of sport, I think the stock can trade into the $461 – $470 region as we enter late August or early September 2022.
Observe the rolling mean
Another relevant point I want to make is the 200 week moving average (which has been a feature of my longer-term mean reversion thesis) does move and often it rolls higher.
For example, in September 20021, that 200 WMA was $240. In January 2022 it was sitting around $320 and now it is at $415.
The mean is a ‘living’ and dynamic thing.
One could say that while prices are under a gravitational pull towards the mean, the mean is equally busy converging towards the current stock price.
July 7, 2022
by Rob Zdravevski
rob@karriasset.com.au