A weekly Macro, Cross Asset review of prices trading at extremes which may generate future investment ideas and opportunities
The following assets (on a weekly timeframe) registered an Overbought or Oversold reading and/or have traded more than 2.5 standard deviations above or below its rolling mean.
Extremes “above” the Mean (at least 2.5 standard deviations)
Chinese 10 year government bond yields
Silver
Platinum
Gold (in CAD)
NZD/AUD
Overbought (RSI > 70)
German 2 year government bond yields
Cattle
Istanbul BIST Index
The Overbought Quinella – Both Overbought and Traded at > 2.5 standard deviations above the weekly mean)
HKD/USD
Nickel
Extremes “below” the Mean (at least 2.5 standard deviations)
None
Oversold (RSI < 30)
Hot Rolled Coil Steel (HRC)
U.S. 5 year yield minus U.S. 3 month bill yield spread
The Oversold Quinella – Both Overbought and Traded at > 2.5 standard deviations above the weekly mean)
None
Notes & Ideas:
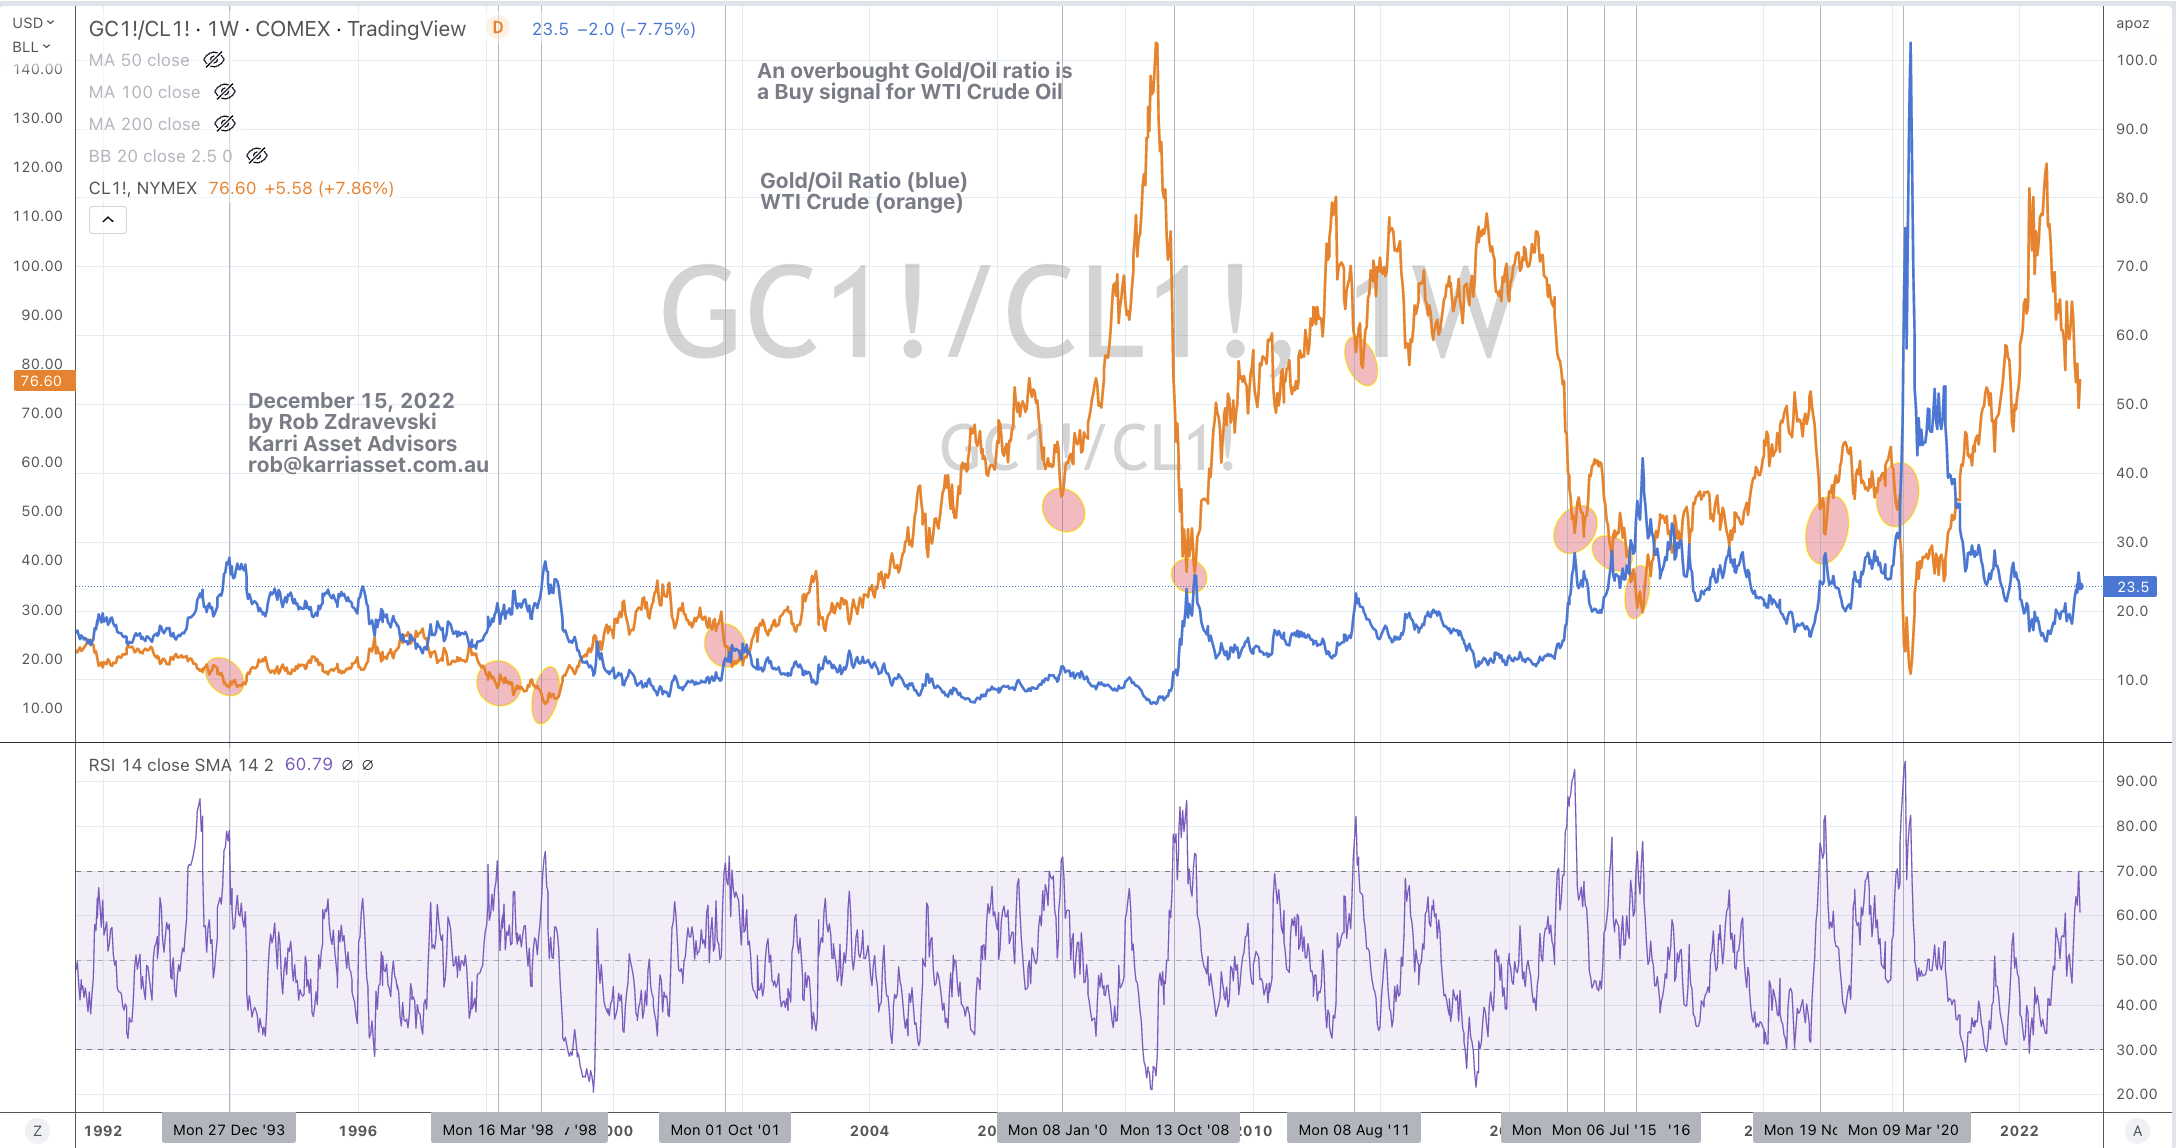
The big news for the week was the continued, sustained and notable drop in energy prices.
Oil, Gasoline, Heating Oil and Diesel (Gasoil) fell 10%….imagine that, all amongst a Northern Hemisphere winter.
Seeing energy prices fall (and mean revert) surely adds to my case for deflationary pressures which add weight to the abatement in inflation statistics and government bond yields.
WTI Crude has declined 40% from their $120 high seen in June 2022. It’s now trading at $71.
Base metals rose with Nickel having a starring role.
Coffee remains Oversold as does Hot Rolled Coiled Steel. Both are on my radar.
There is good news. The S&P 500 didn’t make a lower low than the previous week and the TAIEX had an inside week…….it didn’t trade below nor above the previous week’s low and respective high.
However in last weeks edition I highlighted the concern over the lack of participation in the financials and transports in the recent rally, which still warrants monitoring.
Over the past week we saw bonds being sold, thus yields rose and I’ll be looking at their trend indicators to analyse continuation and strength. For now, many government bond yield ranging from German, British, Spanish, U.S. to French have reverted to their rolling weekly means.
Inversely, this is currently confirmed with bond TEF’s such as the IEI and IEF equally rallying up to their respective rolling weekly mean.
Gasoline is nearly oversold and at a1 year low, it must be good for trucking companies.
Wheat closed at its lowest since October 11, 2021 which is months prior to the Russian invasion of Ukraine.
And I must look at the correlations associated with AUD/CAD as it’s nearing an extreme level.
The larger advancers over the past week comprised of;
Baltic Dry Index 4.7%, JKM LNG 5.1%, Lumber 4.2%, Tin 8.2%, Nickel 15.3%, Orange Juice 5.7%, Palladium 3.6%, Silver 2%, Dutch TTF Gas 2.6%, Soybeans 3.2%, Istanbul 2.2%, CSI 300 3.3%, HSCEI 7.3% and the Hang Seng rose 6.6%.
The group of decliners included;
Aluminium (2.8%), Rotterdam Coal (2.3%), Bloomberg Commodity Index (2.4%), China Coal (2.3%), WTI Crude Oil (11.2%), Gasoil (10.7%), Heating Oil (11.8%), Coffee (2.7%), Gasoline (9.8%), CRB Index (3.8%), Cotton (2.7%), Brent Crude (10.8%), Oats (6.6%), Rice (5.2%), Wheat (3.5%), S&P GSCI (6.4%), KBW Bank Index (5.5%), DJ Industrials (2.7%), DJ Transports 5.2%, Bovespa (3.9%), Nasdaq Composite (4%), KOSPI (1.9%), S&P MidCap 400 (4%), Nasdaq Biotech Index (3.9%), Nasdaq 100 (3.6%), Russell 2000 (5%), S&P SmallCap 600 (4.8%), SOX (1.8%), S&P 500 (3.4%), TAIEX (1.8%), Toronto’s TSX (2.6%), Australia’s ASX 200 fell 1.2% while the ASX Small Capo index declined 2.7% and had an outside bearish week.
December 10, 2022
by Rob Zdravevski
rob@karriasset.com.au