A call that I’m not hearing much about it for lower #oil prices.
My historical posts have called for WTI Crude to around an initial visit to $64, and failing that $46-$48.
I think the probability for the latter is gaining.
Today, WTI Crude is $69.40.
A $46 price in WTI #Crude correlate with lower Nat Gas prices and the share prices of related petro/hydro chemical companies.
As an example, that may translate to seeing the trading of stock prices in companies such as #Woodside (WDS.AX) at A$19, #BP at 333p and #Occidental (OXY.N) <US$38.
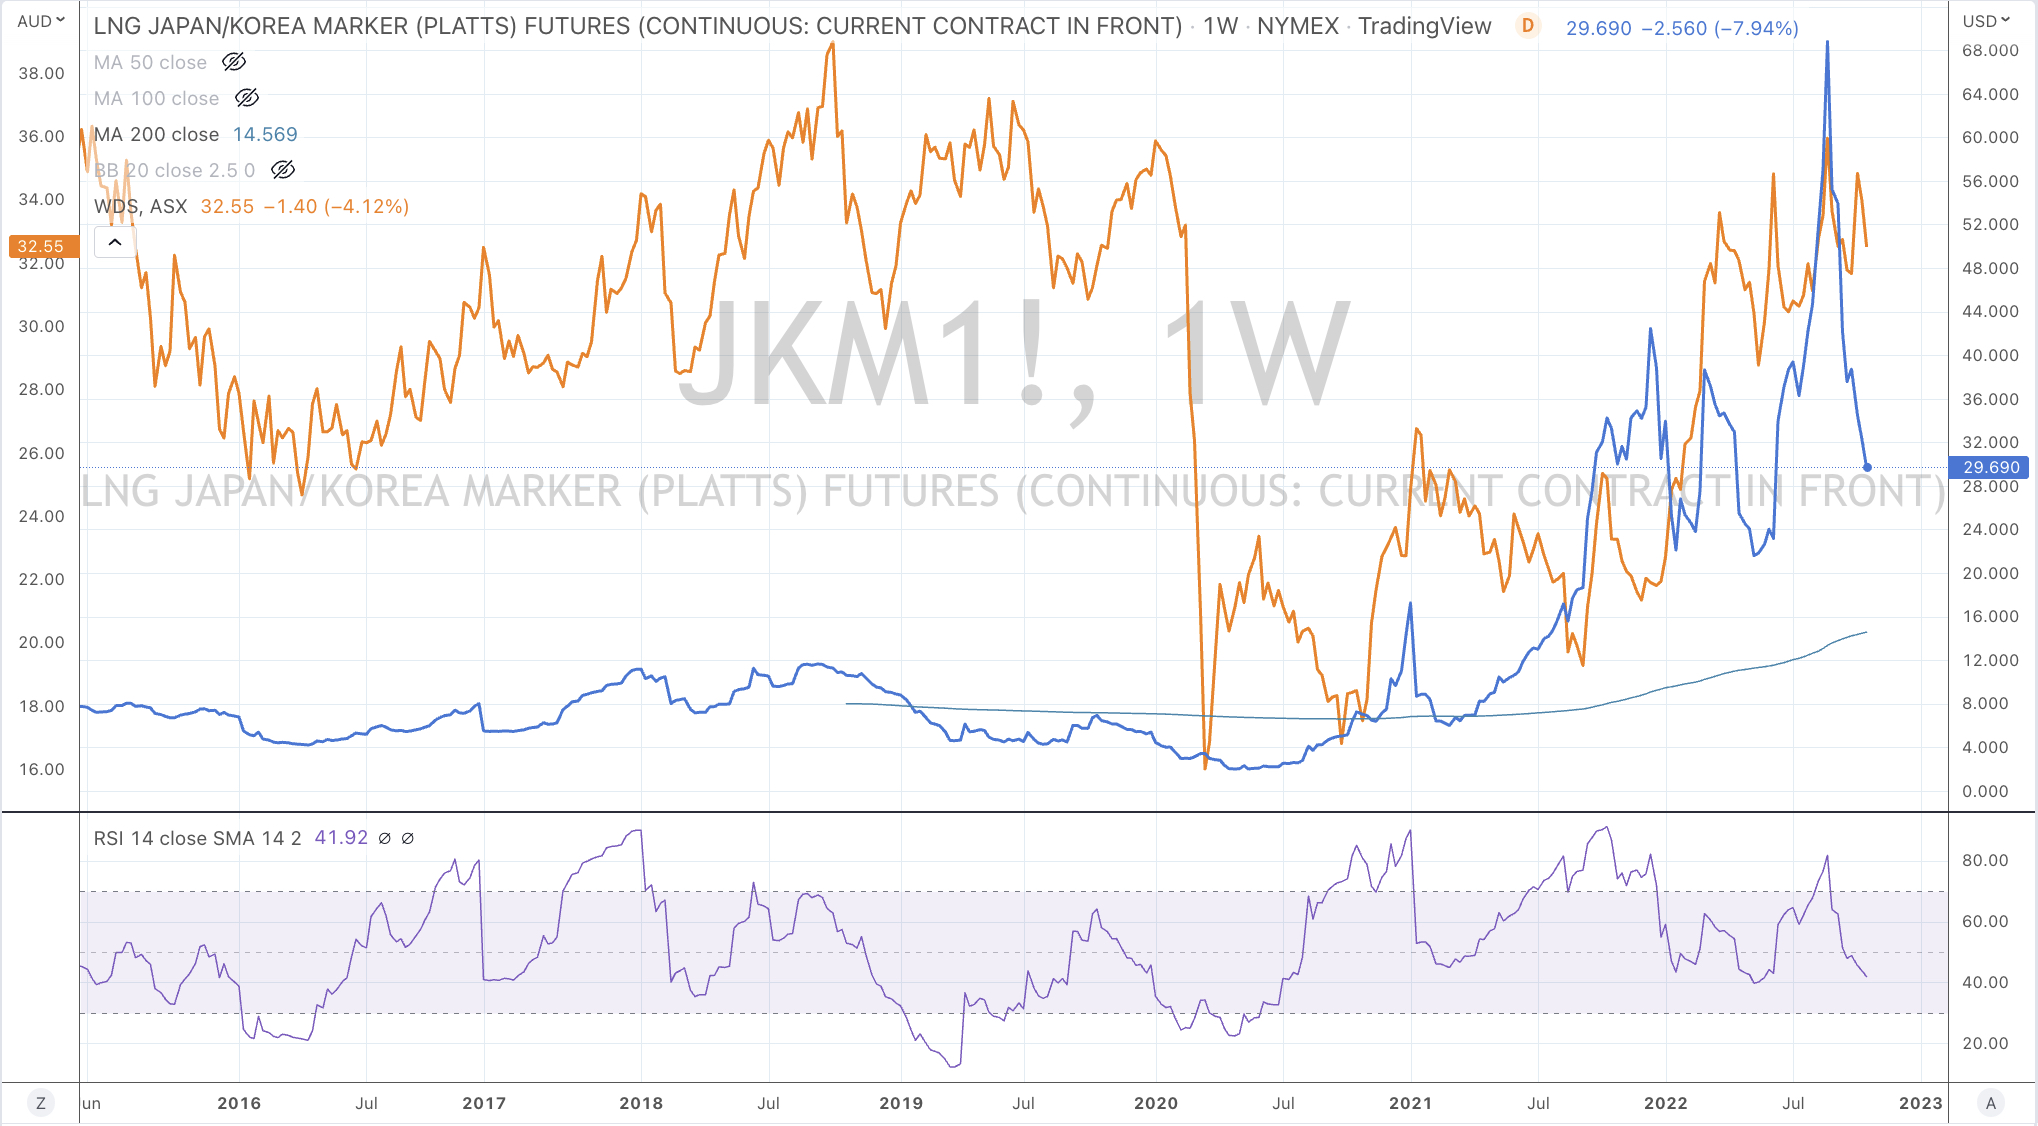
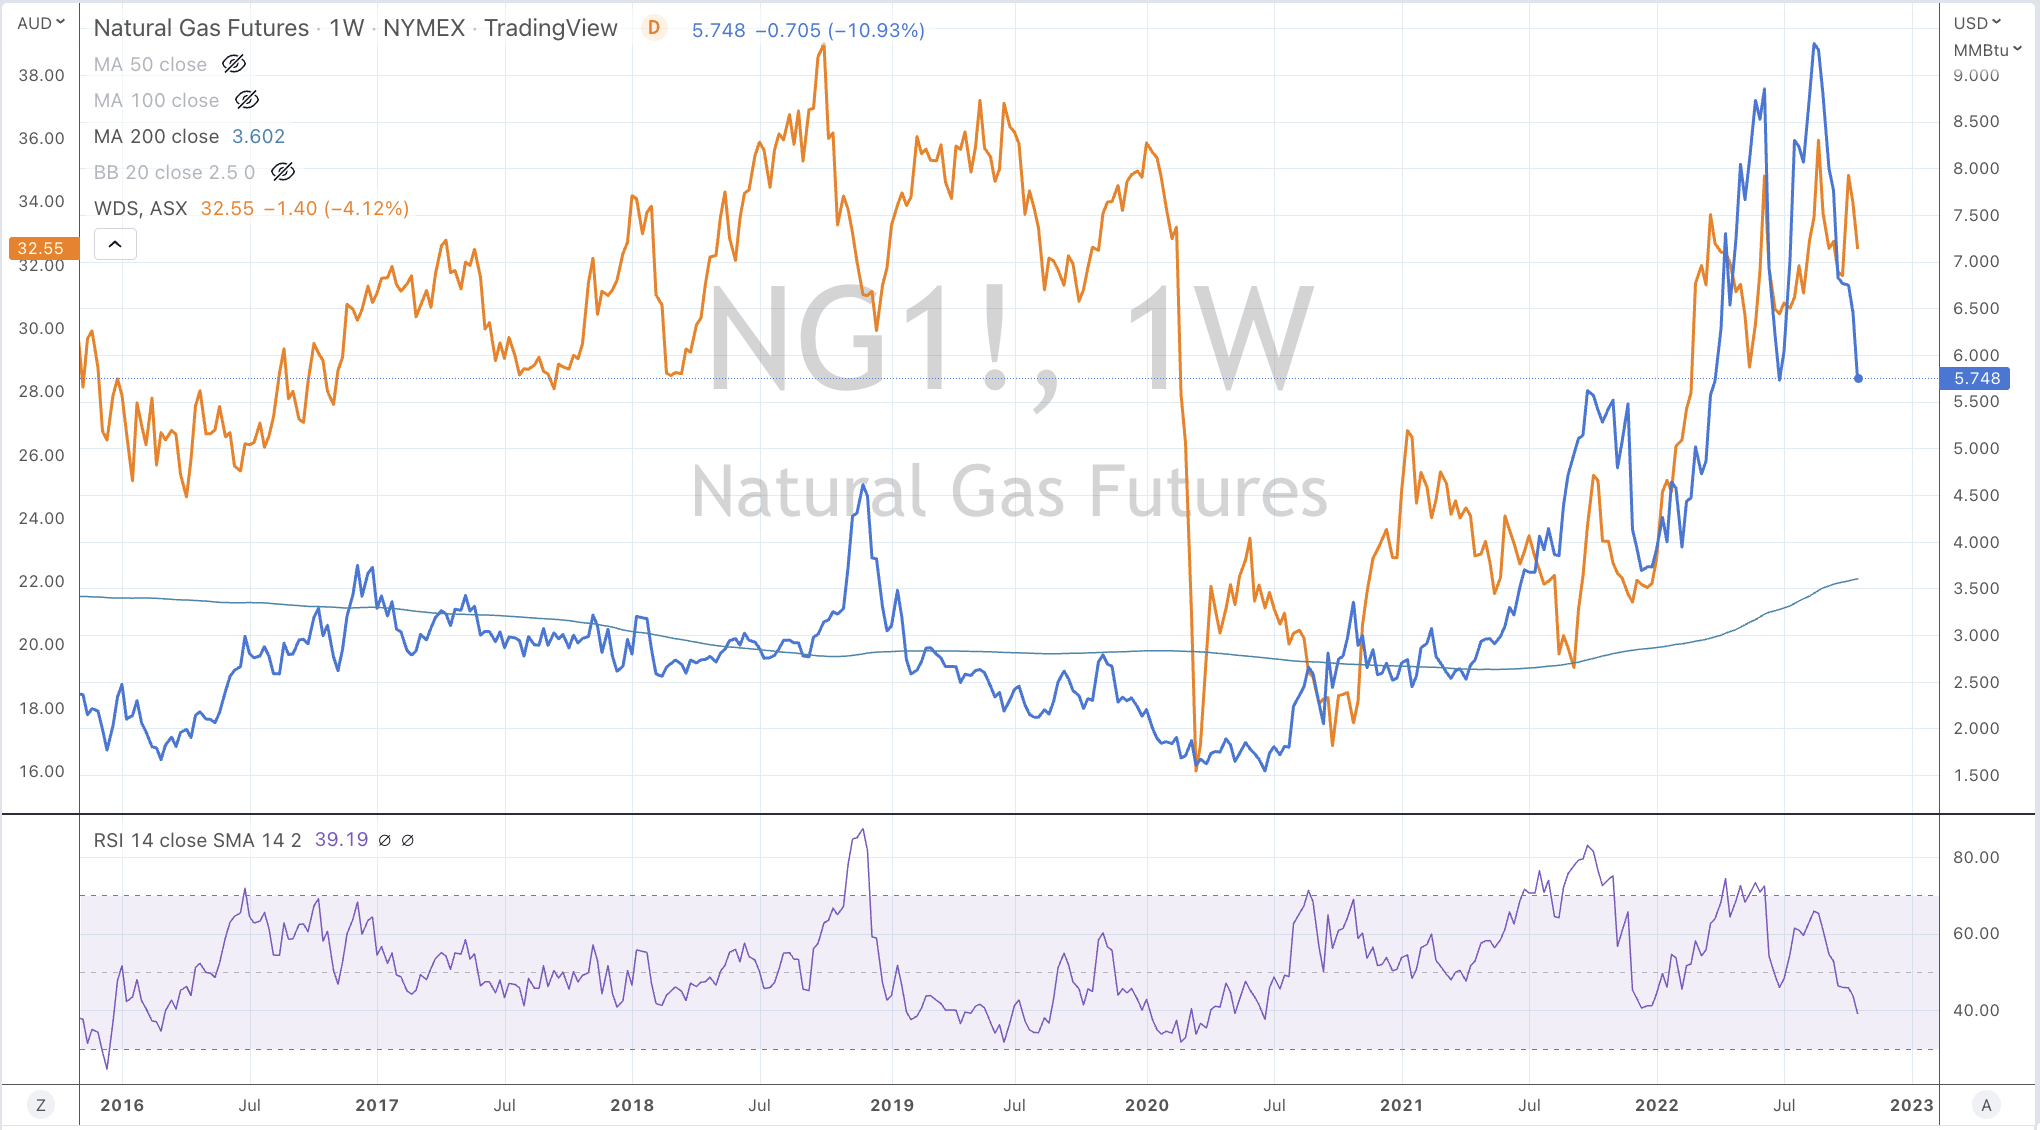
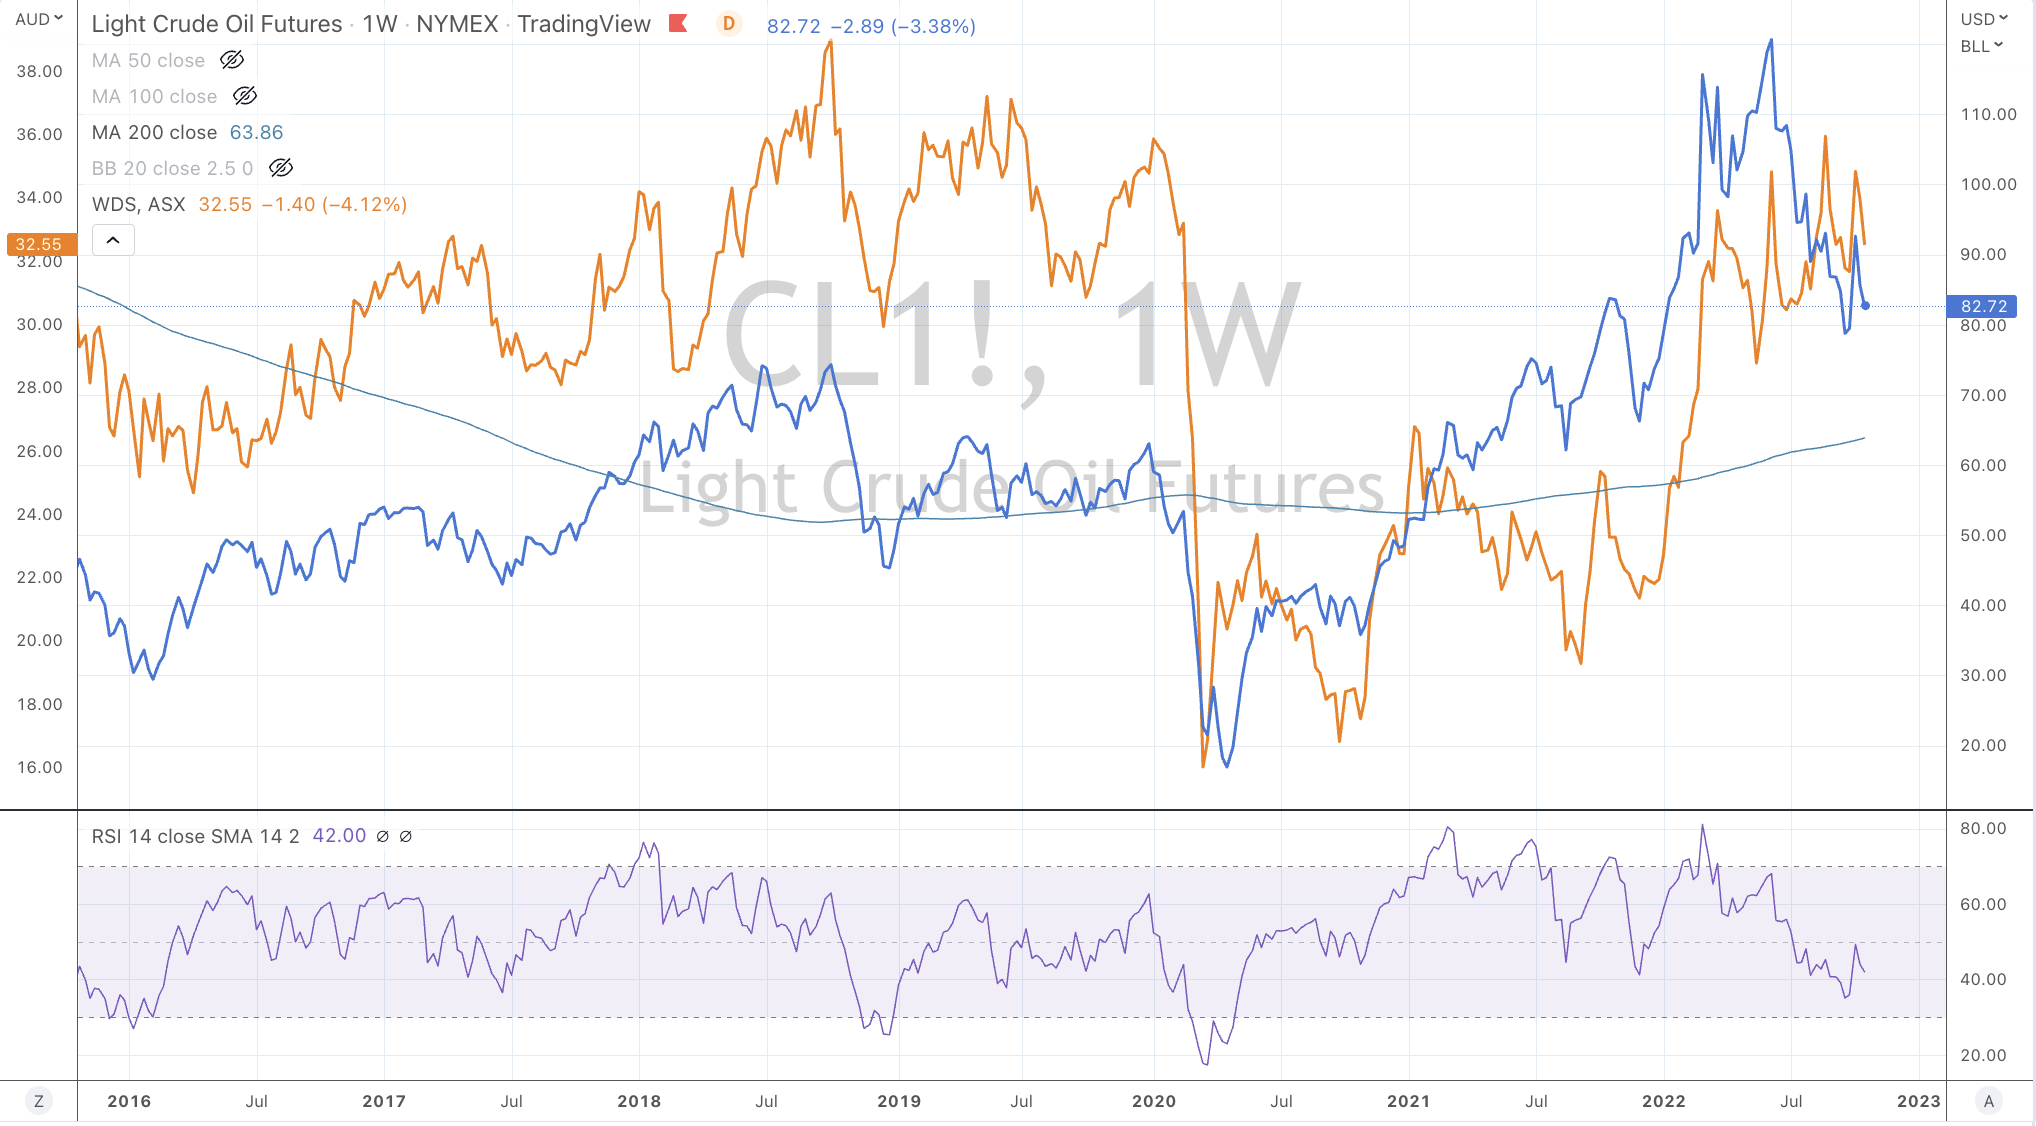
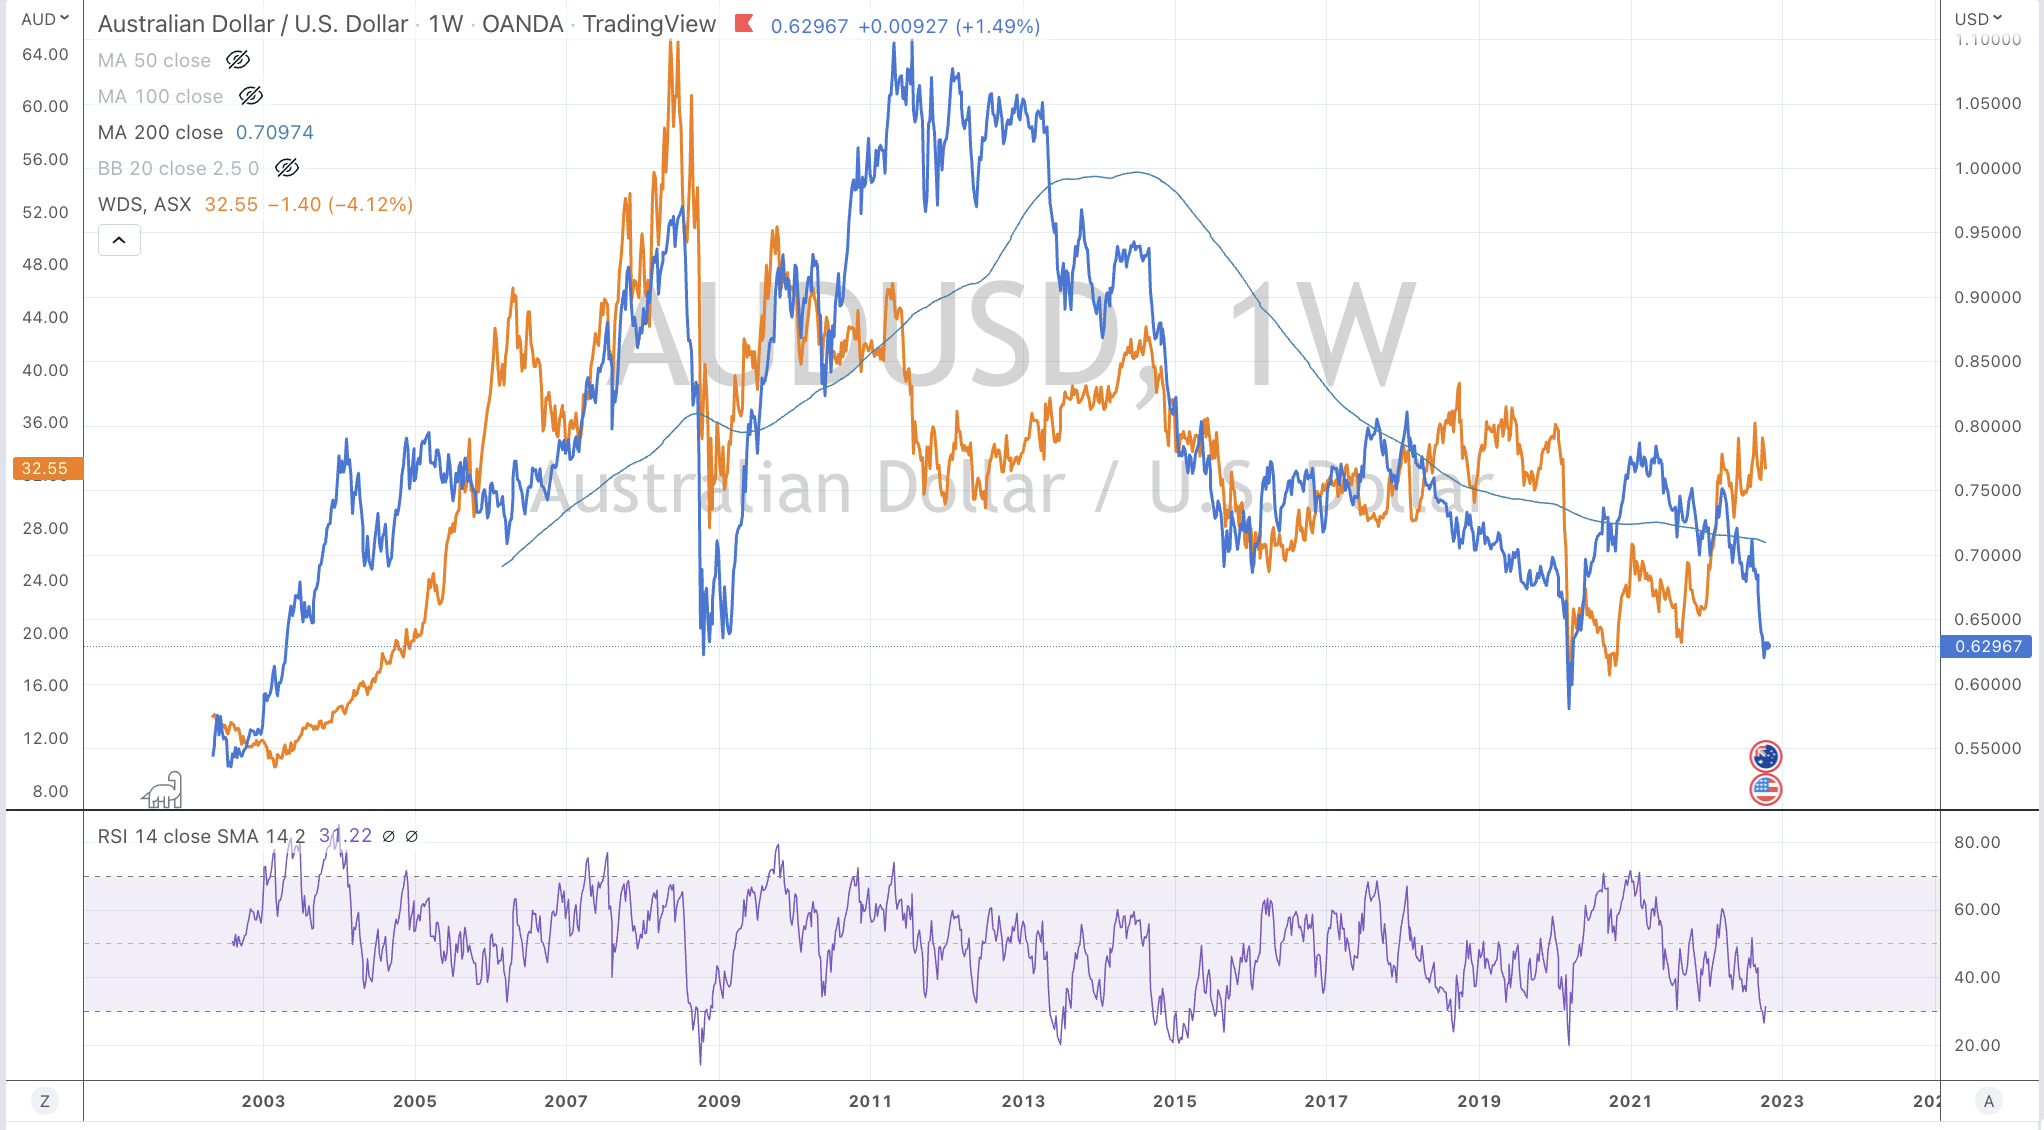
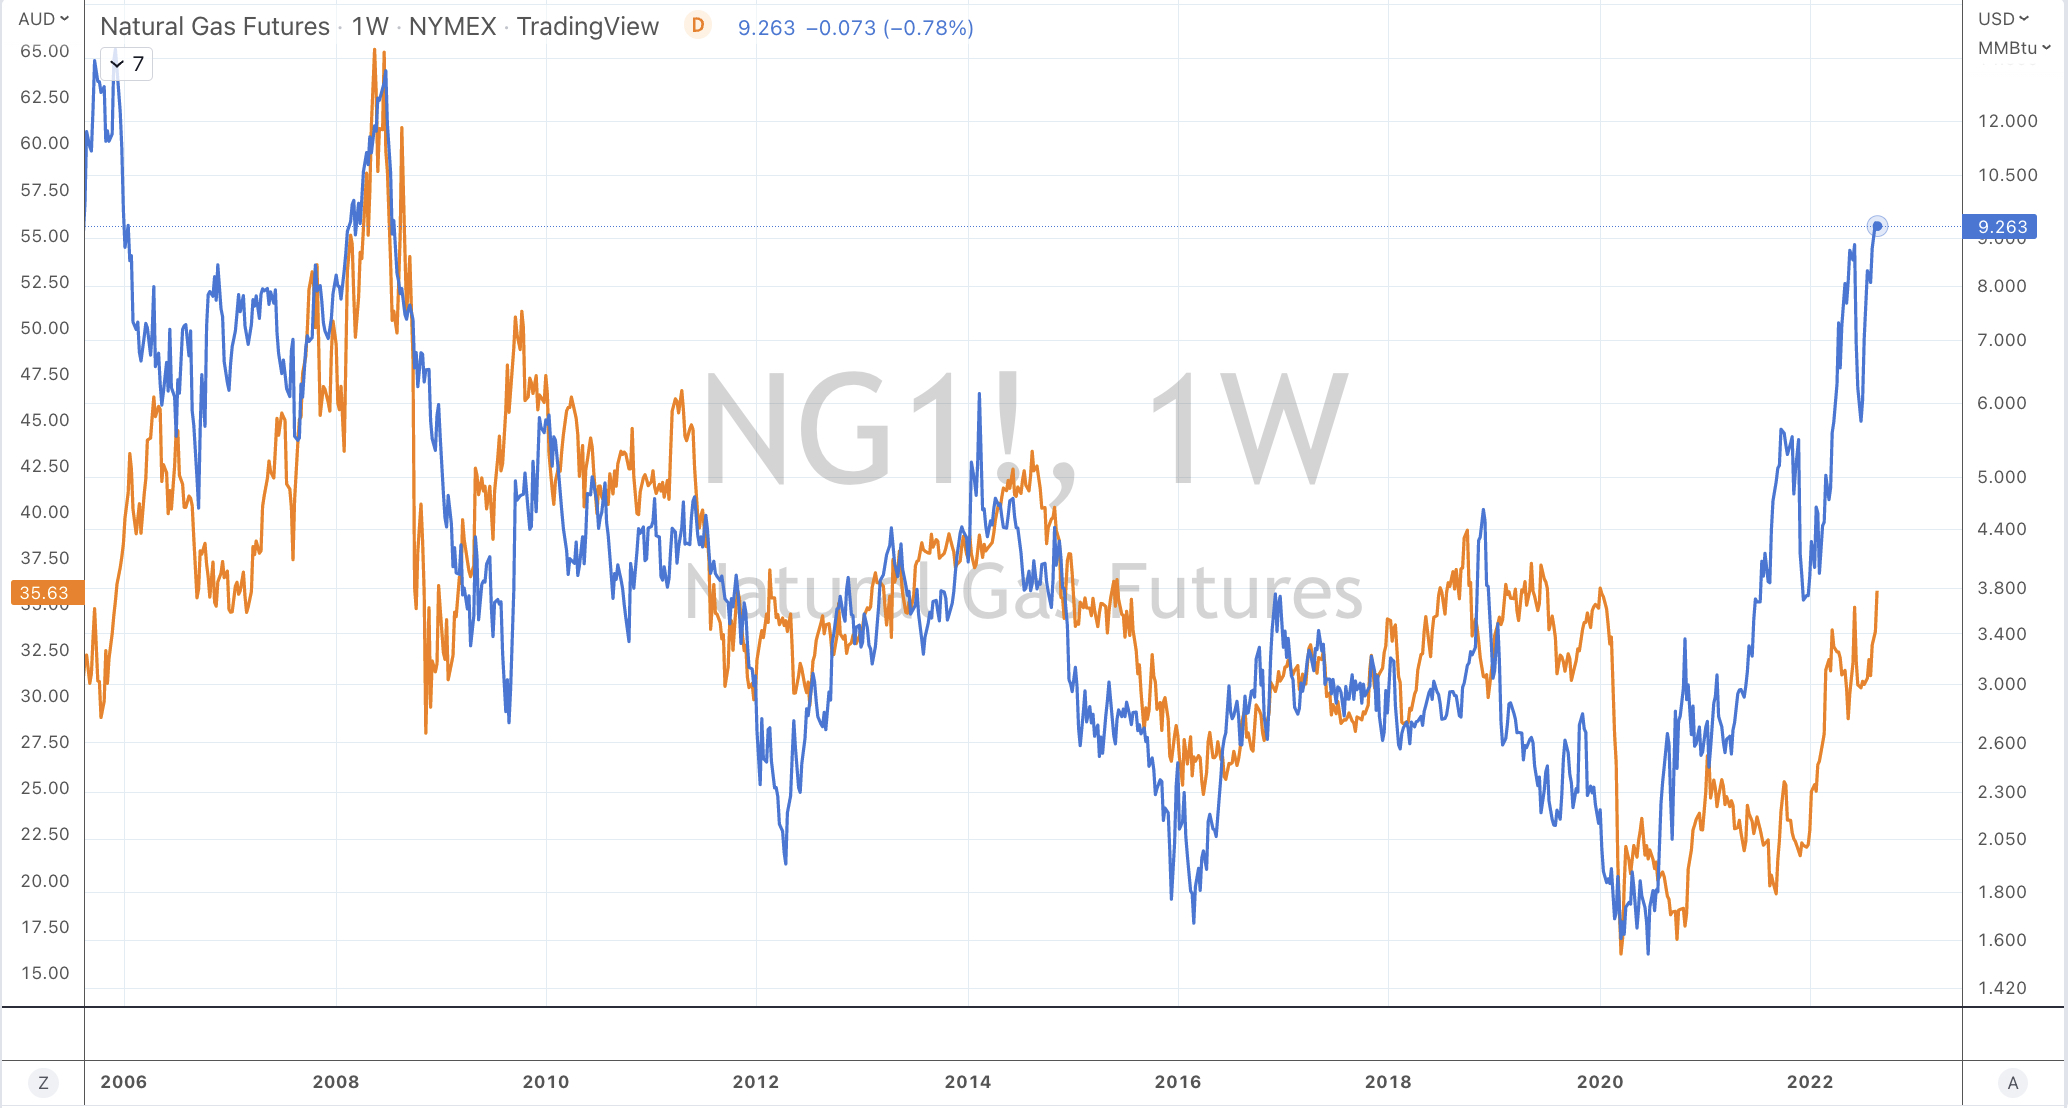
The next directional move in Woodside shares hinge on the direction in and or a combination of the Japan/Korea LNG Marker, the U.S. Natural Gas price, the West Texas Intermediate (WTI) Crude Oil prices along with the AUD/USD.
The charts below show the various correlations between Woodside shares and those assets.
My analysis of Woodside shares suggests that has a further 15% downside risk to $28, which is where I will be a buyer.
I may perform this exercise across other energy related equities.
JKM LNG Marker (in blue) versus WoodsideHenry Hub Natural Gas (in blue) versus WoodsideWTI Crude Oil (in blue) versus Woodside AUD/USD (in blue) versus Woodside
For those reading/watching my selected stock calls, if you’ve ‘squeezed out’ an extra 10% since I wrote this, Woodside Energy is close to the notable $30.85 resistance.
The Thomson Reuters (core commodity) CRB Index hits its highest level since November 2014.
Weightings are particularly heavy towards energy and agricultural contracts.
The CRB is a whisker away from the target mentioned in this story written a few days ago, while the AUDUSD has hit my target of 0.7135.
This is part of my call of a peak for broader commodity prices.
Just take a look around the prices of Oil, Gasoline, Heating Oil, Corn, Wheat, Coffee, Cattle, Oats etc etc.
Also, the price action in Crude Oil is suggesting the recent run is waning.
#meanreversion
In turn, I am not owning any related equities across Oil & Gas, Bulk producers of grains and even miners of raw industrial/base metals.
It’s as good as it’s going to get for in this current wave.
So, what else to do…..
Well, I’ll wait…..
then I’ll watch the stock prices of companies who buy these raw commodities such as Kellogg, Starbucks, Kraft Heinz, Nestle, Nucor or Nippon Steel, as their input costs will fall, thus improving their margins.
…….also, the unloved precious metals are worthy of some attention, while the AUD/USD isn’t acting very constructively.
To many, it might seem perverse to Buy USD (and sell your AUD 0.7130) but that is what the market is telling me.
I’m also seeing divergences in currency correlations.
Take a look at the chart below showing the AUDUSD laid over the CRB Index and then the other is the price of BHP over the same currency cross.
I believe currency before I believe the equity.
For extra kicks, I’ve thrown a chart showing the price of Woodside Energy mimicking the CRB Index.
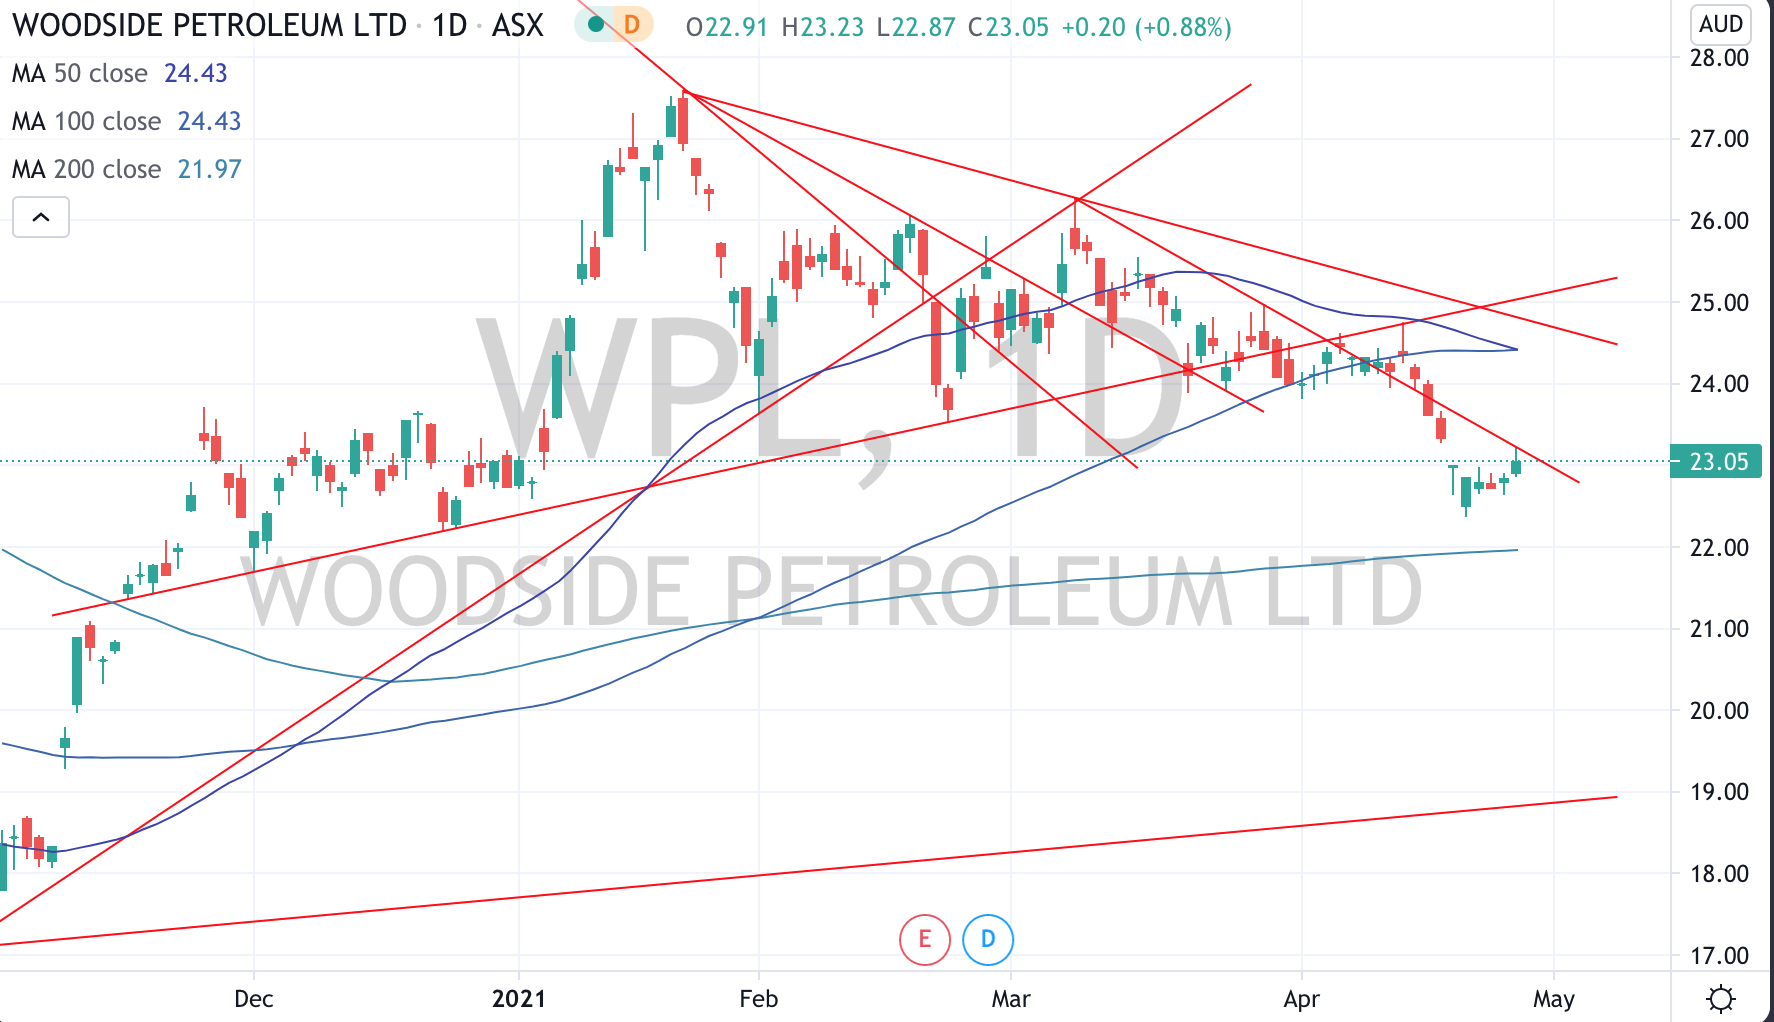
Here’s the current Woodside Energy (WPL.AX) technical picture.
You can see the trend lines squeezing into a triangle which bodes a break either way……
but to rise further, WPL needs to make a higher high (than the recent peak) and NOT make a lower low (than the recent trough)…….otherwise the price travels deeper into the triangle
I am seeing similar chart patterns mimicked in many global Oil & Gas equities.
Below is some commentary around Woodside Energy’s (WPL.AX) price action.
WPL’s failure to hold $24 wasn’t good although holding a $22.30 support deemed to be important. Today, the stock is challenging a downward sloping resistance line and needs to break and close above $23.35 in order to increase probability of a visit back to $24 and above. Failing to break $23.35 means the 50 day moving average crosses below its 100 day moving average and likely heralds in a new short term bear trend with a break below $22 suggests a visit to $19.
This all coincides with the acute point where Brent Crude is trading. Brent is edging towards a new bullish move and needs to trade above $67.50 to add to this case however a break below $64.50 negates such a move.