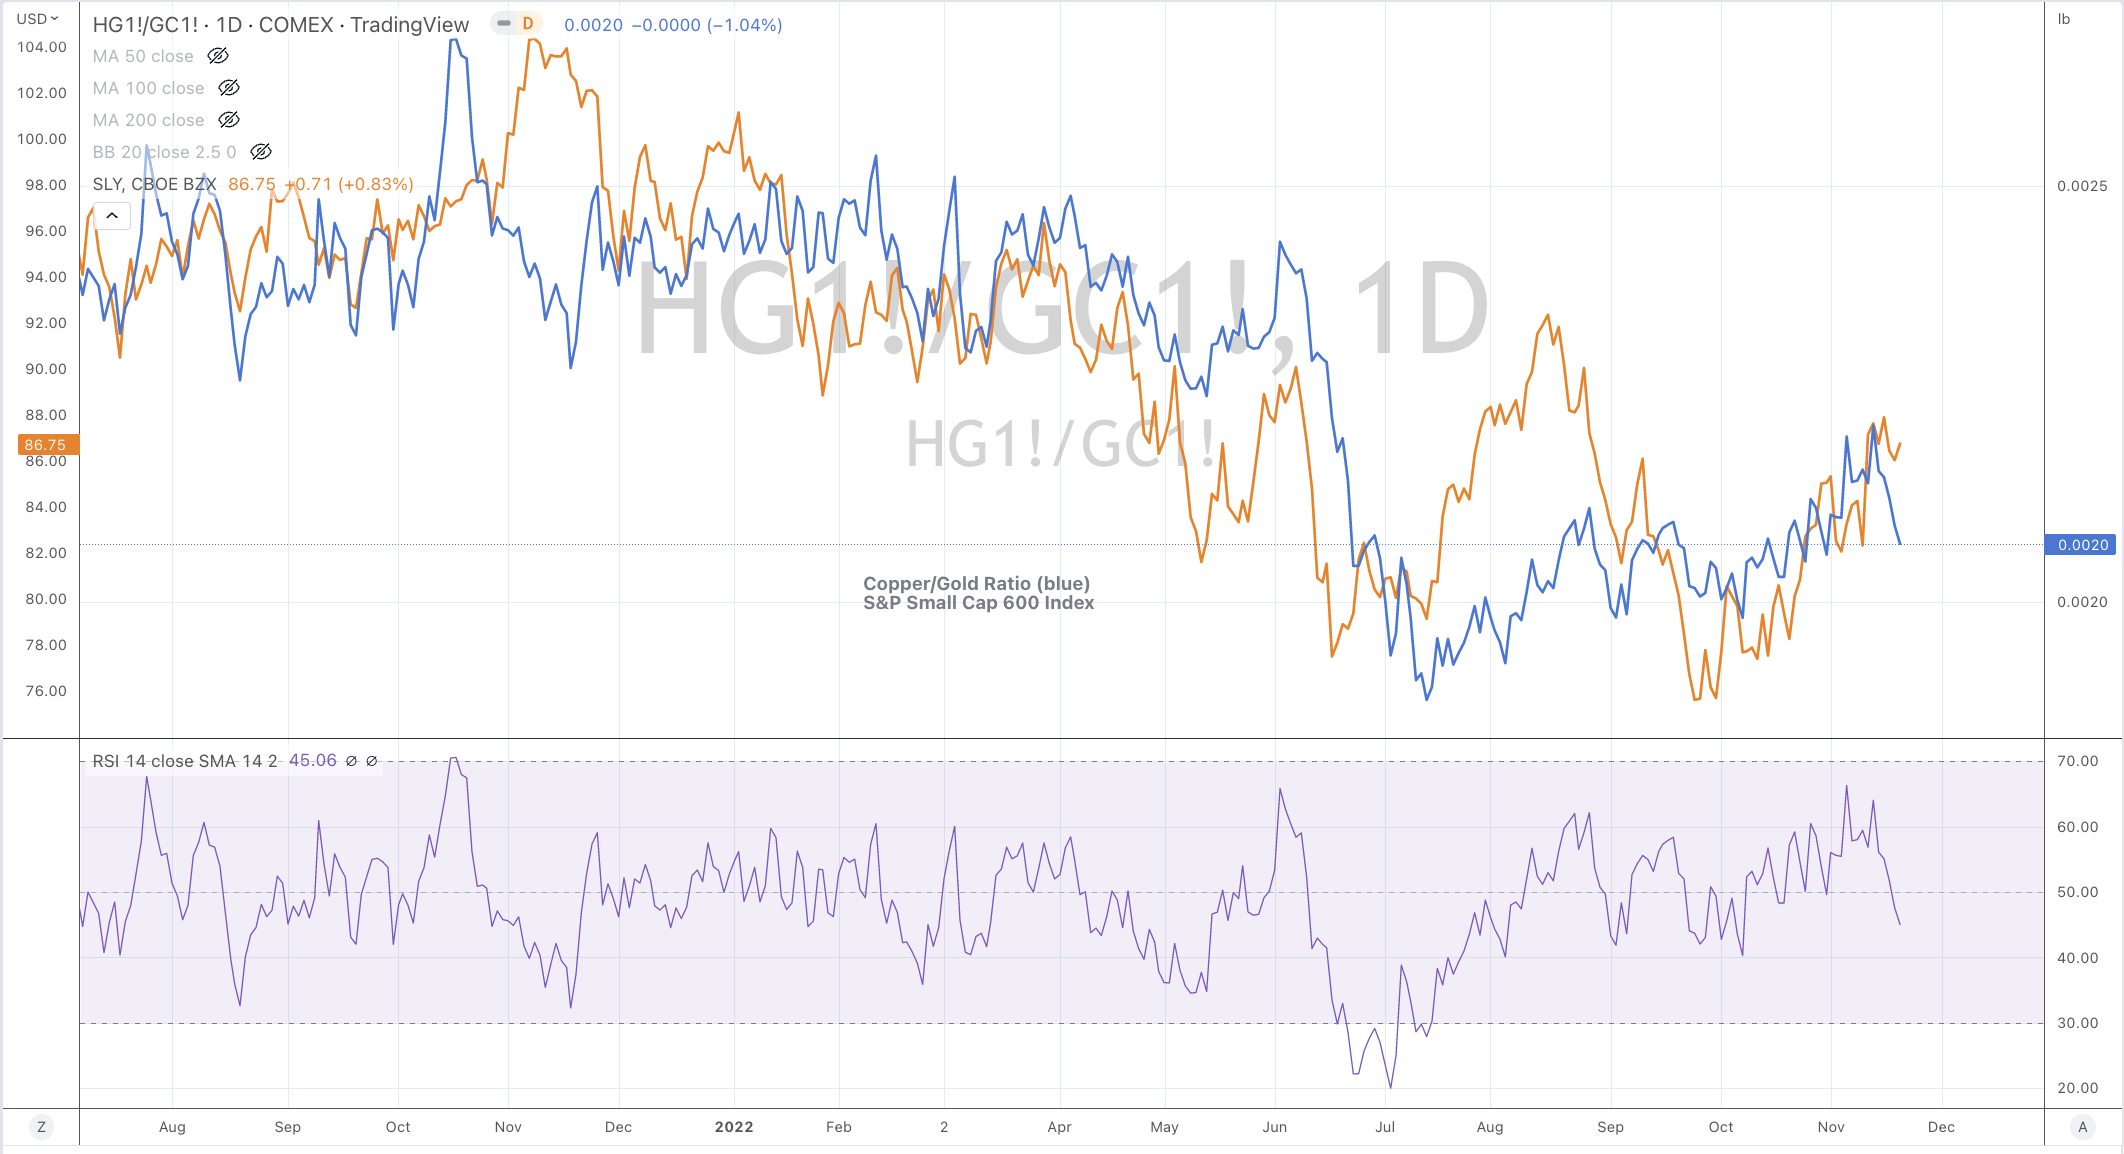
The Copper/Gold Ratio also correlates well with the S&P SmallCap 600 Index.
Currently, the small caps are trading within and through a range. While the setup for higher prices looks good (for traders), queueing off the Copper/Gold Ratio’s path may be helpful.
The more notable longer term buy signal in the small caps occurred in June 2022.
The S&P Small Cap 600 will need to trade 7% from Friday’s close to make a new ‘higher high’.
Bargain hunters awaiting a repeat or re-visit of that moment, will be tested with any extension of this rally.
The following assets (on a weekly timeframe) registered an Overbought or Oversold reading and/or have traded more than 2.5 standard deviations above or below its rolling mean.
Extremes “above” the Mean (at least 2.5 standard deviations)
Copper
Sugar
Nickel
Platinum
Silver in USD
Italy’s MIB Index
Overbought (RSI > 70)
Cattle
U.S. 2 year government bond yields
German 2 year government bond yields
The Overbought Quinella – Both Overbought and Traded at > 2.5 standard deviations above the weekly mean)
None
Extremes “below” the Mean (at least 2.5 standard deviations)
Chilean 10 year government bond yield
Oversold (RSI < 30)
Hot Rolled Coil Steel (HRC)
Coffee
The Oversold Quinella – Both Overbought and Traded at > 2.5 standard deviations above the weekly mean)
U.S. 5 year yield minus U.S. 3 month bill yield spread
Notes & Ideas:
It was a wonderfully quiet and sensible week for capital markets, particularly in equities.
Amongst equity markets, I could generally call it consolidation or digestion. We saw some small declines (the ASX 200 fell 0.1% for the week) although many indices (positively) made higher highs and no outside bearish reversal weeks were registered.
While I’m watching the DAX closing in on the Overbought region.
Copper isn’t overbought following this weeks 7% decline.
Although, a signal for the equity market to note the decline seen in the Copper/Gold Ratio and respect its correlation to the Small Cap Index. The latter played the function of leading, being the first to decline and the first trough.
Also worth keeping an eye on is the larger declines seen this week in the U.S. Banking and Transports Index.
Tin moved out of oversold territory with a stellar 20% rise for the week.
It was a benign week for the softs, although Cotton is corkscrewing towards making new lows while Coffee is now Oversold.
And the energy complex resumed the decline that I have been calling and aligned to.
Bond yields continue to fall, meaning bonds are being bid higher. In many cases, that moment to buy bonds at the extremes has passed and we are now in between the range.
For example, I have a medium term call that Australian 2 year bond yields come down to the 2.40% range. In the past 4 weeks, they have already firmed in from 3.72% to their current 3.17%. The Australian 10’s have moved from 4.30% to 3.64% in the same timeframe.
Months ago, I wrote about Chile (along with commodity sensitive Mexico and Brazil) leading the global ‘interest rate pack’ in addressing rising inflation.
Chile aggressively raised interest rates and now its 10 year bond yield is mean reverting.
The yield has fallen from 7.10% to 5.54% over the last 6 weeks.
The larger advancers over the past week comprised of;
Rotterdam Coal 9%, Cattle 1%, Tin 19.4%, Natural Gas 7.2%, Nickel 9%, Sugar 2.1%, Dutch TTF Gas 18%, Oats 2.4%, HSCEI 3.8%, Hang Seng 3.8% and Taiwan’s TAIEX rose 3.6%.
The group of decliners included;
Australian Coking Coal (5.6%), Aluminium (2%), Baltic Dry Index (12.3%), Cocoa (2.5%), WTI Crude Oil (10%), Gasoil (4.2%), Copper (7.2%), Copper/Gold Ratio (6.4%), JKM LNG (3.1%), Coffee (7.7%), Palladium (4.3%), Platinum (5.2%), Gasoline (7.2%), Silver (3.1%), CRB Index (3.3%), Cotton (5%), Brent Crude Oil (8.4%), Silver in AUD (3.5%), S&P GSCI (4.3%) KBW Banking Index (3.7%), DJ Transports (2.1%), Russell 2000 (1.8%), KOSPI (1.6%), Nasdaq Small Cap 700 (2.2%) and Brazil’s BOVESPA fell 3%.
But when the media announced that Warren Buffet’s Berkshire Hathaway had bought an approx $5 billion worth of stock equating to 1% of the company, somewhere during the proceeding quarter being between July 1st and Sept 30th, 2022……..
on Tuesday November 15, 2022, TSM stock (a $400 billion market cap company at that) opened 13% higher than its previous day’s close….
I’m puzzled why did people pay 30% more for a stock which they could have acquired below $62 during any 10 consecutive days only a week earlier?
The chart below shows the period which covered the 3rd fiscal quarter.
Maybe they did so because they either figured they’d be getting into the stock at some sort of similar average price that Berkshire Hathaway may have paid or more plausibly, they don’t need to bother doing any research or work behind the investment themselves because Mr Buffett’s team already did that work for them.
Perhaps the market assumes and concurs that now this company (and country) won’t be attacked or ‘muscled’ for the United States has another economic interest to protect.
When a sovereign wealth fund or something that resembles a similar description loses (writes down) $275 million in crypto related (FTX) investment, why doesn’t the investment team involved in that decision, CIO and perhaps all lose their jobs?
Maybe they should pay as much of it back from their personal funds?
Of course that wouldn’t happen, for no one will work for any investment fund along with a bunch of other sensible reasons and arguments, including they wouldn’t take any future risk at all.
But I want to ask why do we then laud them as extraordinary investors or exemplary stewards (irrespective if it’s public or government) money?
Partly, because their returns tend to be quite good and sheer size affords them better terms than the rest, which is an advantage that any of us would gladly accept.
Is it because they can hide behind the idea that it only accounts for 0.05% of their total assets under management?
Is it because of one’s size that allows you to produce better returns than many because a (potential asymmetric) bet of $275 million is only 2 days worth of return which is recoverable over one year.
And it’s only equal to 1 day worth of your average annual return spread it out over 2 years.
Can you imagine championing an investment which loses $275 million?
It just doesn’t seem to matter…..
it doesn’t matter if a Swiss wealth management firm posts a $4 billion loss yet people entrust them to manage their money, when they can’t manage their own company…..
nor does it matter when a investment bank blows $744 million backing a hedge fund called Archegos…..
or when an Australian bank is ordered to pay $1.3 billion in fines and the other is penalised $600 million over breaching anti-money laundering rules.
We just all accept this as OK……because none of the people involved own the business nor is it their money.
This chart of U.S. listed, Ciena Corporation is representative of many stocks that I watch.
Rather than ‘paint shapes’ about whether prices bounce or soar, I think a bunch of stock prices have a lot of digestion and consolidating ahead of them.
You can call them waves, perhaps draw some support or resistance lines or throw in some other technical indicators but for now, I’ll refer to it as ‘reading the tape’.
Broadly, prices continue to act unusually and much of the price action can be best described as scalping in between the prevailing range.
This study may be useful in conjunction with your other analyses.
Whenever bond prices exhibit medium to longer term overbought tendencies, it points to a reasonable moment when to increase your allocation to equities.
Now, is not that moment.
Other times, in between these moments, might be considered as ‘trading through the cycle’.