Ethereum trading call

Last Friday afternoon (June 25, 2021), I wrote this note to some clients trading Ethereum.

“ETH downtrend (on a daily basis) is intact and remains strong,
this is seconded with ETH entering a new weekly downtrend,

In the very short term (days), ETH is entering an acute technical squeeze,
it is trading at $1,952 as I write this,
a break above $2,150 increases probability of a visit to $2,620
a break below $1,860 suggest $1,730,
below that my ’scorched earth’ Buy is between $1,280 – $1,350 during the July 3rd-12th timeframe”

What happened next ?

……within 1 day, somewhere between Friday 4.30pm AEST and early Saturday evening, Ethereum dived 12% to a low of $1,715.

My note suggested a decline to $1,730. 
ETH found support at that level,
it has since bounced 22% from $1,730.
(ETH is currently $2,107 as I write this)

And so I direct you to the chart below,
it’s a ‘close-up’ of current price action,
so it’s relevant to reference the initial June 25 comments.

“a break above $2,150 increases probability of a visit to $2,620”

so…Long trade remains and the stop loss is at $2,020 (just below the new upward sloping trend line) thus protecting $1,730 long entry.

* not personal advice, just some storytelling, don’t sue me, seek advice or do your work*

June 30, 2021
by Rob Zdravevski
rob@karriasset.com.au

rypto

Keeping tabs on my Copper call

I was interviewed for this article (link below) on May 11th, 2021 in which I’m calling for a decline in the price of Copper.

Topically, Copper peaked a day earlier at $4.89.

Since that day, Copper’s price has fallen 14%.

https://www.spglobal.com/marketintelligence/en/news-insights/latest-news-headlines/experts-caution-on-copper-after-decarbonization-stimulus-driven-price-boost-64381465

On April 30th, 2021, the post link below highlights the consensus Long Copper trade.

https://www.linkedin.com/posts/robzdravevski_trap-reversion-overbought-activity-6793874441995726848-EXOm

My target price over then next few months is $3.43, which would coincide with a 50% retracement of the 15 month advance from March 2020,

but we’ll need to see if it holds the $4.04 level first.

June 29, 2021

by Rob Zdravevski

rob@karriasset.com.au

As goes Oil, so does the AUD

And as a follow up to the previous Brent Crude oil post,

the chart below may tell us what happens to the Australian Dollar compared to the U.S. Dollar…..

should Brent Crude decline

June 28, 2021

by Rob Zdravevski

rob@karriasset.com.au

Looking for interim peak in Crude Oil

Here’s a market call for you….Brent Crude is about to top out at the $78.50 level.

I’ve been bullish about the Oil price for the past year and remain so over the longer term, but parabolic advances also need a break and some consolidation.

My technical work suggests the crude oil price peaks soon and comes back to test the $64-$62 mark in the coming months.

See my 20+ year chart below. Amongst many extreme coincidences, we are also nearing a 50% move (between the 1999 low and the 2008 high) along with testing the underside of an ominous downward sloping trendline.

Anecdotally, many now are calling Oil to a $100…..and so I ask, where were they when Brent was $30 or $40….another moment of popular pundits making calls at the nutty end of a run which has seen Brent Crude Oil nearly quintuple from its $16 low in March 2020.

Ultimately, I think Oil goes to $120 – $140, in a massive ‘last’ hurrah…I’ll write more about that in a few months time.

For now, it’s time for the Oil price to shake a few people out and I love a good shakeout.

This also means having a think about your Oil & Gas equity positions.

In fact, many of them are already exhibiting weakness.

June 28, 2021

by Rob Zdravevski

rob@karriasset.com.au

Macro Extremes (week ending June 25, 2021)

The following assets (on a weekly timeframe) registered an Overbought reading or traded more than 2.5 standard deviations above its rolling mean.

Extremes “above” the Mean (at least 2.5 standard deviations)

Live Cattle

Natural Gas

Overbought (RSI > 70)

Tin (for the 9th week)

Gasoil

Heating Oil

WTI Crude Oil

Brent Crude Oil

Iron Ore

Hot Rolled Coil Steel

the CRB (commodities) index

France’s CAC-40 equity index (for the 11th consecutive week)

Korea’s KOSPI equity index

Switzerland’s SMI equity index (for the 2nd week)

and the Oslo and Helsinki equity indices.


The Overbought Quinella – Both Overbought and Traded at > 2.5 standard deviations above the weekly mean)

U.S. 2 Year Treasury Note yield

Assets (securities) within my immediate universe which touched the other side of the extreme, being Oversold (where the RSI is < 30) or were at least 2.5 standard deviations below its mean are;

Extremes “below” the Mean (at least 2.5 standard deviations)

Chinese 10 Year Government Bond Yields

Platinum

AUD/USD (for the 2nd consecutive week)

NZD/USD 

Nikkei 225 equity index

Oversold (RSI < 30)

Nil

The Oversold Quinella – Both Oversold and Traded at < 2.5 standard deviations above the weekly mean)

Nil

Notes & Ideas:

The list of extreme readings continues to diminish as trend change direction and mean reversions take place.

It’s time time prepare for the extremes seen, most likely at the other end of the recent ranges.

Again….the larger price moves in global markets were seen in the commodity markets.

For the week…..

Lumber (8%)

Wheat (4%)

Leans Hogs fell 6%, following on from last week’s 11% decline.

Corn (8%)

Coffee + 4%

Platinum + 6%

Oil +4%

Russell 2000 and Midcap 400 (U.S.) equity indices rose 4%

and the ASX 200’s 1% decline for the week sees it move below (and out of) overbought territory.

The U.S. 10 year bond yield it yet to break above 1.75%, although Yields rose to 1.53%, up from last week’s 1.44%. This is the thing to watch. Hell may break loose if the 10’s break above 1.65%.


The Baltic Dry (shipping) index consolidated the 29% rise seen over the past weeks with a meandering 1% effort this week. 

Cryptocurrencies has a negative week across the board.

During the week, Bitcoin fell 6%, Ethereum tanked 17% (compounding the previous week’s11% swoon), Litecoin slumped 17% (adding to last week’s 9% drop) and Ripple declined 20%, amplifying last week’s 12% slump.

Incidentally, no cryptocurrencies are Oversold yet.

And lastly, Bitcoin is trading 149% above its 200 Week Moving Average, which is lower from last week’s 158% reading and certainly lower when compared to its 466% peak in mid-April 2021.

June 27, 2021

by Rob Zdravevski

rob@karriasset.com.au

2nd chance to buy Hot Rolled Coil Steel

Don’t you wish your next BBQ investing ‘tip’ was to buy Hot Rolled Coil Steel futures ??

Check out the parabolic price move in Hot Rolled Coil (HRC) Steel.

Prices have quadrupled since August 2020.

That’s more than Bitcoin, shares in Tesla & Afterpay and definitely more than Sydney real estate.

At these extremes, coupled with a bunch of other metrics and observations, I’m looking a pullback in the price to the $1,080 – $1,210 mark, which is an approx. 30% decline from its current $1,658.

The elevated price of HRC is a little different and more so deserved when compared to my past parabolic commentary in Corn, Soybeans, Tesla, Bitcoin, Lumber or Copper which involves replenishing supply, diminishing re-investment, overvaluation or a mania…..

as HRC is a ‘worked’ product resulting inputs and manufacture but is also a beneficiary of strong demand, tightening supply and capacity constraints.

Should HRC decline, I’ll watch for investing opportunities in the shares of companies such as Angang Steel, Bluescope Steel, Arcelor Mittal and U.S. Steel.

June 23, 2021

by Rob Zdravevski

rob@karriasset.com.au

Calling the Bitcoin retracement

Yesterday, I provided crypto trading clients with some technical advice about how I see the price action in Bitcoin.

Referencing the dates in each chart (image) below, you will see my comments about ‘heightening buying interest at $29,300’ in the larger June 22 edition.

The close-up chart shows that overnight, Bitcoin traded to a low of US$29,247 and then bounced 11%, back to US$32,600.

For now, I’m happy with that call.

June 23, 2021
by Rob Zdravevski
rob@karriasset.com.au

What the 10’s-2’s spread may tell us

My story about watching interest rates spreads and how the S&P 500 equity index may act.

June 22, 2021
by Rob Zdravevski
rob@karriasset.com.au

Interest Rate Watch

I was watching whether the U.S. 10 year government bond yield broke above 1.75%……I am now revising this…the number is now 1.62%.

It’s currently trading at 1.49%.

If it breaks and closes ‘solidly’ above 1.62%…..’all hell could break loose’.

The charts below show a 30 year trend line and a close-up of the current timeframe.

Well, more plausibly, the S&P 500 suffers corrections and trades sideways for ~ 18 months (as written in my March 2021 newsletter below).

https://mailchi.mp/karriasset/quadrupling-yields-increases-equities-risk-2

The accompanying metric to watch is the spread between the 10 and 2 year yield. Today, that differential is 1.24%.

If that shoots higher (past 1.45%, then 1.65% and up to 2.00%) then the S&P 500 will experience a more meaningful downdraft.

Keep in mind that the S&P 500 is still trading at 38% above its 200 week moving average, which is at the upper end of its historical range.

Mean reversion of the index is not a preposterous suggestion.

but the real message is that passive index (ETF) investing should work out to be a poor strategy.

In fact, the S&P 500 may be little changed over the next 2 years.

For example, what if the (six) FAANGM stocks underperform, decline of travel sideways ? After all, these 6 stocks make up 23% of the S&P 500’s market capitalisation.

My focus is to find specific company stocks (globally) offering an attractive risk/reward equation which will benefit from strong demand, tightening supply, reasonable market share perhaps giving them improving pricing power in an industry which may have capacity constraints.

June 22, 2021

by Rob Zdravevski

rob@karriasset.com.au

Macro Extremes (week ending June 18, 2021)

The following assets (on a weekly timeframe) registered an Overbought reading or traded more than 2.5 standard deviations above its rolling mean.

Extremes “above” the Mean (at least 2.5 standard deviations)

Natural Gas

Live Cattle

India’s Nifty 50 equity index

Chinese 10 year bond yields

Overbought (RSI > 70)

Tin (for the 8th week)

Gasoil

Heating Oil

WTI Crude Oil

Brent Crude Oil

France’s CAC-40 equity index (for the 10th consecutive week)

Korea’s KOSPI Index

and Australia’s ASX 200 (in its 3rd week and at its most weekly overbought since late July 2019)


The Overbought Quinella – Both Overbought and Traded at > 2.5 standard deviations above the weekly mean)

Switzerland’s SMI equity index

Assets (securities) within my immediate universe which touched the other side of the extreme, being Oversold (where the RSI is < 30) or were at least 2.5 standard deviations below its mean are;

Extremes “below” the Mean (at least 2.5 standard deviations)

Japanese 10 Year Government Bond Yields (the granddaddy of risk indicators)

Soybeans

AUD/USD

NZD/USD 

Oversold (RSI < 30)

Nil

The Oversold Quinella – Both Oversold and Traded at < 2.5 standard deviations above the weekly mean)

Nil

Notes & Ideas:

A diminishing list of extreme readings continues as trend change direction and mean reversions take place.

The massive moves in global markets over the past week were seen in the commodity markets.

After weeks of overbought extremes (which is what I write about in this weekly missive), e saw the following declines;

Iron Ore (5%)

Gold (6%)

Leans Hogs fell 11% and broke a 16 week ‘extreme’ streak

Copper (8%)

Coffee (5%)

Lumber (20%)

Platinum (10%)

Sugar (6%)

Silver (8%)

the CRB Commodity index (3%)

Corn (8%)

Soybean (11%)

Other overbought extreme streak-makers included;

the KBW Banking Index fell 8% (I now see buying opportunities in selected U.S. banking stocks),

the Dow Jones Industrial Index (3.5%)

DJ Transports Index (4.6%)

the Russell 2000 (4%) and

the MidCap 400 (5%)

There is merit in referencing past weekly editions of ‘Macro Extremes’ to check the assets which were ‘peaking’ before the current mean reversion has commenced.

We also saw strength in the U.S. Dollar (against consensus thinking) with 3% declines for the week seen in the AUD and CAD against the greenback.

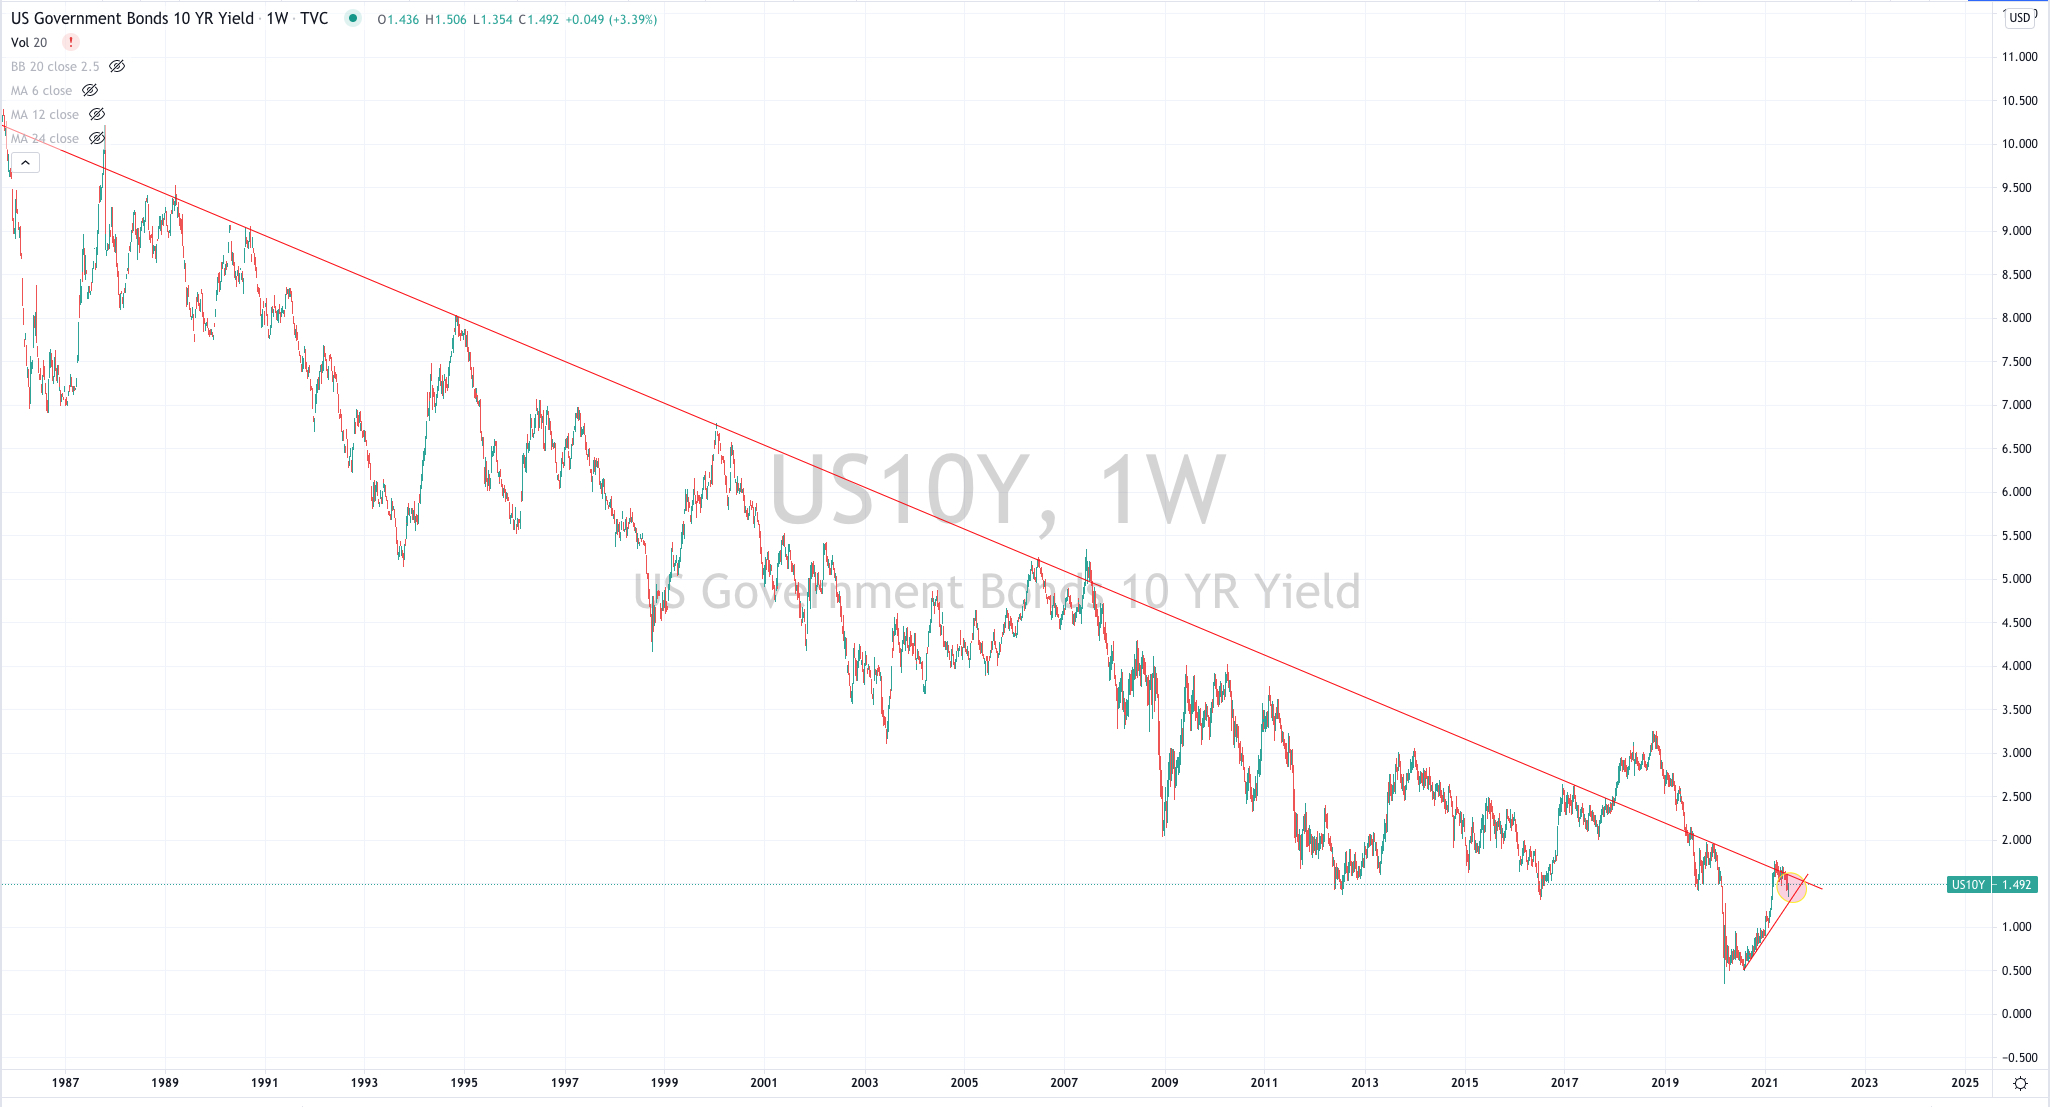
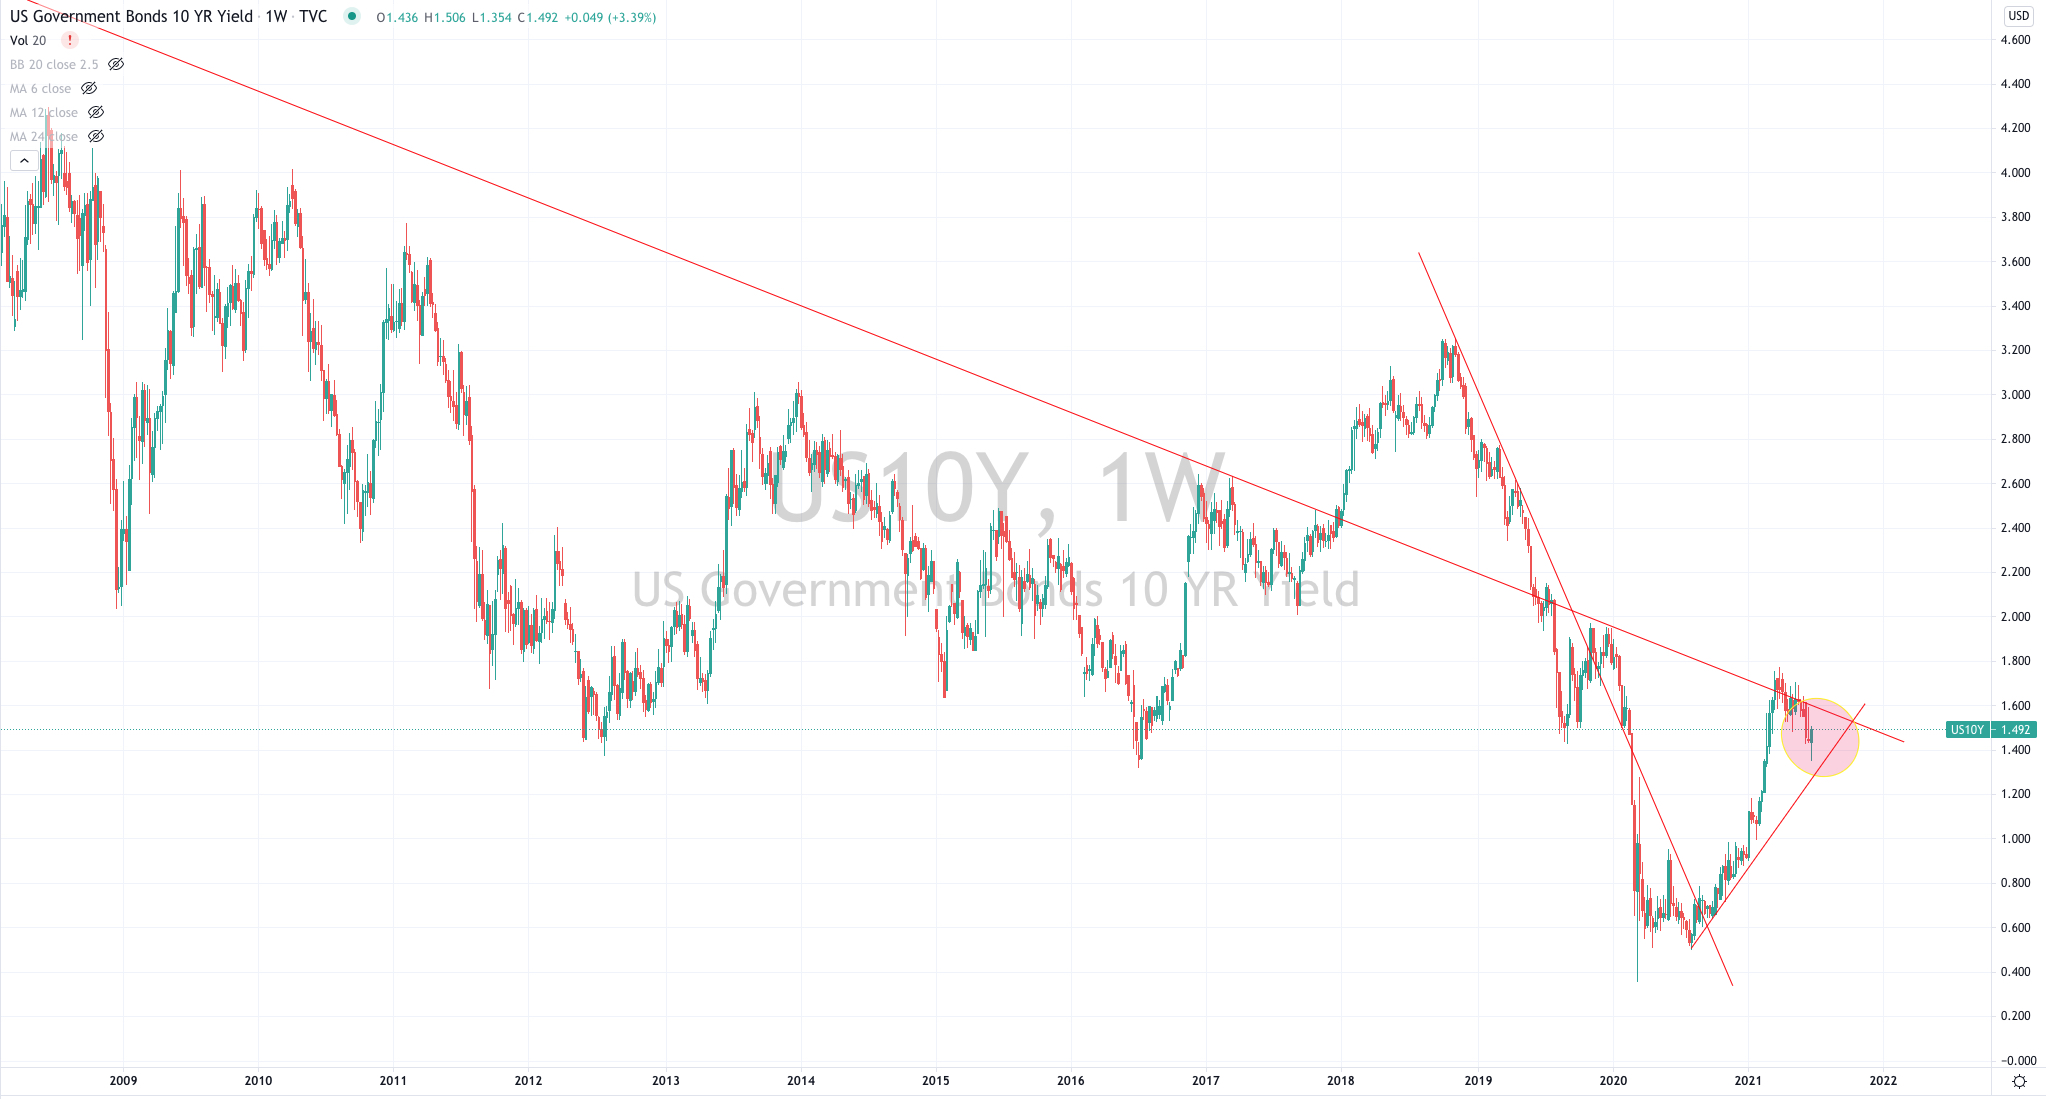
The U.S. 10 year bond yield it yet to break above 1.75%. Yields eased further this past week from last weeks 1.46% to close at 1.44%.


Other notable moves included the Baltic Dry (shipping) index  climbed a further 12% following last week’s 17% advance.

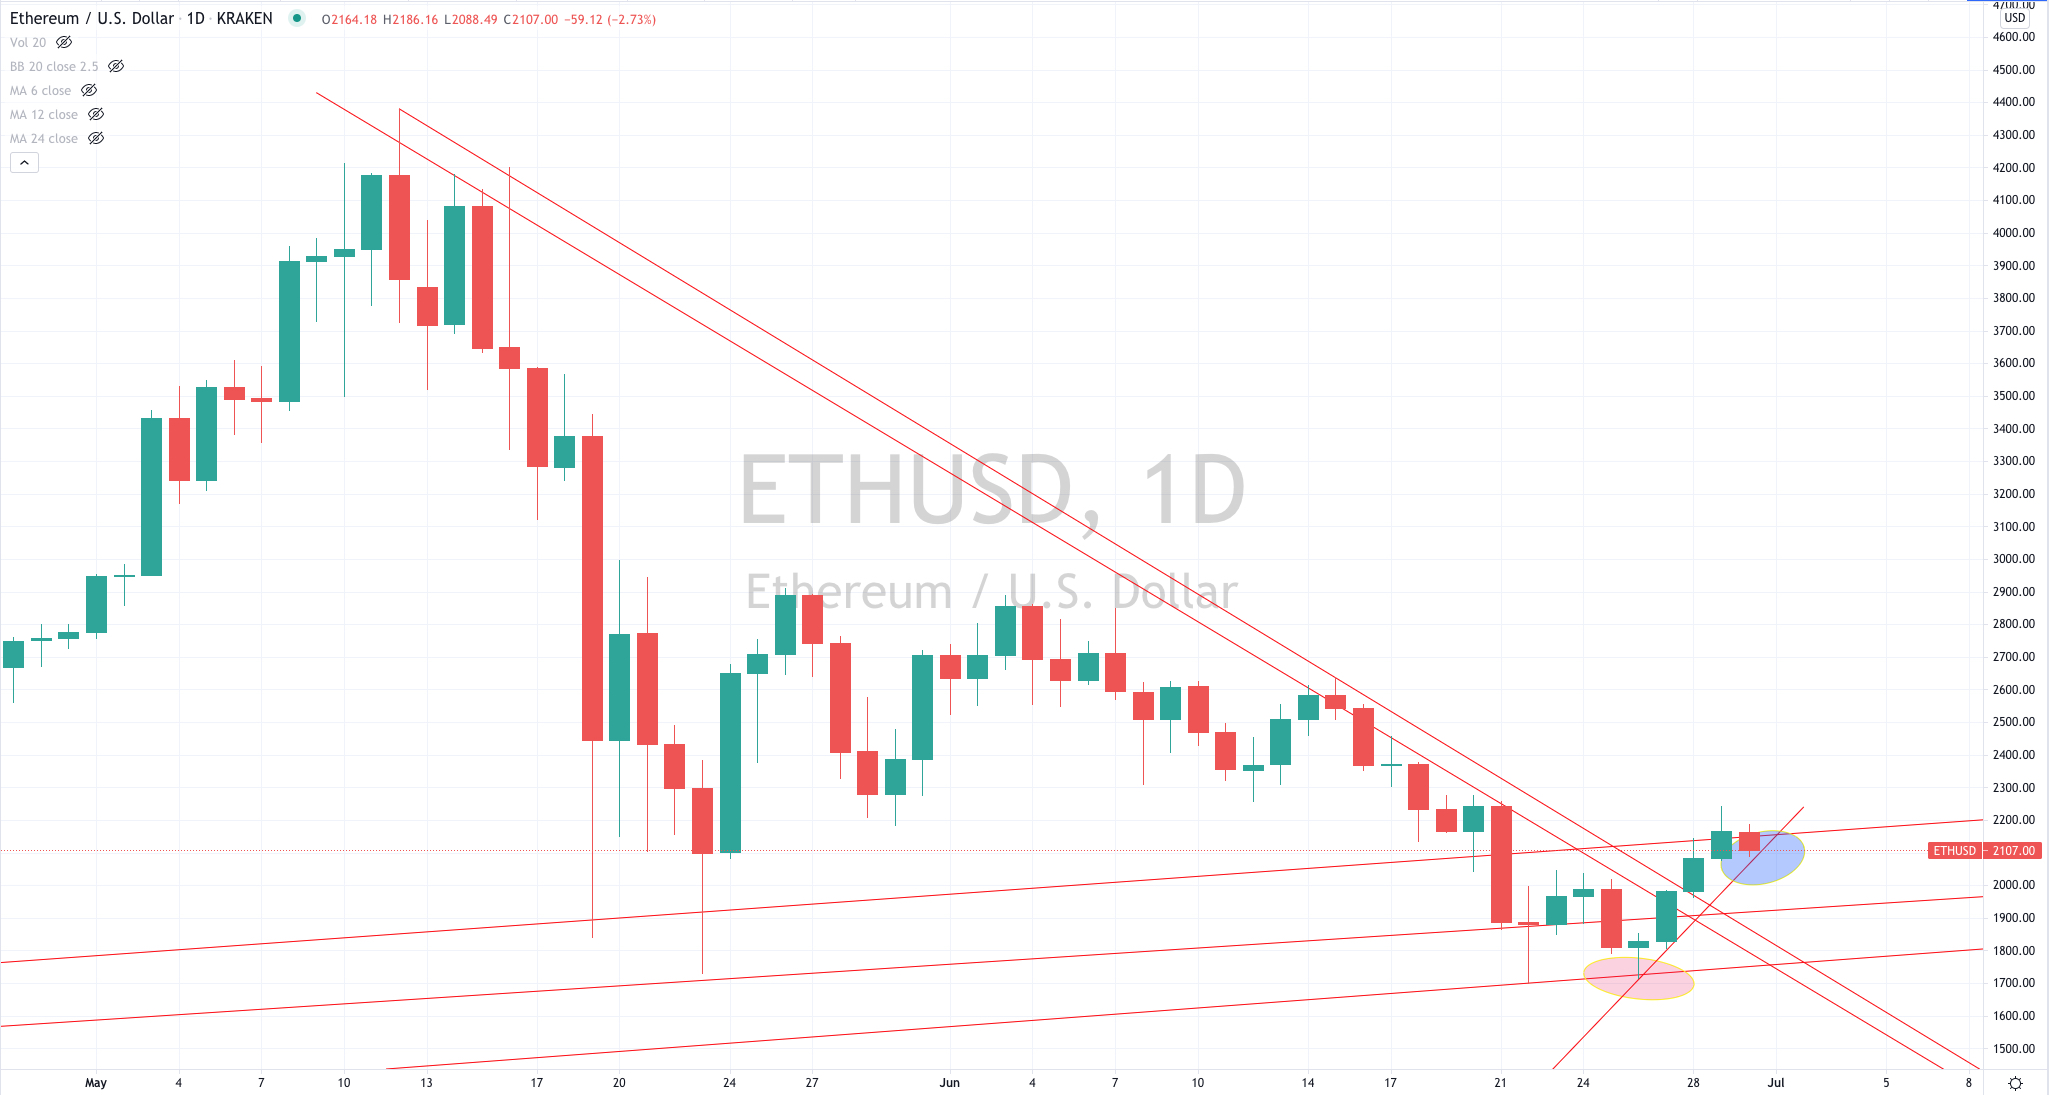
Cryptocurrencies has a negative week across the board (and especially during today’s Sunday session).

During the week, Bitcoin fell 14%, Ethereum tanked 18%, Litecoin slumped 15% and Ripple declined 20%.

Incidentally, no cryptocurrencies are Oversold yet.

And lastly, Bitcoin had a benign week. It is trading 158% above its 200 Week Moving Average, which is lower from last week’s 172% reading and certainly lower when compared to its 466% peak in mid-April 2021.

June 20, 2021

by Rob Zdravevski

rob@karriasset.com.au