Interest Rate Watch
June 22, 2021 Leave a comment
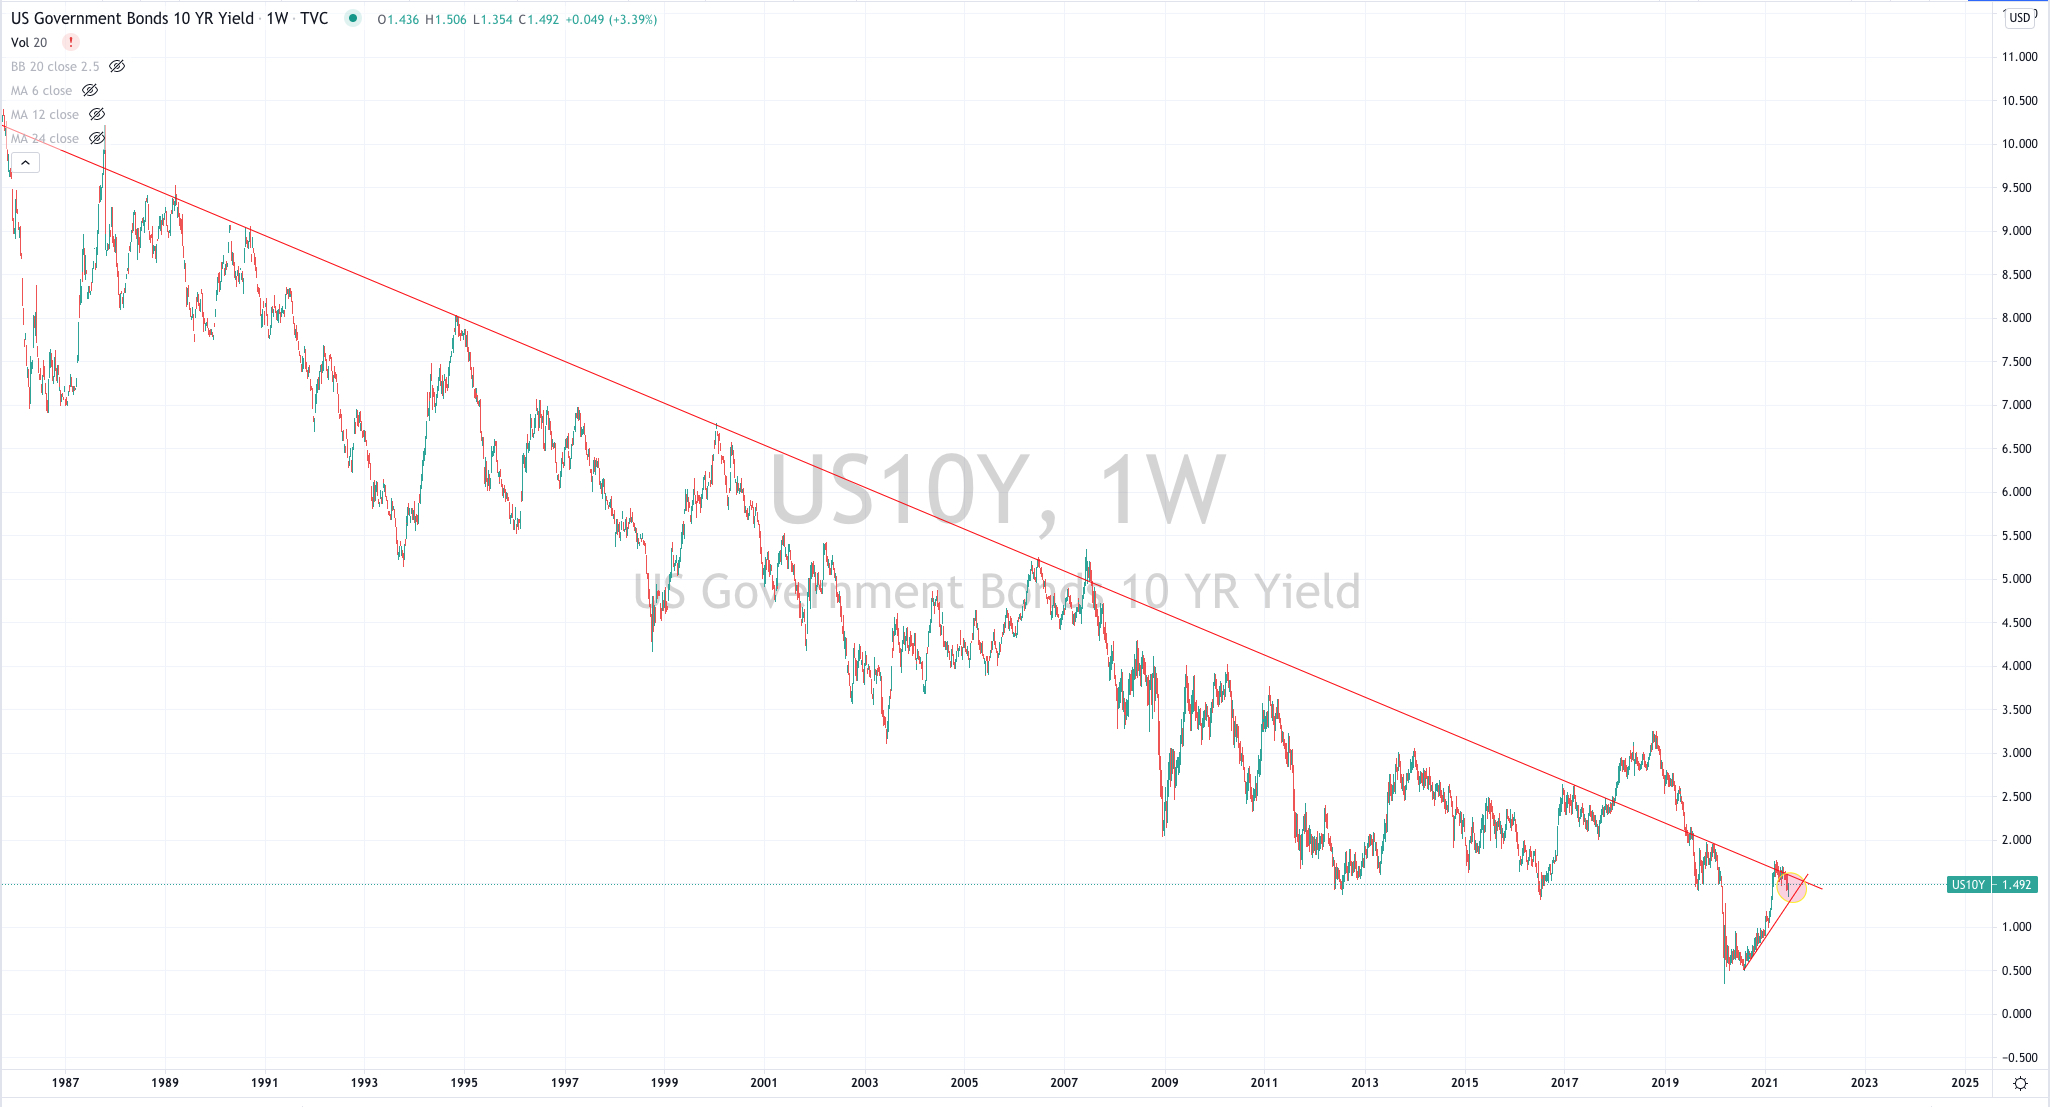
I was watching whether the U.S. 10 year government bond yield broke above 1.75%……I am now revising this…the number is now 1.62%.
It’s currently trading at 1.49%.
If it breaks and closes ‘solidly’ above 1.62%…..’all hell could break loose’.
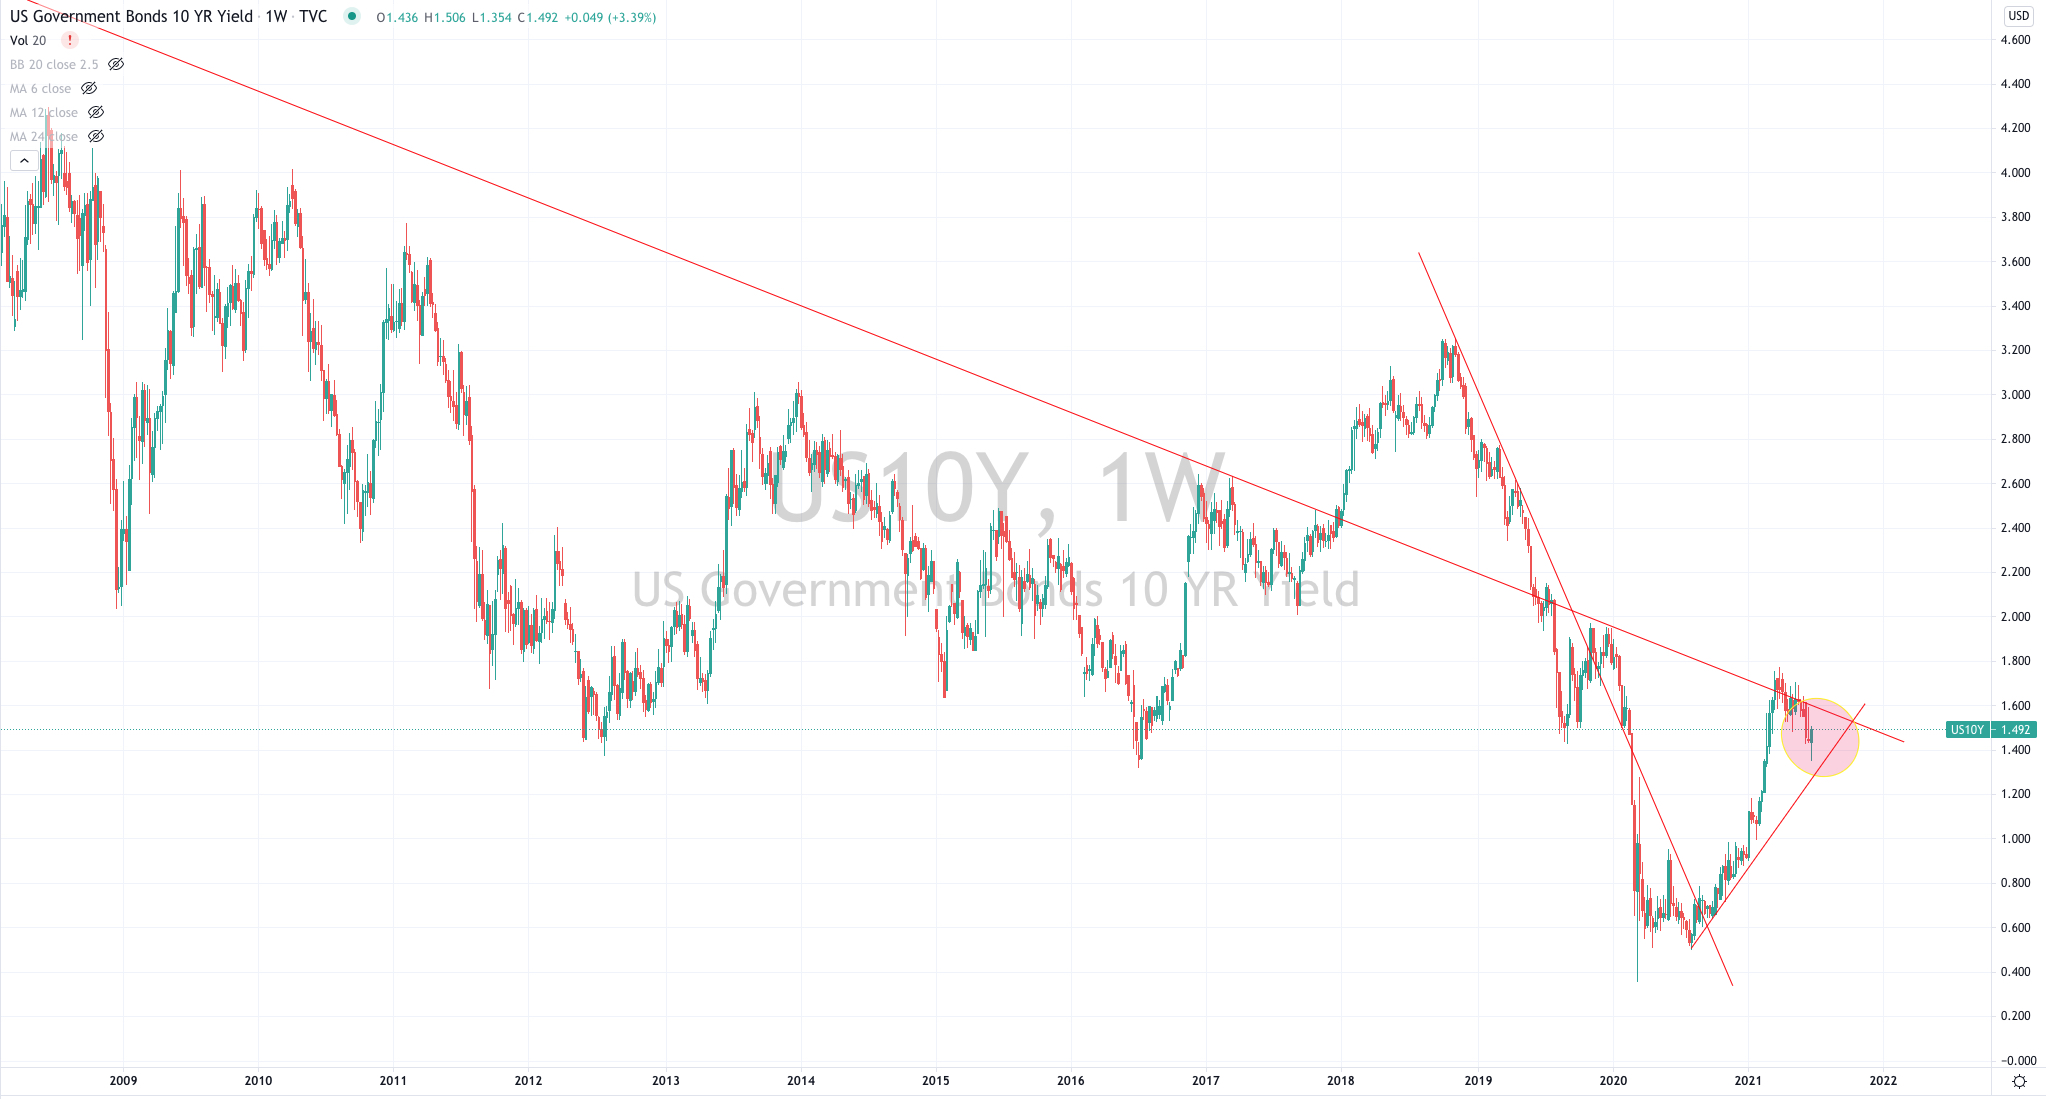
The charts below show a 30 year trend line and a close-up of the current timeframe.
Well, more plausibly, the S&P 500 suffers corrections and trades sideways for ~ 18 months (as written in my March 2021 newsletter below).
https://mailchi.mp/karriasset/quadrupling-yields-increases-equities-risk-2
The accompanying metric to watch is the spread between the 10 and 2 year yield. Today, that differential is 1.24%.
If that shoots higher (past 1.45%, then 1.65% and up to 2.00%) then the S&P 500 will experience a more meaningful downdraft.
Keep in mind that the S&P 500 is still trading at 38% above its 200 week moving average, which is at the upper end of its historical range.
Mean reversion of the index is not a preposterous suggestion.
but the real message is that passive index (ETF) investing should work out to be a poor strategy.
In fact, the S&P 500 may be little changed over the next 2 years.
For example, what if the (six) FAANGM stocks underperform, decline of travel sideways ? After all, these 6 stocks make up 23% of the S&P 500’s market capitalisation.
My focus is to find specific company stocks (globally) offering an attractive risk/reward equation which will benefit from strong demand, tightening supply, reasonable market share perhaps giving them improving pricing power in an industry which may have capacity constraints.
June 22, 2021
by Rob Zdravevski
rob@karriasset.com.au