The following assets (on a weekly timeframe) registered an Overbought reading or traded more than 2.5 standard deviations above its rolling mean.
Extremes “above” the Mean (at least 2.5 standard deviations)
USD/KRW (signifying a weaker Korean Won)
USD/SGD (sell your USD and Buy Singapore Dollars)
EUR/AUD (telling me the Euro is strong compared to a weakling AUD)
Overbought (RSI > 70)
Tin (for the 13th week)
Gasoil
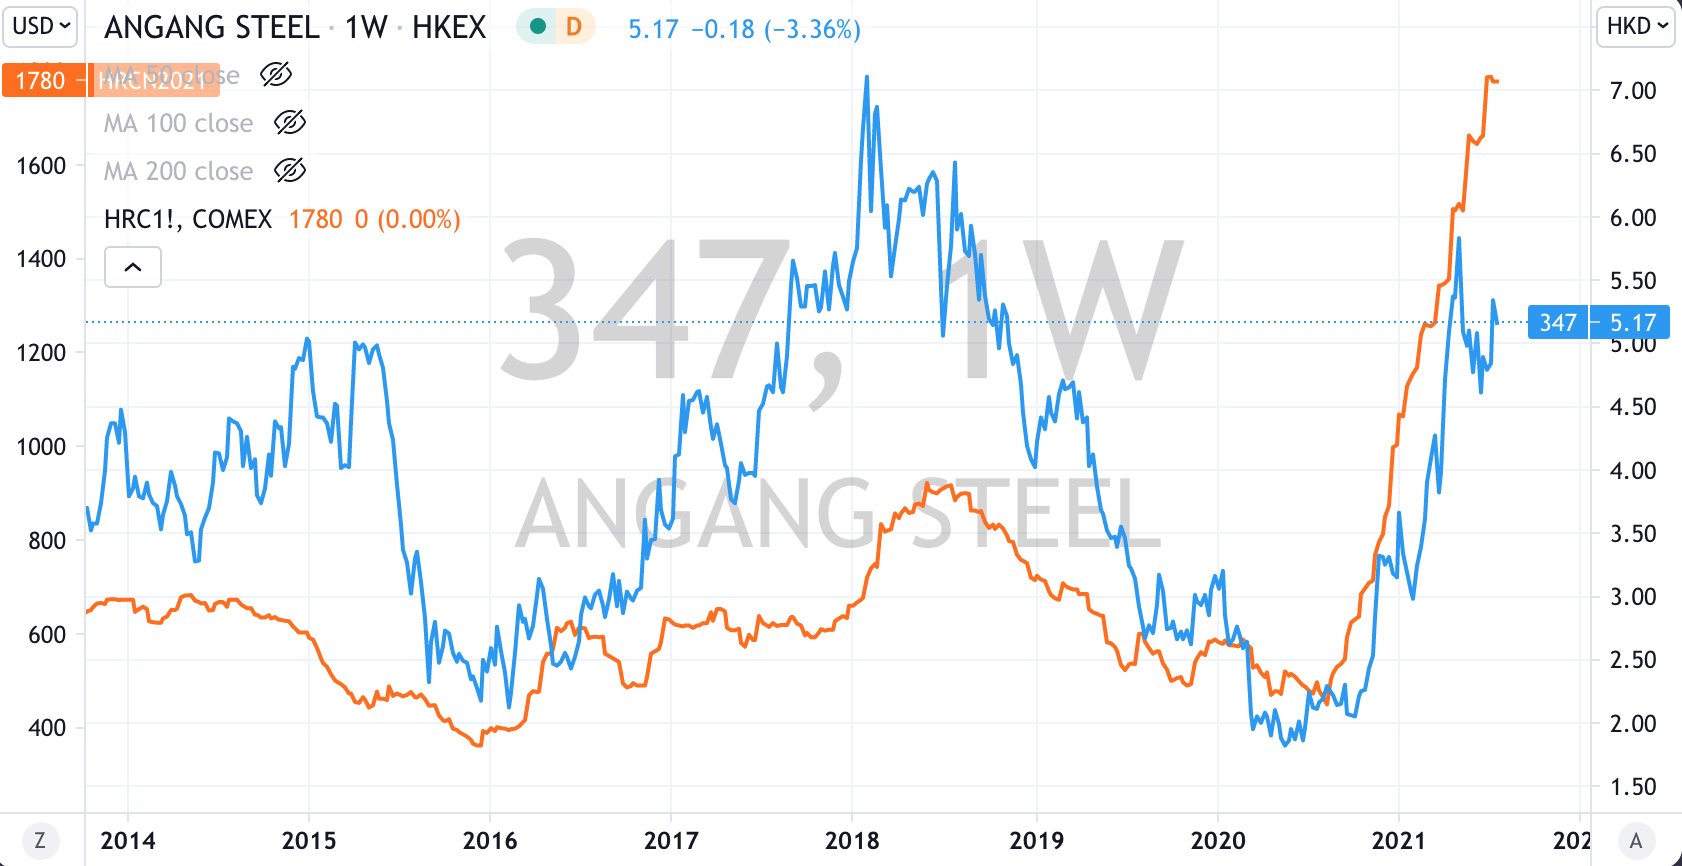
Hot Rolled Coil Steel
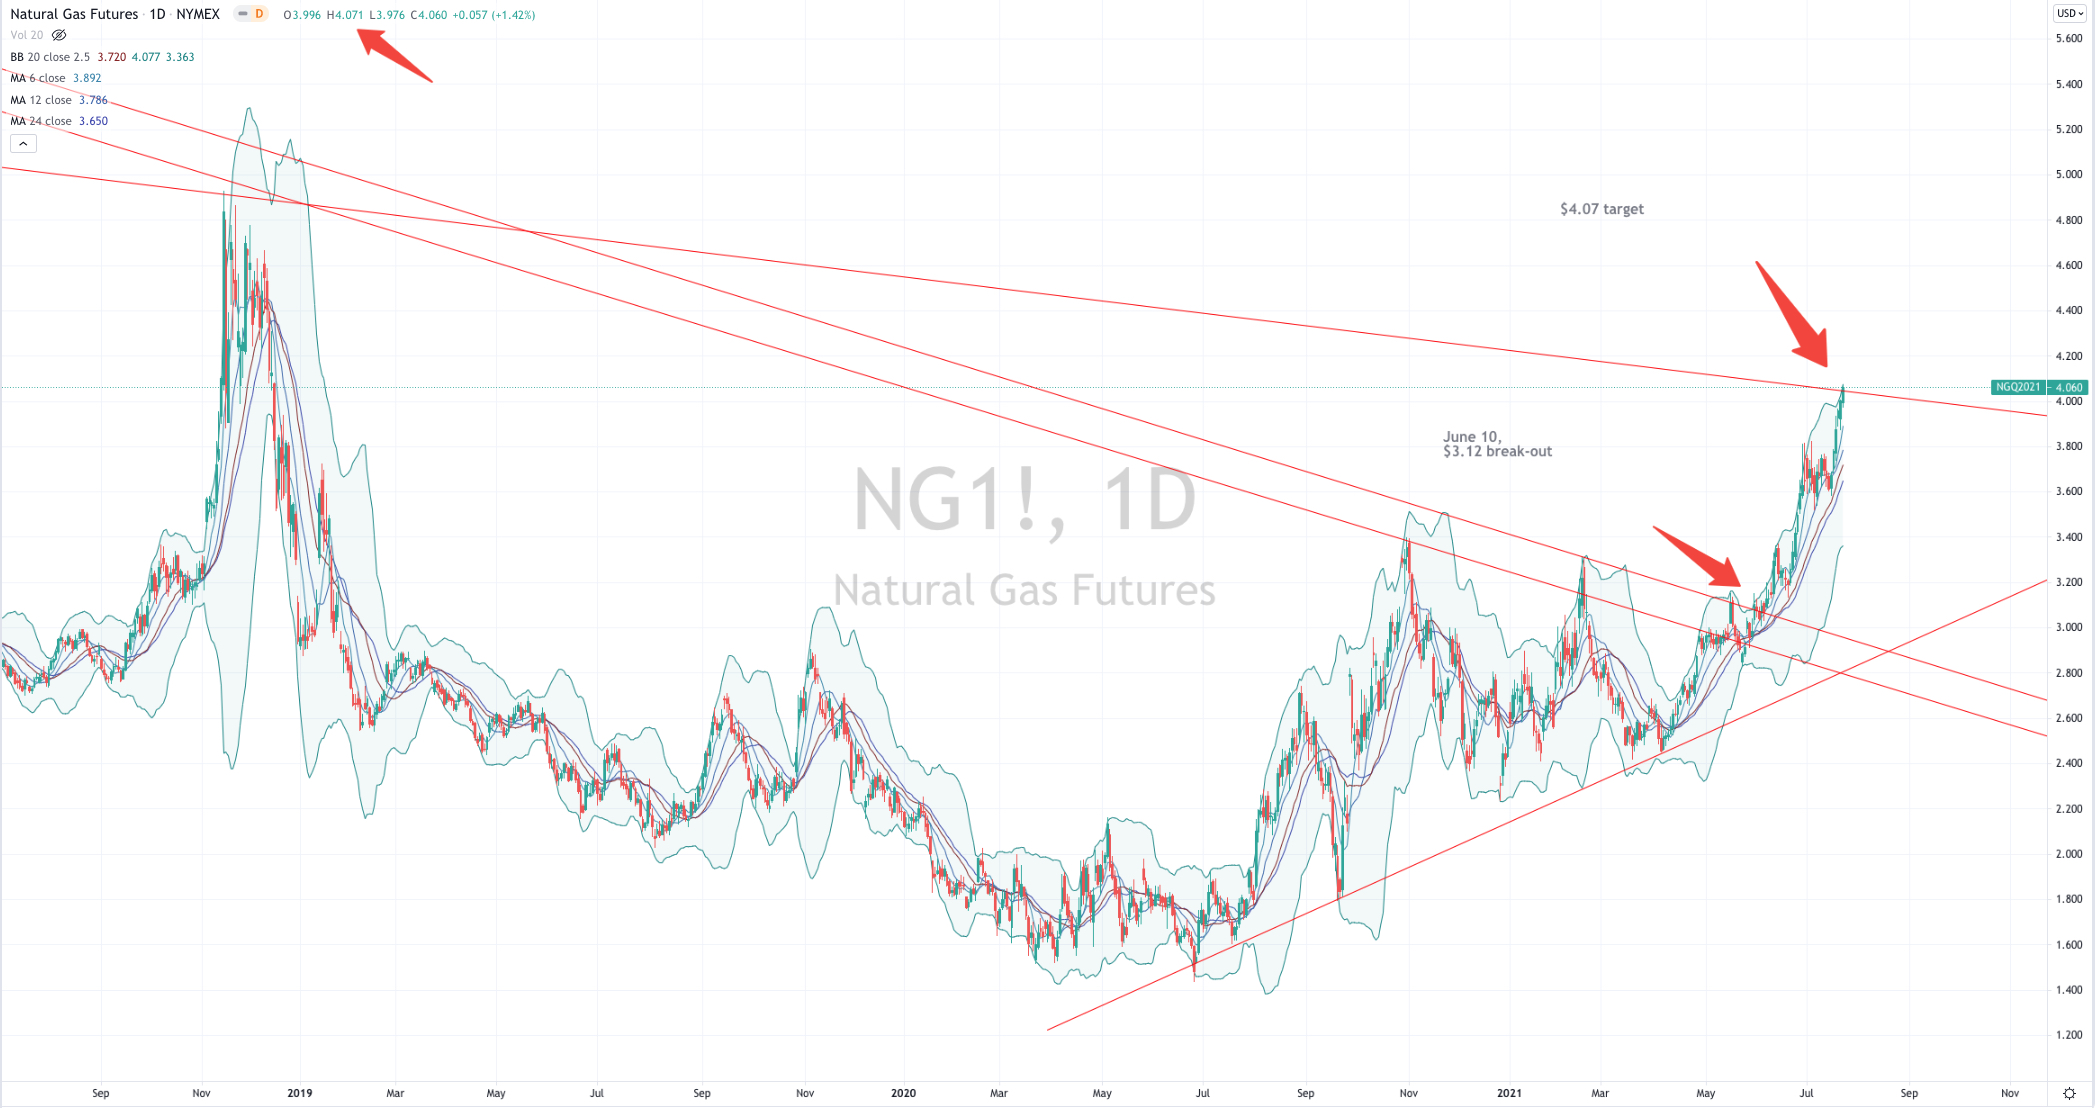
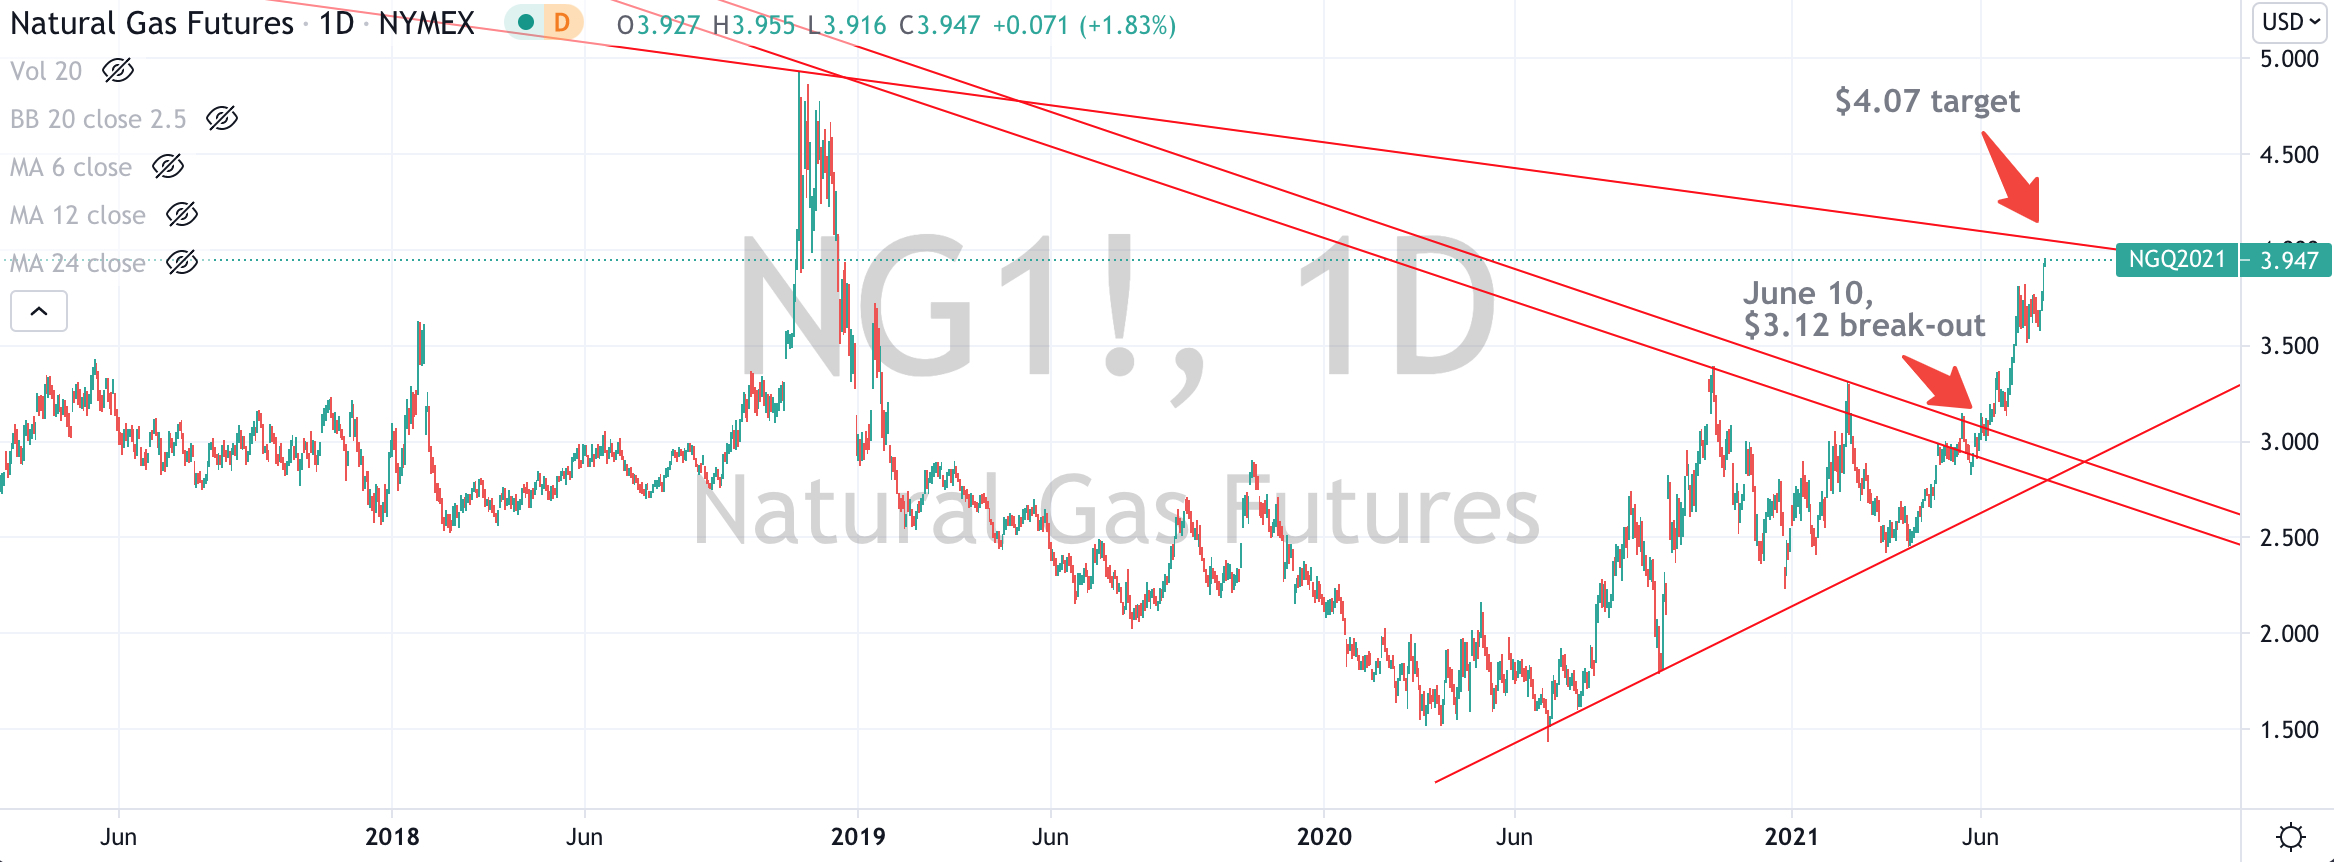
Natural Gas
the CRB Index
Switzerland’s SMI equity index (for the 6th week)
Australia’s ASX 200
the Nasdaq 100
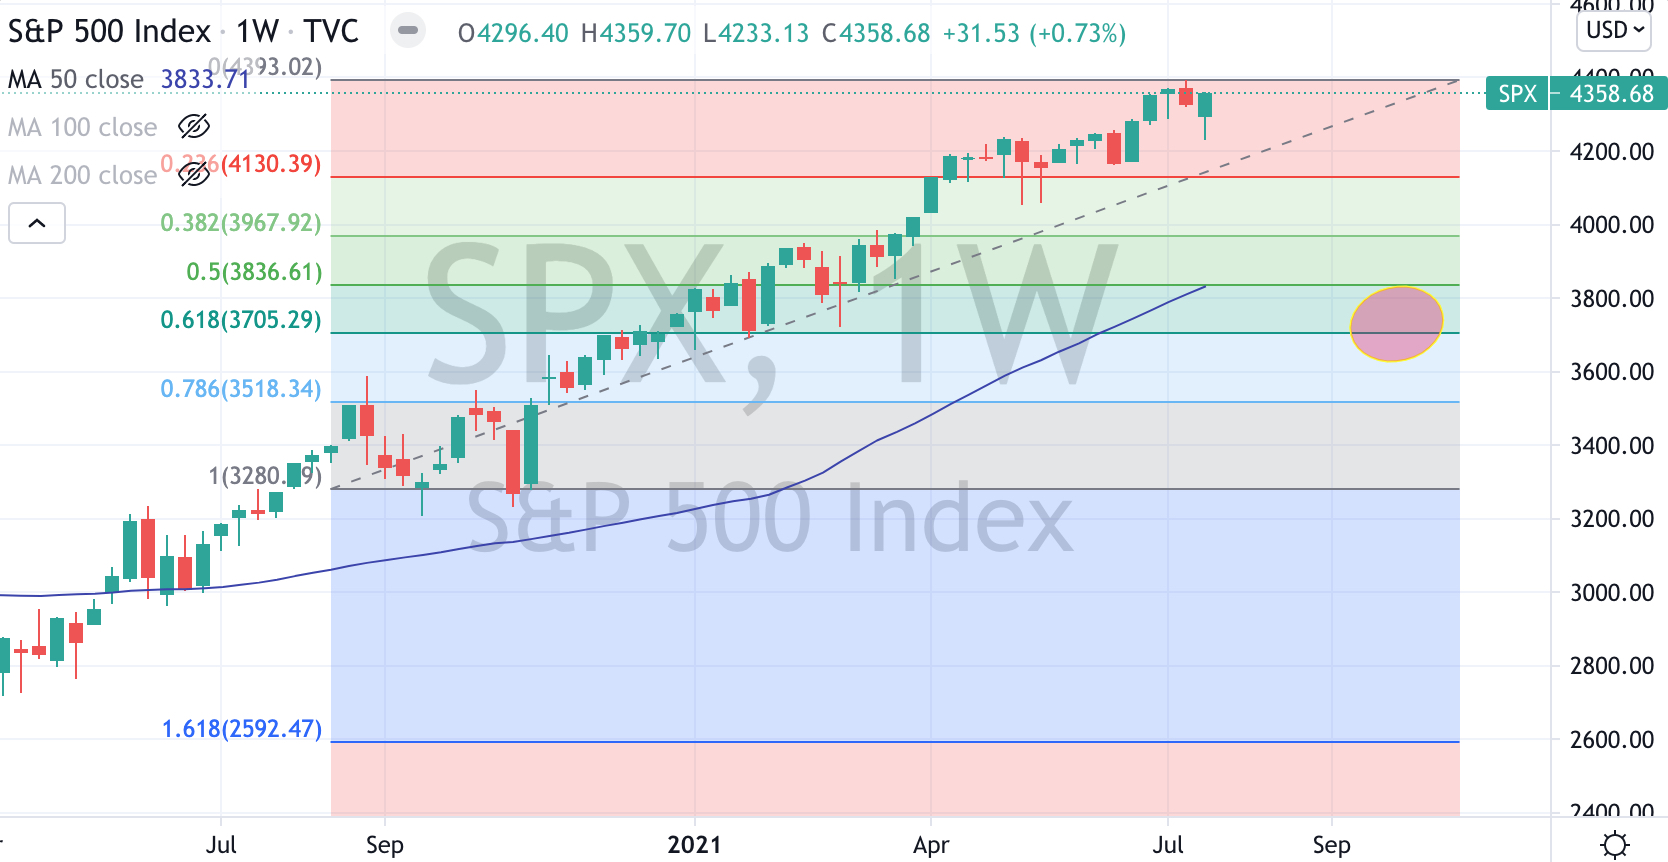
S&P 500 Index
and the Amsterdam, Copenhagen and Helsinki equity indices.
The Overbought Quinella – Both Overbought and Traded at > 2.5 standard deviations above the weekly mean)
Coffee
Orange Juice
Stockholm’s OSX equity index
Assets (securities) within my immediate universe which touched the other side of the extreme, being Oversold (where the RSI is < 30) or were at least 2.5 standard deviations below its mean are;
Extremes “below” the Mean (at least 2.5 standard deviations)
Cocoa,
the Russell 2000 and MidCap 400 equity indices,
the U.S. Government 10 & 5 year bond yields,
the Australian (10’s), Canadian, U.K., Chinese, Korean, German and Swedish 10’s
and the U.S. & Australian 10 year minus 2 year yield spread
Oversold (RSI < 30)
AUD/JPY (a weaker AUD and a stronger Yen suggests ‘risk-off’ is tiring)
AUD/USD (signifying a weak AUD)
Hang Seng China Enterprise Index
the Hang Seng Index
Nikkei 225 Index
Dow Jones Transport Index
The Oversold Quinella – Both Oversold and Traded at < 2.5 standard deviations above the weekly mean)
None
Notes & Ideas:
The big moves and news for the week was in the bond market which saw buyers aggressively accumulating and thus sending yields plummeting.
Some currencies are returning to the ‘extremes’ list while more commodities are mean reverting and easing away from their Overbought extremes.
Most notably, the energy complex has seen a little profit taking and a result those commodities (including Iron Ore) have fallen below their 70 marks on the RSI.
In the bond world, we saw a rebound in bond yields from their mid-week lows, while most interesting to me was the Japanese 10 Year yield traded a 200% range. The JGB’s aren’t called the widow-maker for nothing.
Importantly, they didn’t ‘go’ negative.
The decliners included Iron Ore (3%), Platinum (4%), Soybeans (7%), Silver (2%), Taiwan’s TAEIX (2%) and the HSCEI (3%)
Advancers were dominated by equity indices such as the Semiconductor SOX index rose 4%, the Nasdaq and Helsinki markets climbed +3%, the Stockholm, Russell 2000, MidCap 400, DJ Transports, the S&P 500 all rose 2%…while amongst commodities Lean Hogs were up 2%, Lumber & Coffee soared 17% and Natural Gas surged 11%
The U.S. 10 year bond yield fell sharply during the week, to a low of 1.13% yet closed almost unchanged at 1.28% from the previous week’s close.
It was a week to observe overreactions.
The 10’s remain bound in a larger range but we watch it broader capital markets could become explosive is the 10’s break either below 1.25% or above 1.65%.
No cryptocurrencies registered any Extreme readings.
And lastly, Bitcoin is trading 145% above its 200 Week Moving Average, which is higher than last week’s 127% reading and certainly lower when compared to its 466% peak in mid-April 2021.
July 25, 2021
by Rob Zdravevski
rob@karriasset.com.au