On September 7, 2022, I dispensed comments to clients about my views on the AUD/USD.
I cited how perverse it was that the Aussie was strong versus the EUR, GBP and JPY….
while it continued to weaken against the USD.
This so called perverse scenario is because you don’t generally see AUD strength against other G-8 currencies whilst it inversely exhibits weakness against the USD.
Then, I thought it was appropriate for operational businesses (whether requiring to do so physically or for hedging purposes) is to…….
1) take your strong AUD and buy either GBP, EUR or JPY (the Aussie has since weakened 1.4% against these crosses)
but then…..
2) prepare to sell your strong USD and buy AUD
Back then (Sept 7th), the AUDUSD was trading at 0.6717.
My advice said that it needs to trade below 0.6680 if it is to make a move to 0.6464.
But I noted that the AUD/USD is within the process of being in the lower quintile (the last legs) of the larger downtrend which commenced at 0.7600 in April 2022.
Now, I think it’s time to prepare for the 2nd piece of that previous commentary.
Overnight, the AUD/USD broke below the 0.6680 level mentioned.
At the time of writing it is now trading at 0.6590.
It has weakened 2.6% since September 7th, 2022.
The velocity of the downtrend is increasing, albeit slightly.
However we are nearing interim support of 0.6560
I still see the 0.6460 region as major support.
My work and probability suggests locking in hedges or actually Selling USD / Buying AUD around this 0.6580 – 0.6460 mark is prudent.
A visit to 0.6340 would be an outlier 4 standard deviation, only seen twice in the past 20 years.
Since August 25, the price of Natural Gas is 23% lower and the S&P 500 has declined 10%.
Commensurately, the share price of Oil & Gas companies have generally eased.
Some examples include Woodside and Exxon Mobil falling 9% while Occidental swooned 16%.
In that note, I called a $5 target for Natural Gas.
Well…….3 days ago NG traded down to $7.40.
To channel lyrics from a Bon Jovi song,
‘We’re half way there”.
I’m not sure if I want to insert the other half of that lyric being “Whoa, livin’ on a prayer” as my thesis seems to be based on more than a prayer.
But we are seeing deflationary news being presented right in front of our very eyes.
Gas, Oil and Gas (and derivative products such as Gasoline, Heating Oil and Distillate) prices have been falling for some months. So I remind myself that inflation reports publish lagging data and with the energy complex being both a large weighting of the inflation calculation and the last holdout in a broader decline amongst a host of commodity prices………
I’m amazed that the market pundits are ‘counting’ the rise in prices into their inflation argument but not acknowledging the subsequent decline in those prices as being plausible causes for an abating effect in future inflation readings.
Energy inputs are falling and this will have various positive effects on business and the consumer.
The vertical lines show the significance when the Japanese 10 year bond yield is (on a weekly chart) simultaneously OVERSOLD and trading 2.5 standard deviations and BELOW its rolling weekly mean.
Around the same time, the S&P 500 also registers a notable low.
There have been 9 such moments over the past 15 years when probability suggests nibbling and adding to your holdings.
BoJ and Fed news this week will be helpful shaping the JGB yield but this study suggests the S&P 500 low isn’t there yet. This doesn’t necessarily mean a lower low, but rather a ‘notable’ low.
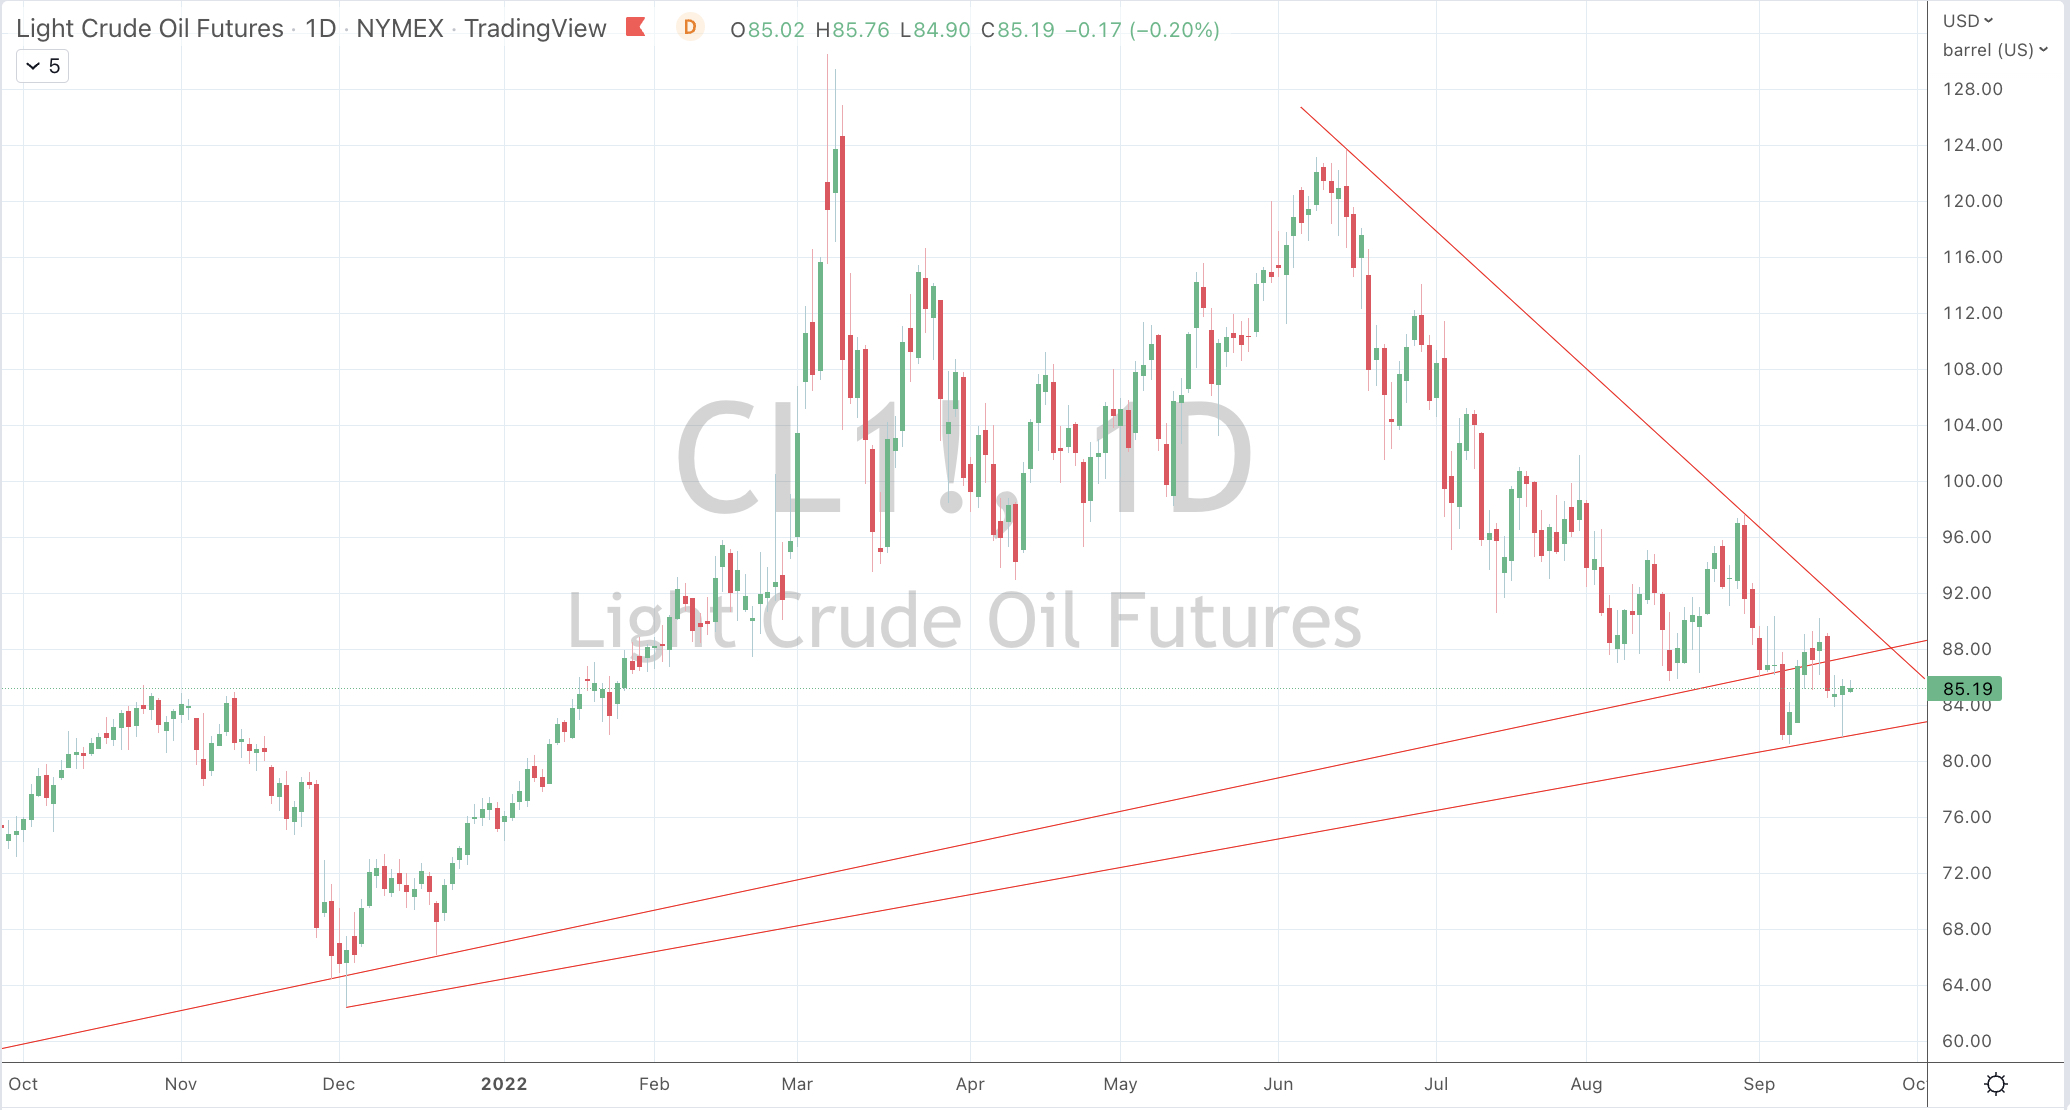
Here are some WTI Crude Oil trend lines I’m watching.
The downward trend remains intact, however on a daily basis it’ll need a quick drop of $2-$3 in order to add some strength to this trend, otherwise we can kiss a visit to $77.50 and any notion of ~ $65 good bye for the time being.
Should this trend wane, it will correspond with the AUD/USD and the CRB Index finding a floor.
Bitcoin’s price action, trend and sentiment suggests it tests somewhere around the US$16,000 mark. +/- $600.
A drop in Bitcoin’s 30 day volatility precedes a trough in the price of BTC/USD which precedes ‘one more decline’ in the S&P 500 before itself finds a floor.
This would put my S&P 500 target around 3,645.
A bottoming process which builds into a rally in these two markets would cause much damage to all those huddled on the other side of the boat.
p.s. The direction Bitcoin also has reasonably good correlation with the Australian Dollar and commodity prices.
I am constructively bullish about commodity prices, however that opinion is not broad nor blindly so.
I’m working on how to express my best ‘absolute’ view in a specific commodity or theme. Buying scarcity and those who have capacity will be a key criteria.
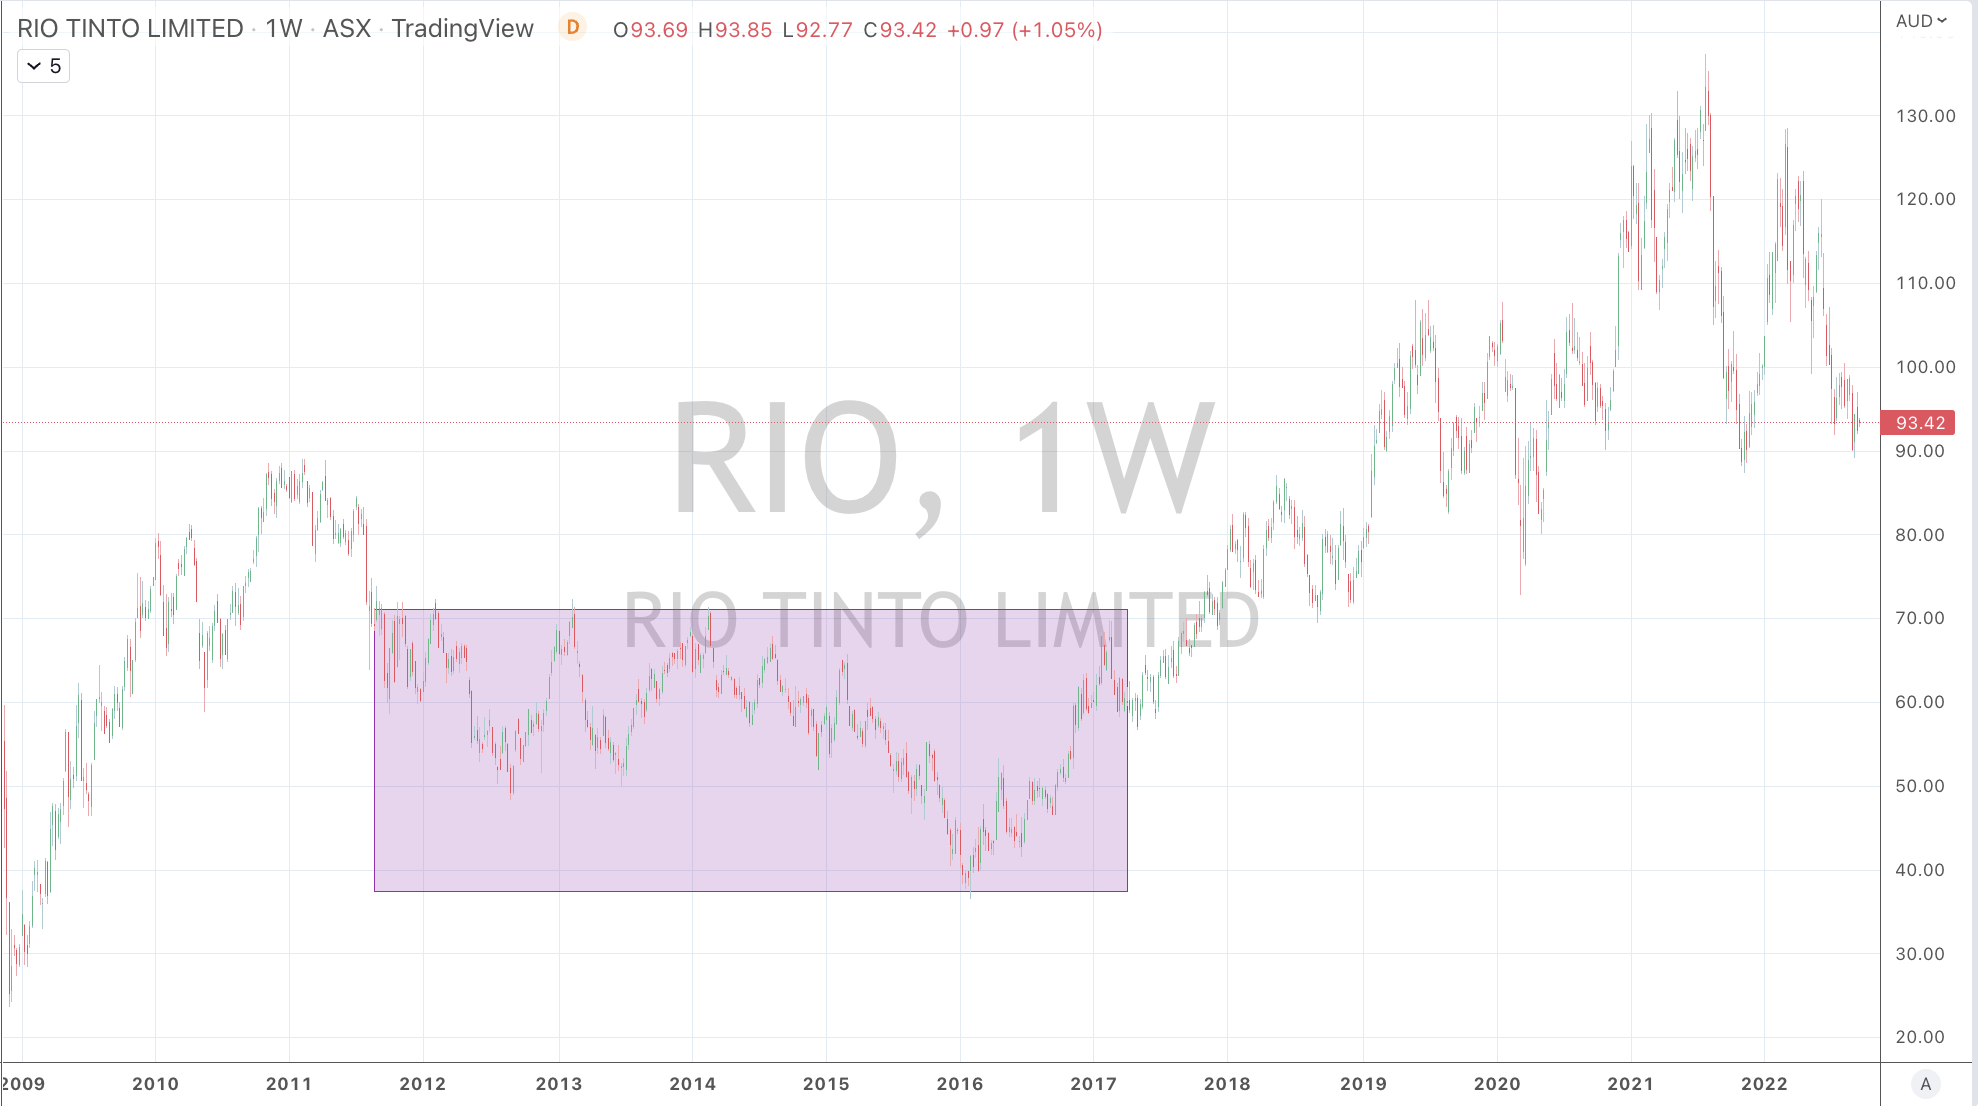
I remind myself that commodities can trade sideways (as Rio Tinto did for 7 years) and the broader CRB Index had for a 10 year bear market.
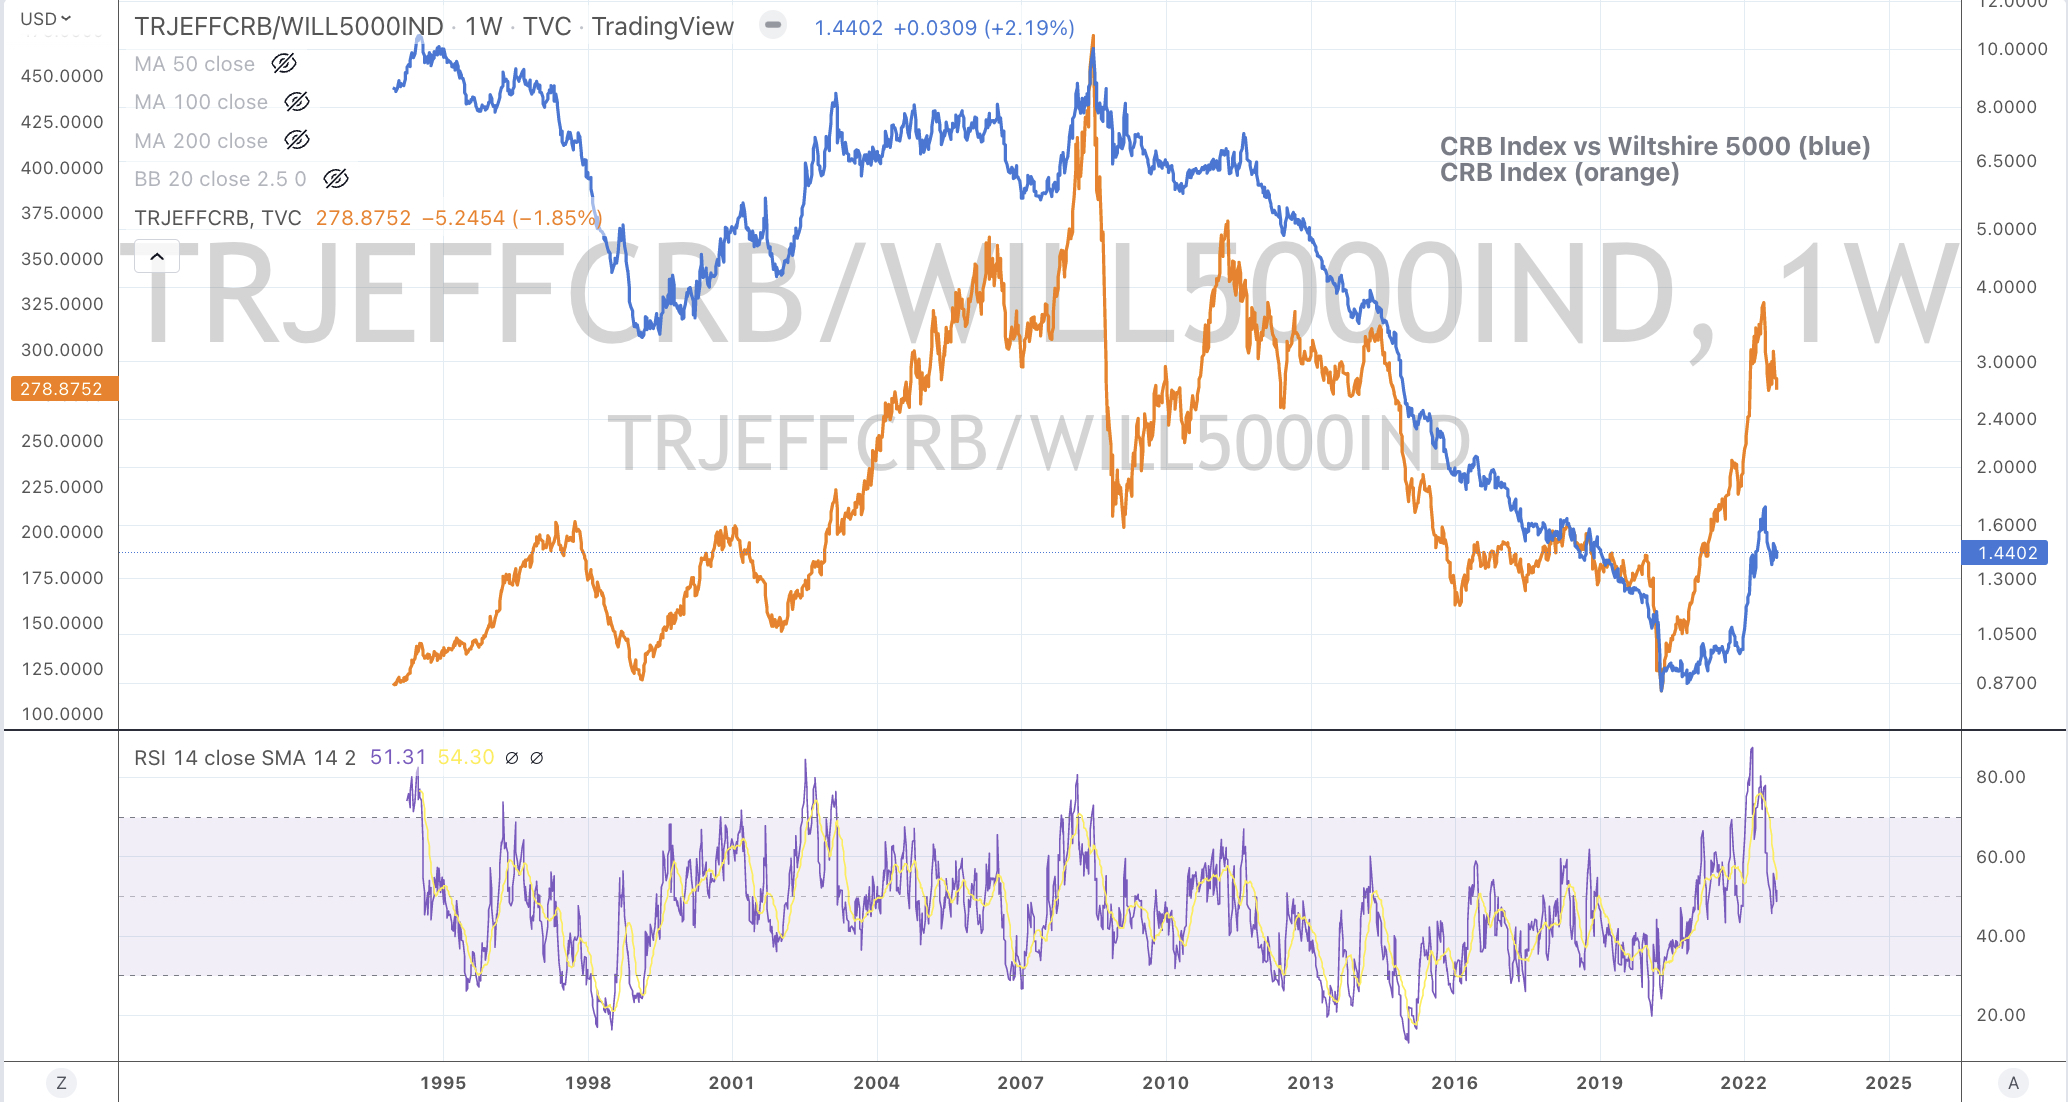
While I find analysis on a ‘relative basis’ irksome, commodities are nearing another visit to being inexpensive relative to equities, as the CRB Index to Wilshire 5000 chart shows.
As much as I dislike the time spent speculating on such a definition, if I’m forced to pass an opinion, it’s looking like a mid cycle slowdown.
Irrespective, businesses adjust and we trade through the cycle.
Over the past 40 years, studies show that recessions are officially registered somewhere between 18 months and 22 months following the inversion of a country’s yield curve, being when the difference between the 2 year and 10 year bond yield trades into a negative percentage.
The jury is still out whether the 5 year minus 3 month yield is a better indicator to watch.
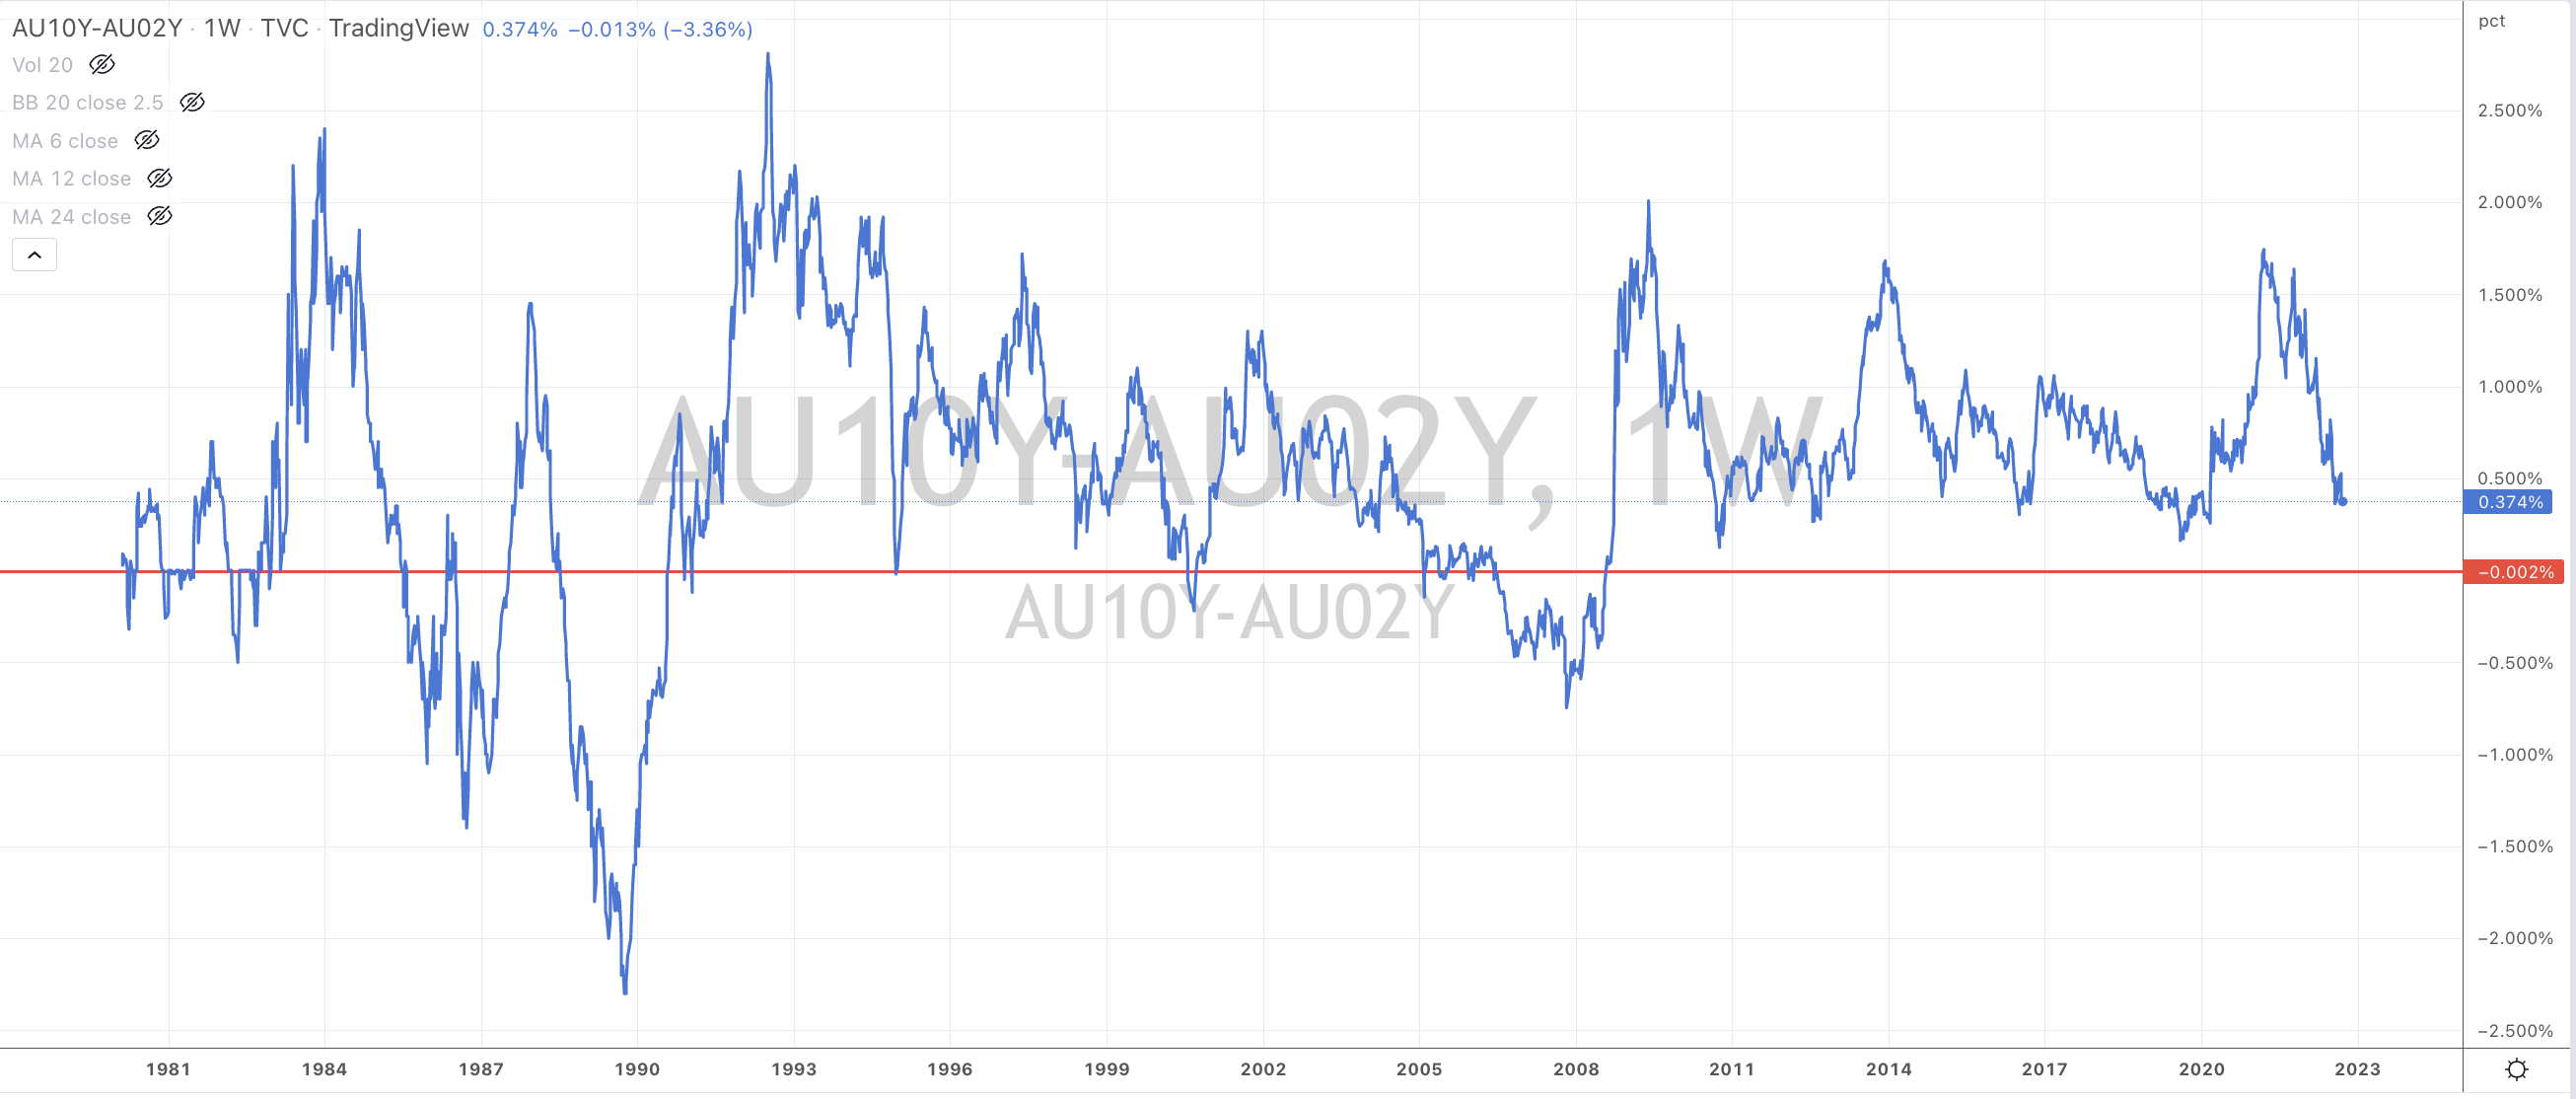
So back to the traditional 10 year minus 2 year…..and unlike the United States, the Australian yield curve is not inverted.
The red line in the chart below represents 0.00%.
The two things occurring which I think will invert this curve are;
1) an overzealous Reserve Bank of Australia hiking rates too much trying to correct the overly accommodating and subsidising government fiscal policy errors and;
2) a government which cuts off the nations (commodity supply and capacity) ‘nose to spite its own face’ by crimping production and export of gas, coal, iron ore and other minerals.
It’s the quantum of the rate rises which I am watching.
When you have a lot of debt and potentially stretched, it doesn’t matter what the absolute interest rate is.
You risk being wiped out if you can’t service the interest payments once your interest cost triples.
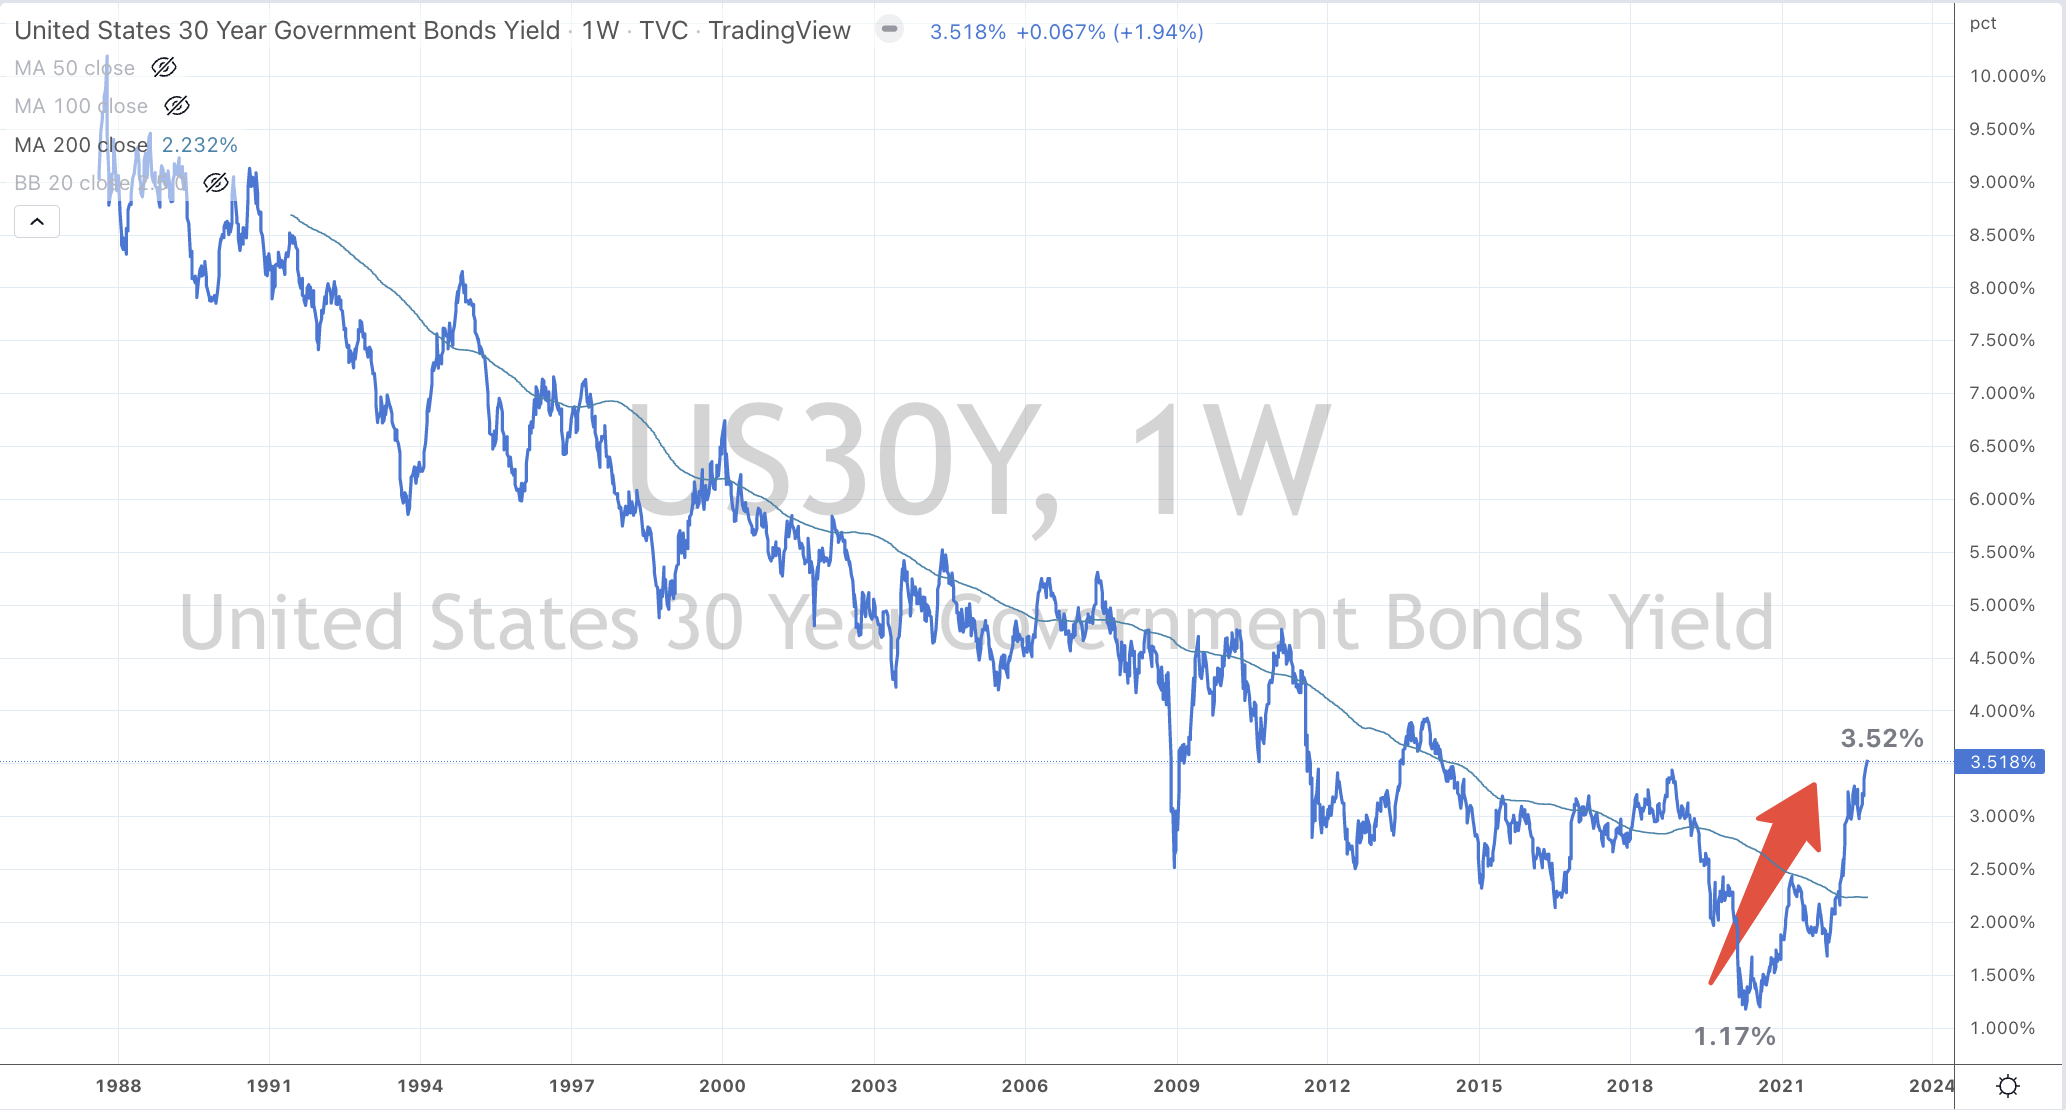
The chart below shows the travels of the U.S. 30 year government bond yield.
When rates were 6% in 1993 and then rose to 8% by 1995, it’s only a rise of 33%.
A rise from 5% to 6.7% as seen in 1998-2000 was only 33%.
During 2012-2014, 30 year rates moved from 2.5% to 3.9%. That’s an increase of only 55%.
The current rate cycle equals an increase of 300%.
My analysis is focused on the quantum of rate rises required, in order to temper credit applications and expansion which when combined with rhetoric will hopefully achieve the desired moderation of inflation.
And when we look at the developed world, we are much more closer to the end of the rate hikes than the beginning.
If the quantum of the rate rises expands, then there is risk to that large asset class known as residential real estate.
After all, the citizens of the developed world are awfully indebted while those in the developing economies (mentioned in the post below) have already experienced rate hikes of between 10 and 13 fold.
You can call it ‘front loading’ or anything else, but the cash rates along with 1, 2 or 3 year government yields of the developed world economies have already risen by the same factor of between 10 and 13 times.
So all this energy spent debating on where G12 central banks need to raise the absolute rate to, is futile.
But for the record, Canada currently has the highest interest rate out of all the G12 and a commodity sensitive (exporting) nation, they will a central bank to monitor for they have increased their policy rate 13 fold from 0.25% to 3.25%. The next BOC meeting is on October 26, 2022.
It’s time to get used to a new interest rate base from which central banks will work from and the investing effect is clear.
The absolute cost of capital has markedly increased and the return on investments will be adjusted lower.
The following assets (on a weekly timeframe) registered an Overbought or Oversold reading and/or have traded more than 2.5 standard deviations above or below its rolling mean.
Extremes “above” the Mean (at least 2.5 standard deviations)
TBT
EUR/GBP
AUD/JPY
Overbought (RSI > 70)
U.S. 2 year government bond yield
German 5 year government bond yields
Spanish, French, Italian and U.K.10 year government bond yield
U.S. Dollar Index (DXY)
The Overbought Quinella – Both Overbought and Traded at > 2.5 standard deviations above the weekly mean)
U.K. 10 year government bond yields
U.S. 5, 20 and 30 year government bond yields
German 2 year government bond yields
Extremes “below” the Mean (at least 2.5 standard deviations)
CAD/USD
NZD/USD
IEI
Oversold (RSI < 30)
Tin
Hot Rolled Coil Steel (HRC)
GBP/USD
JPY/USD
The Oversold Quinella – Both Overbought and Traded at > 2.5 standard deviations above the weekly mean)
CNH/USD
KRW/USD
TLT
Notes & Ideas:
The big news for the week is the outside bearish weeks posted by the Shanghai Composite, the DJIA, DJ Transports, MidCap 400, NDQ, RTY, SOX, S&P 500, the SmallCap 600, Copenhagen’s OMX 30 and the Swiss SMI.
The declines and reversals in equites was preceded by my note, 9 days earlier, that markets can be (are) cruel.
The Government bond yield continue to gather an ‘overbought’ stream but the US 5 year minus 3 month yield spread is not longer Oversold.
The consensus is that Europe is ‘on the nose’. The CAC and DAX lows were seen six months ago, in March 2022. Those indices are back visiting and testing those lows.
Meanwhile, the Hang Seng Index and HSCEI have made ‘lower lows’, while the S&P 500 made a lower close than last week’s low.
Re-resting of lows in equity indices will be something I’m watching.
This past week, the Russell 2000 mean reverted (200 week moving average) again, the Philadelphia Semiconductor Index (SOX) is close to its 1st visit in a long time, the S&P SmallCap 600 is 5% away from doing so while the ASX 200 is nearly doing so for the 2nd time in as many months.
We saw more in the energy complex accelerate their decline.
Diesel (Gasoil) fell 10%, the Japan Korean LNG Marker sunk 22%, and Heating Oil declined 11%.
My thoughts about the price of diesel halving were published 2 months ago.
The Baltic Dry Index has risen 40% in the past 2 weeks, showing demand for bulk shipping.
And Gold is working its way towards a buy target.
The larger advancers over the past week comprised of;
Baltic Dry Index 28%, Iron Ore 3%, Lean Hogs 4%, Nickel 9.5%, Orange Juice 1.9%, Platinum 2.8%, Silver in USD 3.3%, Urea Middle East 2.2%, Silver in AUD 5.8% and Soybeans rose 2.6%.
The group of decliners included;
Australian Coking Coal (2.3%), Rotterdam Coal(1.8%), China Coal (3.6%), WTI Crude (2.3%), Gasoil (10%), Copper (1.4%), Heting Oil (11.4%), HRC (3.6%), JKM (21.8%), Coffee (5.9%), Lumber (5.8%), Natural Gas (2.9%), Palladium (3%), Rubber (1.8%), Sugar (1.9%), CRB (1.9%), Cotton (7.6%), Dutch TTF (9.3%), Uranium (6.9%), Gold in USD (2.5%), Shanghai (4.2%), AEX (3.1%), KBW Banking (3.8%), CAC (2.2%), DAX (2.7%), DIA (4.4%), DJ Transports (8.8%), HSCEI (3.1%), HSI (3.1%), Bovespa (2.7%), S&P MidCap 400 (5.1%), Nasdaq 100 (5.8%), Oslo (2.7%), Copenhagen (6.3%), Helsinki (2%), Stockholm (2.7%), Russell 2000 (4.5%), Sensex (1.6%), SMI (2.7%), SOX (5.8%), S&P 500 (4.7%), FTSE 100 (1.6%), Toronto’s TSX (2%), S&P SmallCap 600 (4.1%), Nasdaq Biotech (3.9%), Nasdaq Composite (5.5%) and the ASX 200 fell 2.3%.