Watching Currencies – AUD/JPY and Crude Oil
September 5, 2022 Leave a comment
Correlations – AUD/JPY and Crude Oil
September 5, 2022
by Rob Zdravevski
rob@karriasset.com.au

Trying to hear what's not being said
September 5, 2022 Leave a comment
Correlations – AUD/JPY and Crude Oil
September 5, 2022
by Rob Zdravevski
rob@karriasset.com.au
September 4, 2022 Leave a comment
The following assets (on a weekly timeframe) registered an Overbought or Oversold reading and/or have traded more than 2.5 standard deviations above or below its rolling mean.
Extremes “above” the Mean (at least 2.5 standard deviations)
None
Overbought (RSI > 70)
U.S. 2 year government bond yield
U.S. Dollar Index
Istanbul Stock Exchange (BIST)
The Overbought Quinella – Both Overbought and Traded at > 2.5 standard deviations above the weekly mean)
U.K. 10 year government bond yields
Extremes “below” the Mean (at least 2.5 standard deviations)
NZD/AUD
CAD/USD
TLT
Oversold (RSI < 30)
U.S. 5 year minus U.S.3 month government bond yield ‘spread’
Turkish 10 year government bond yields
Hot Rolled Coiled Steel
Tin
EUR/USD
GBP/USD
CNH/USD
DKK/USD
KRW/USD
SEK/USD
JPY/USD
The Oversold Quinella – Both Overbought and Traded at > 2.5 standard deviations above the weekly mean)
None
Notes & Ideas:
The big news over the past week saw a continuation of the decline in U.S. equities with the Philadelphia Semiconductor Index (SOX) standing out with a 7% swoon.
Government bond yields are approaching their next round of being overbought, as are Cattle prices.
U.K. 10 year bond yields are at their highest since July 2011.
The U.S. Dollar Index (DXY) is at its highest since September 2022.
Gold, Silver and Platinum are nearing buys,
as is the Baltic Dry Index.
The Shanghai Composite equity index, Copper and the U.S. KBW Banking Index has mean reverted and dipped to its 200 week moving average for the second time in as many months.
Following last week’s comments about surging gas prices, Dutch TTF Gas and Japan Korean LNG Marker price no longer overbought having tanked 38% and 20% for the week, respectively.
U.S. RBOB Gasoline prices continue to retrace. This week’s 8% decline means it has halved over the past 3 months,
While, Australian Coking Coal has risen 33% over the past 5 weeks.
The larger advancers over the past week comprised of;
Australian Coking Coal 11.2%, Orange Juice 6% and Istanbul’s BIST equity index rose 2%.
The group of decliners included;
Aluminium (8.5%), Rotterdam Coal(2%), Bloomberg Commodity Index (4.4%), China Coal (2%), WTI Crude (6.7%), Gasoil (8.6%), Copper (7.7%), Heating Oil (10.7%), HRC (1.8%), JKM (19.7%), (19.7%), Coffee (3.9%), Lumber (3.8%), Tin (6.2%), Natural Gas (5.2%), Nickel (2.2%), Palladium (4.5%), Platinum (4.3%), Gasoline (8%), Rubber (2.4%), Sugarm(1.7%), Silver (4.6%), CRB Index (4.9%), Cotton (11.2%), Dutch TTF (38.1%), Brent Crude (7.3%), Silver in AUD (3.3%), Silver (4.5%), Oats (5.7%), Soybeans (2.8%), AEX (3.8%), KBW Banks (2.5%), Dow Jones Industrials (2.8%), DJ Transports (4.5%), HSCEI (3.6%), HSI (3.6%), IBEX (1.6%), KOSPI (2.9%), S&P MidCap 400 (4.2%), Nasdaq 100 (4%), Nikkei (3.5%), Oslo (3%), Copenhagen (3.8%), Russell 2000 (4.7%), SOX (7.1%), S&P 500 (3.3%), Taiex (4%), FTSE (2%), S&P SmallCap 600 (5.2%), Nasdaq Composite (4.2%), Canada’s TSX (3%) and Australia’s ASX 200 declined (3.9%).
September 4, 2022
by Rob Zdravevski
rob@karriasset.com.au
September 3, 2022 Leave a comment
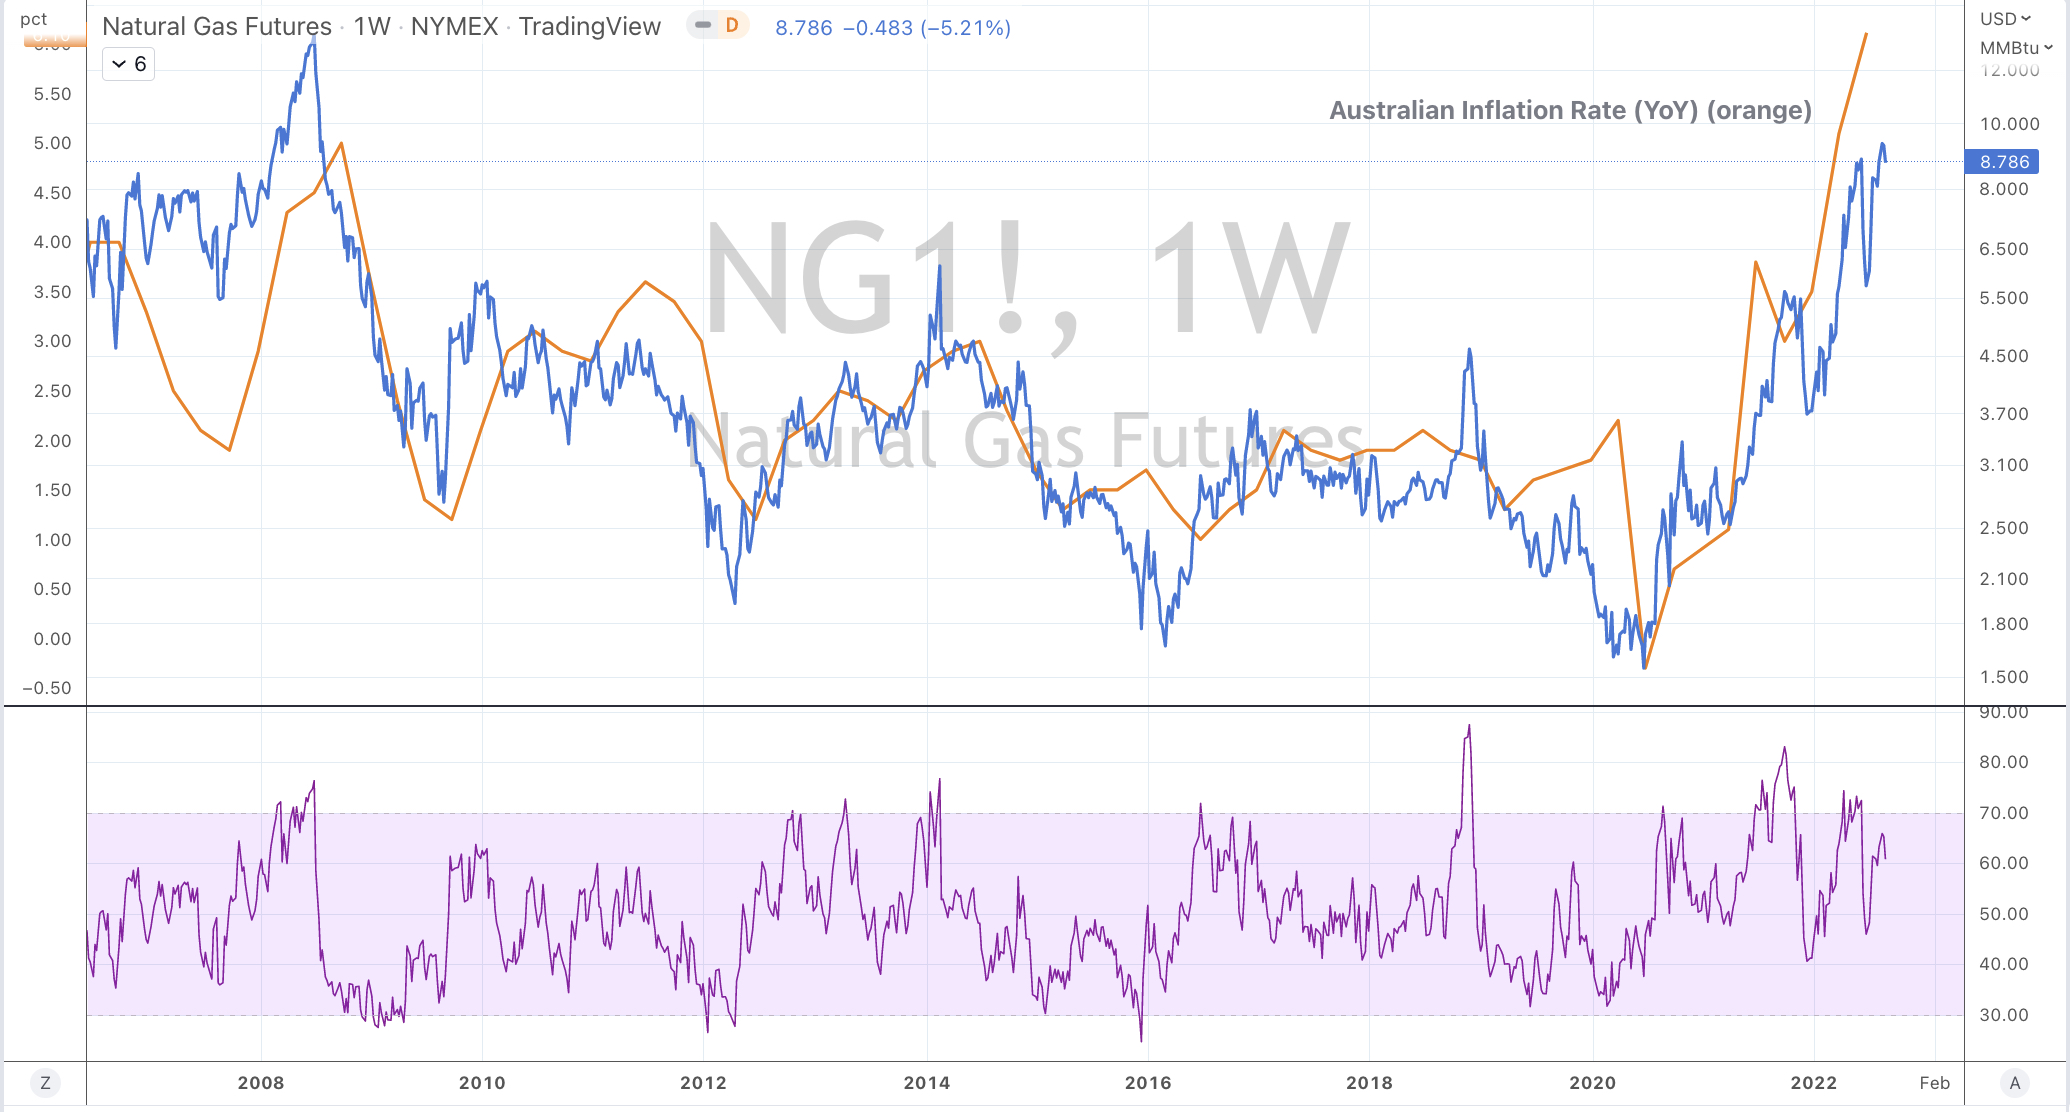
As an addendum to last week’s note about elevated Natural Gas (US$ Henry Hub) prices,
here is a chart pitching those American gas prices against the Australian inflation rate, aiding my call for moderation.
September 3, 2022
by Rob Zdravevski
rob@karriasset.com.au
September 2, 2022 Leave a comment
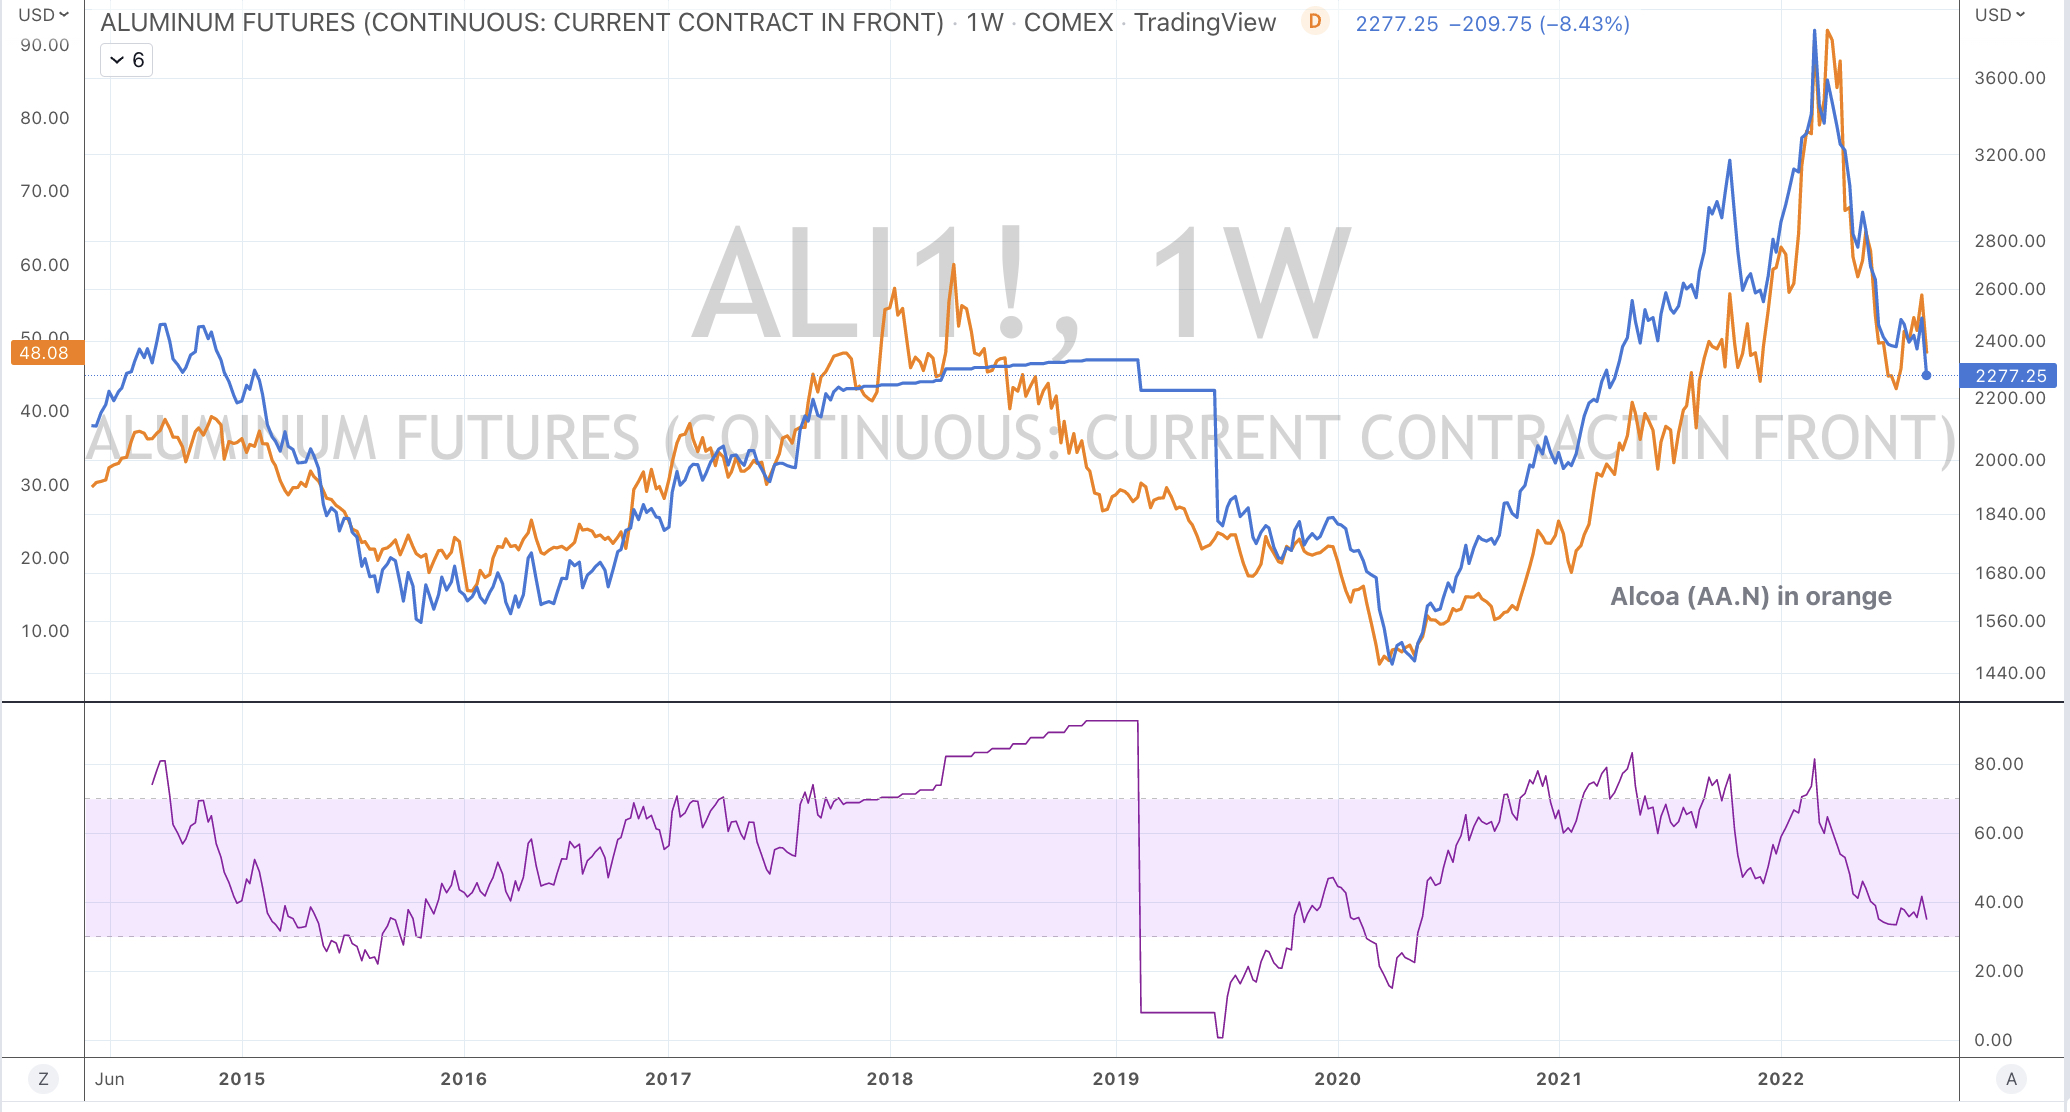
Here is the price of Aluminium and Alcoa’s (AA.N) stock price waltzing around.
Observe the operational leverage the equity can provide if the company is executing well, when the underlying commodity is in an upward trend.
September 2, 2022
by Rob Zdravevski
rob@karriasset.com.au
September 2, 2022 Leave a comment
The Iron Ore futures (Singapore traded, 62%) price dances nicely along with the stock price of Rio Tinto (RIO.ASX)
September 2, 2022
by Rob Zdravevski
rob@karriasset.com.au

September 2, 2022 Leave a comment
I’m sharing a presentation which I spoke to this week.
The topic is contrarianism where I show long-term charts (on a weekly basis) and quantified extreme moments using three measures, being:
– the 200 week moving average
– the Relative Strength Indicator (signalling Overbought and Oversold readings) and
– Bollinger Bands showing when prices traded to 2.5 standard deviations (either above or below its rolling weekly mean)
I attempted to highlight the case for lower interest rates and inflation (as they are themselves trading at ‘extreme’ levels) by showing a host of correlations and I believe moderation is aided with further mean reversions amongst various prices, while many other commodities have already done so. As reported inflation figures lag, lower readings are expected to appear in the coming 4-10 months.
There is also a series of charts showing recent buying ‘windows’ and where I’m waiting for some others to enter my buying territory.
Towards the end of the presentation I touch on how a scramble to secure supply led to price spikes and parabolic price moves in commodities such as Lumber and Steel, where such parabolas were (and often) followed by sharp declines.
I think there is much finished product still held as inventory, thus tying up working capital and should lead to discounting wars. This will be deflationary and assist in abating inflation and interest rates.
To be clear, I’m calling for interest rates and inflation to abate, not collapse.
September 2, 2022
by Rob Zdravevski
rob@karriasset.com.au
September 1, 2022 Leave a comment
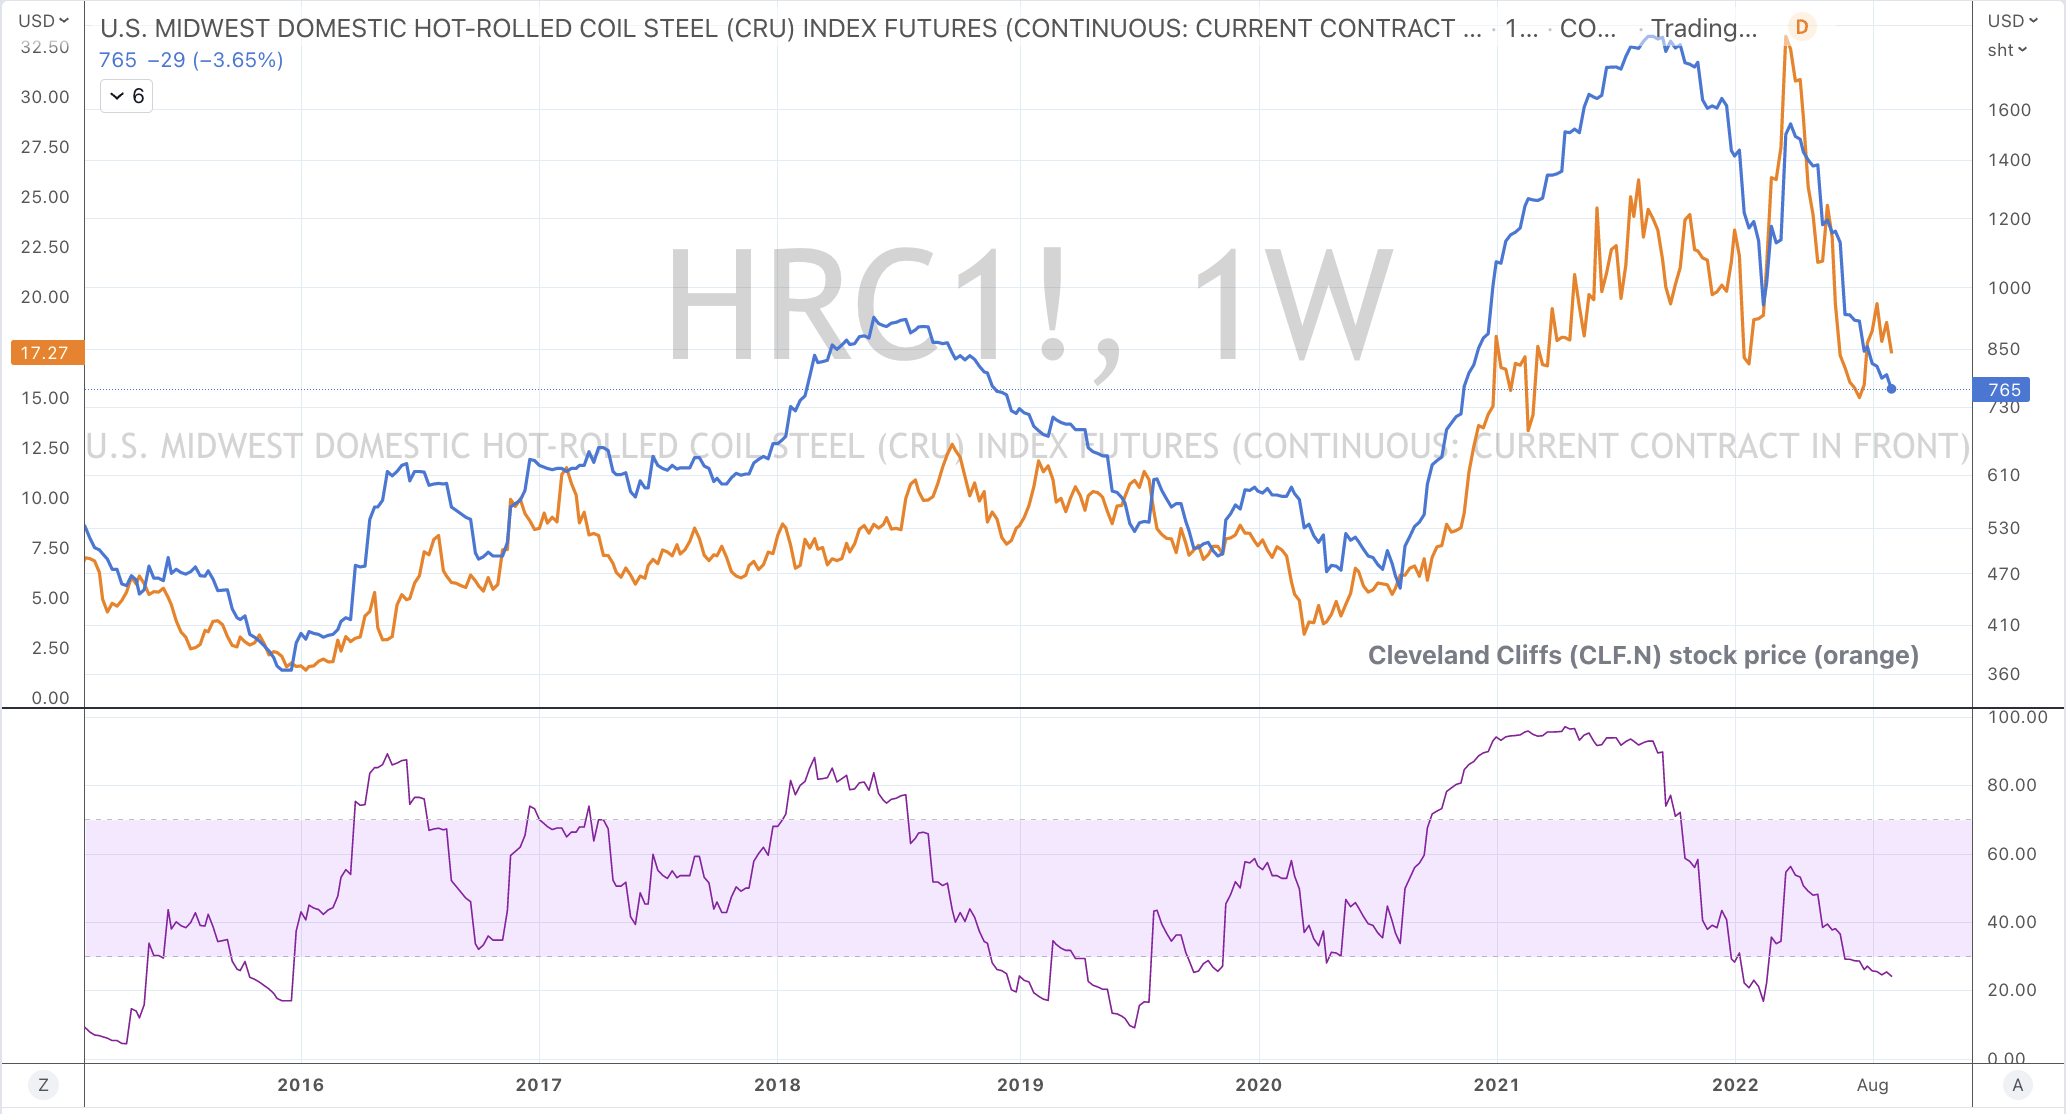
Lows in U.S. Hot Rolled Coiled Steel prices are correlating with the stock prices of selected steel companies.
Cleveland Cliffs (CLF.N) is the featured comparison in the chart below.
September 1, 2022
by Rob Zdravevski
rob@karriasset.com.au
August 31, 2022 Leave a comment
Anecdotally, the most euphoric noise that I hear globally surrounds three markets, being LNG, Thermal Coal and Lithium/Spodumene.
Especially amongst gas prices, I can’t hear anyone making a case for a moderation of prices.
The herd is all huddled together on the same life rafts.
Sure, prices can go higher but I dare you to initiate a new ‘long’ position.
My commentary is to heed warning.
The technicals and the spikes in price action are pointing to extremes which I think provide a terrible risk/reward skew for any recent or new entrants to these markets.
Producers and Sellers of such commodities would be well advised to lock in prices.
Buyers should elect taking a calculated risk of probability and not commit to fixing in those higher prices.
Owners of listed securities exposed to these sectors are doing themselves an injustice if they are not acknowledging the speculative fervour, let alone pondering taking the ‘fat part of the trade’.
The charts below show prices being Overbought, trading to 3 standard deviations and stratospheric miles above their 200 week moving averages.
Although one day doesn’t make a season, the Dutch TTF Natural Gas and Japan/Korean LNG Market prices are down 25% and 15% respectively, thus far, thus week.
August 31, 2022
by Rob Zdravevski
rob@karriasset.com.au


August 29, 2022 Leave a comment
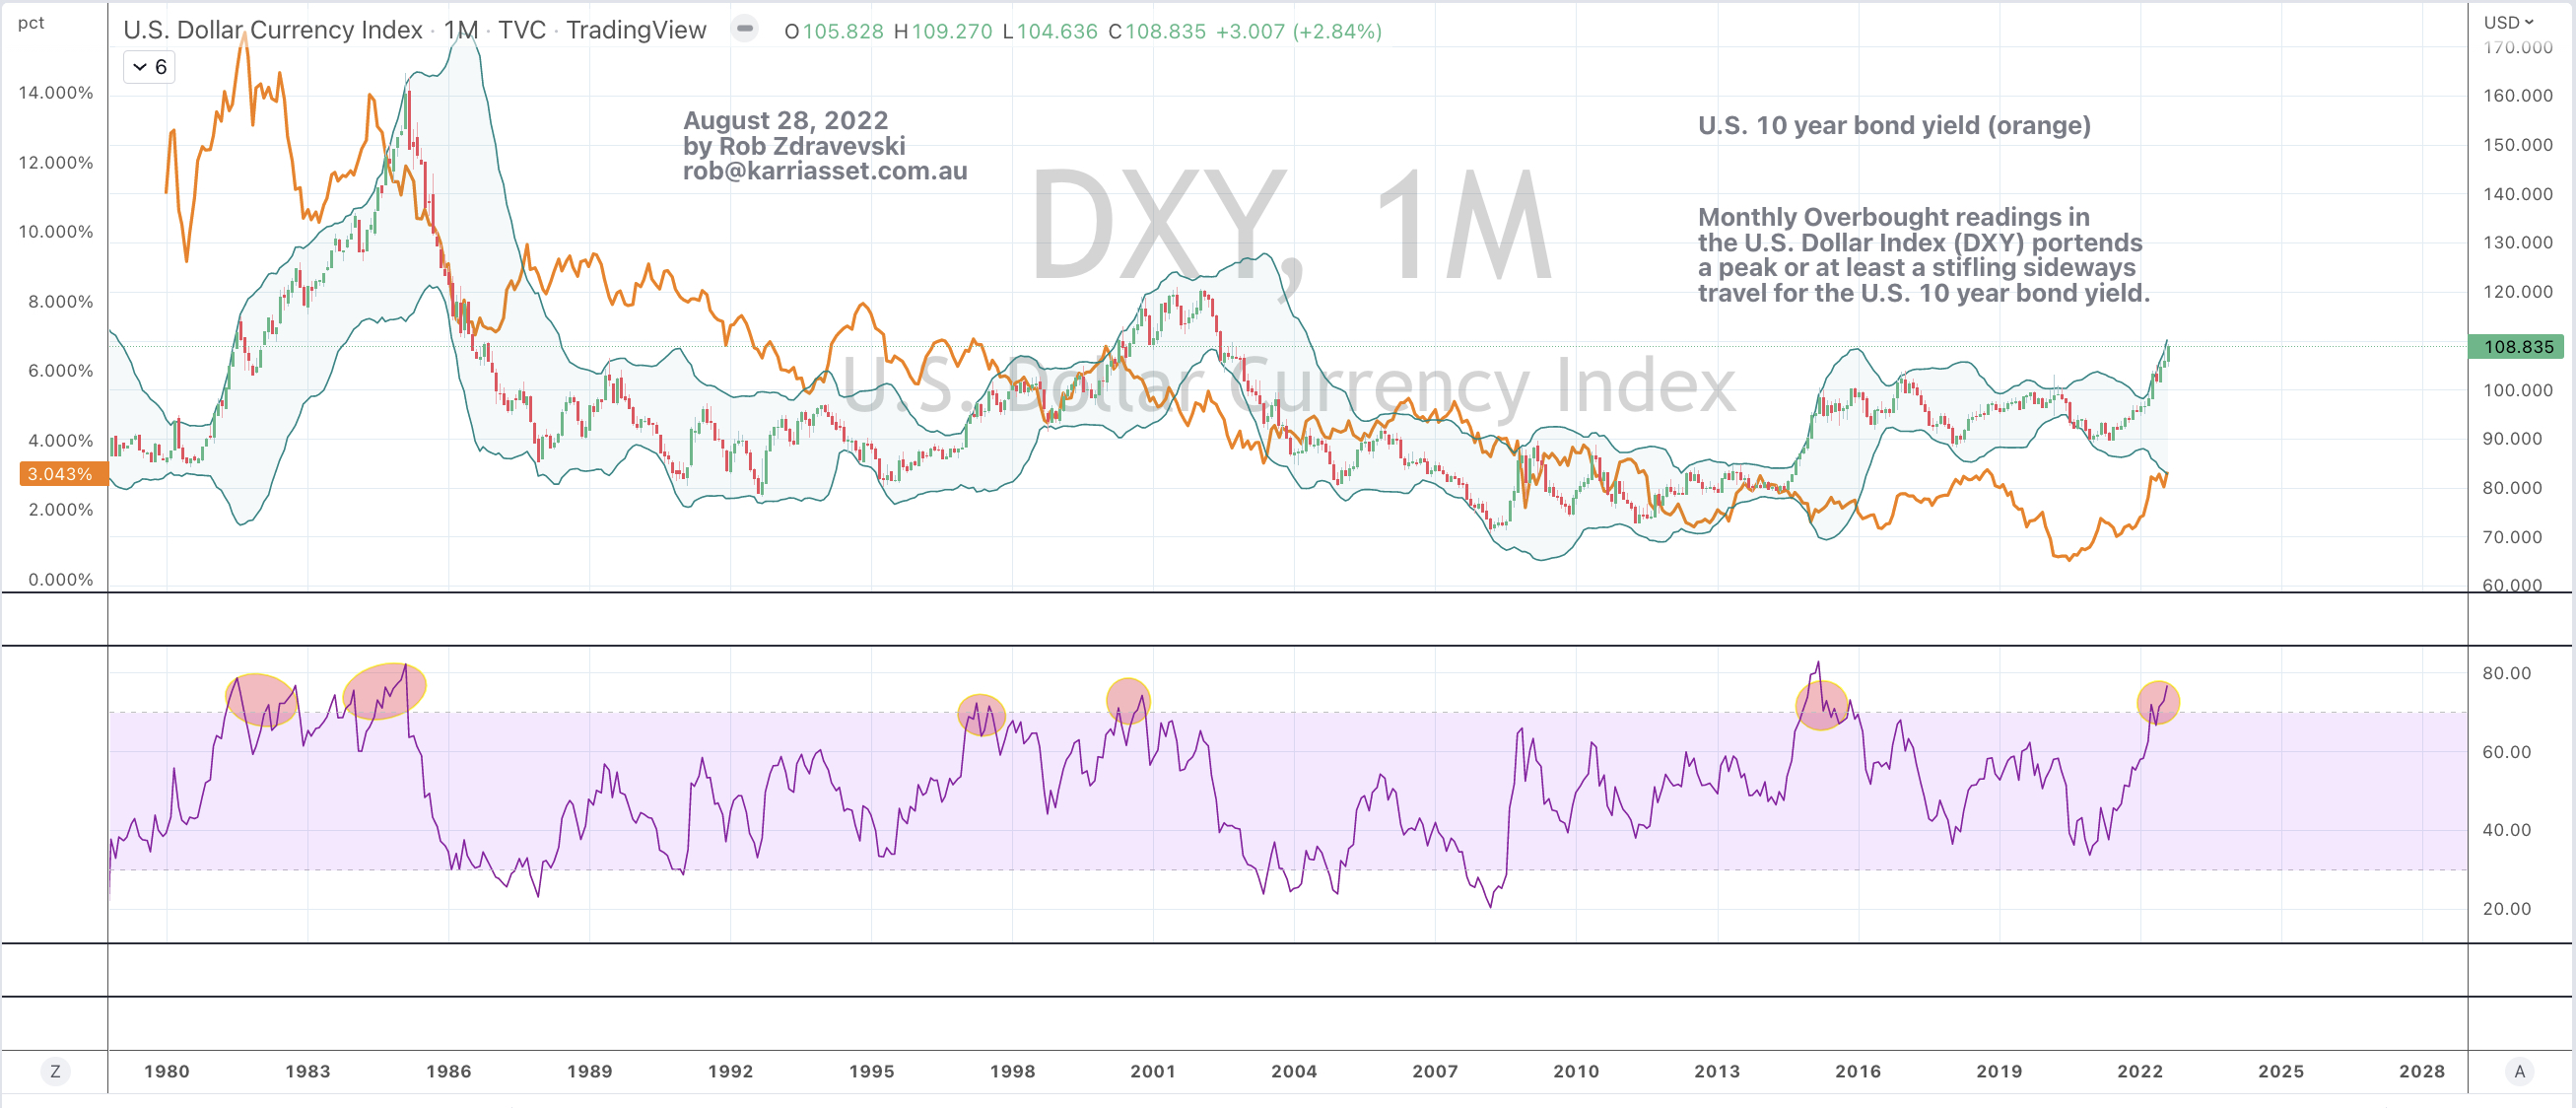
It is the 4th notable time that the DXY hits a monthly Overbought RSI reading.
Monthly Overbought readings in the U.S. Dollar Index (DXY) portends a peak or at least some stifling and sideways travel for the U.S. 10 year bond yield.
Even through the rate hike mania of the early 1980’s, if you queued off the DXY peaks, the abatement in the 10 year bond yield held true.
Tip: RSI Overbought readings can stay Overbought for much longer than many expect.
August 29, 2022
by Rob Zdravevski
rob@karriasset.com.au
August 28, 2022 Leave a comment
In the April 15, 2022 edition of Macro Extremes, I noted that until that moment, the U.S. 10 year bond yield had never registered an Overbought reading on a Monthly basis…….and it stayed there for the past few months.
Furthermore, it coincided with the yield trading up to 2.5 standard deviations above its monthly rolling mean.
The chart below shows circles and boxes when it has hit both 2.5 and 3 standard deviations.
Why the reprise of this topic?
I don’t believe Jerome Powell’s 2022 Jackson Hole declaration that the Fed will earnestly raise rates higher will actually happen.
I won’t bother speculating whether rates are raised once or twice as 2022 comes to a close but I think Mr Powell is now trying to increase the rhetoric and use as much media messaging to help manufacture a slowdown or a decline in demand, if you will.
Yesterday’s note touches on the quantum of the rate increases from the troughs.
Even the peak of Volker’s hikes signalled the beginning of a ‘bottoming process’ for the equity market.
In fact, many of the peaks in the monthly chart below correlated with lows in the S&P 500.
August 28, 2022
by Rob Zdravevski
rob@karriasset.com.au

