This chart updates the percentage which the DXY Index is trading above its 200 Month moving average.
Rare air indeed !
This may be the 7th inning, 8th or 9th….but it’s not the top of the 1st.
Incidentally, We are days away from closing the quarter and U.S. corporate earnings will be reported soon after. A reminder to look for management commentary in their earnings call about the effect the strong U.S. Dollar is having on their results.
The strong dollar is something the United States needs to be wary of because prolonged strength is adding to the probability of sustained inflation.
Commercial and military aircraft are costing the rest of the world let alone other U.S. goods and services.
More importantly, the majority of the major commodities are priced and traded in U.S. Dollars.
Rather than the Bank of Japan intervene and spend $21 billion (which is slightly more than the $15bn in U.S. aid sent to Ukraine) to buy and support their Yen…..
and rather than wait for the U.K. government or the Bank of England to crank up rescue packages to support the British Pound…
perhaps the U.S. Treasury (Janet Yellen) should start making announcements designed to weaken their currency?
Such action may possibly help your ‘friends’ in the G-10; help your own bond market (your cost of capital) and make the world a better place.
Keep in mind that a U.S. 10 year bond yielding 3.85% in isolation isn’t a concern until you ponder that the bonds of other nations are seemingly trading a ‘better creditworthiness’ of 3%.
But then again, the market may end up fixing it all for you.
The Bearish USD ETF is exhibiting extremes including being at the higher quintile of historical percentages which it’s trading below its 200 week moving average.
Anecdotally, all I am hearing is about U.S. Dollar strength. Now (the financial media) are calling referring to it as “King Dollar”.
Remember when 2 years ago, they were calling the demise of the U.S. Dollar?
So, Oracle’s ‘currency headwind’ equated to nearly 15% of its quarter’s earnings.
No small change and it is a factual effect that the U.S. Dollar’s strength is having on American corporate earnings.
An extract from Oracle’s Q1 Fiscal 2023 earnings transcript is,
“The currency headwind this quarter was much higher than the 3% headwind that was present when we gave guidance. It was actually 6 points, even though due to rounding, it may look like 5%, and that’s a currency headwind to total revenue. It was, in fact, 6 points. And yet, we still exceeded our forecast on a reported basis, and we beat our constant currency revenue forecast by $200 million. We saw similar currency headwinds in EPS, which had an $0.08 negative effect, much worse than the $0.05 headwind present at the time of guidance in June.”
But with present USD strength being extended and stretched, in the spirit of positioning for ‘where the puck is going to be’, I’ll look for the contrarian effect to company earnings in the coming quarters.
In the meantime, well run Japanese companies should be ‘minting’ profits from their increasing competitive position of having a monumental weaker Yen.
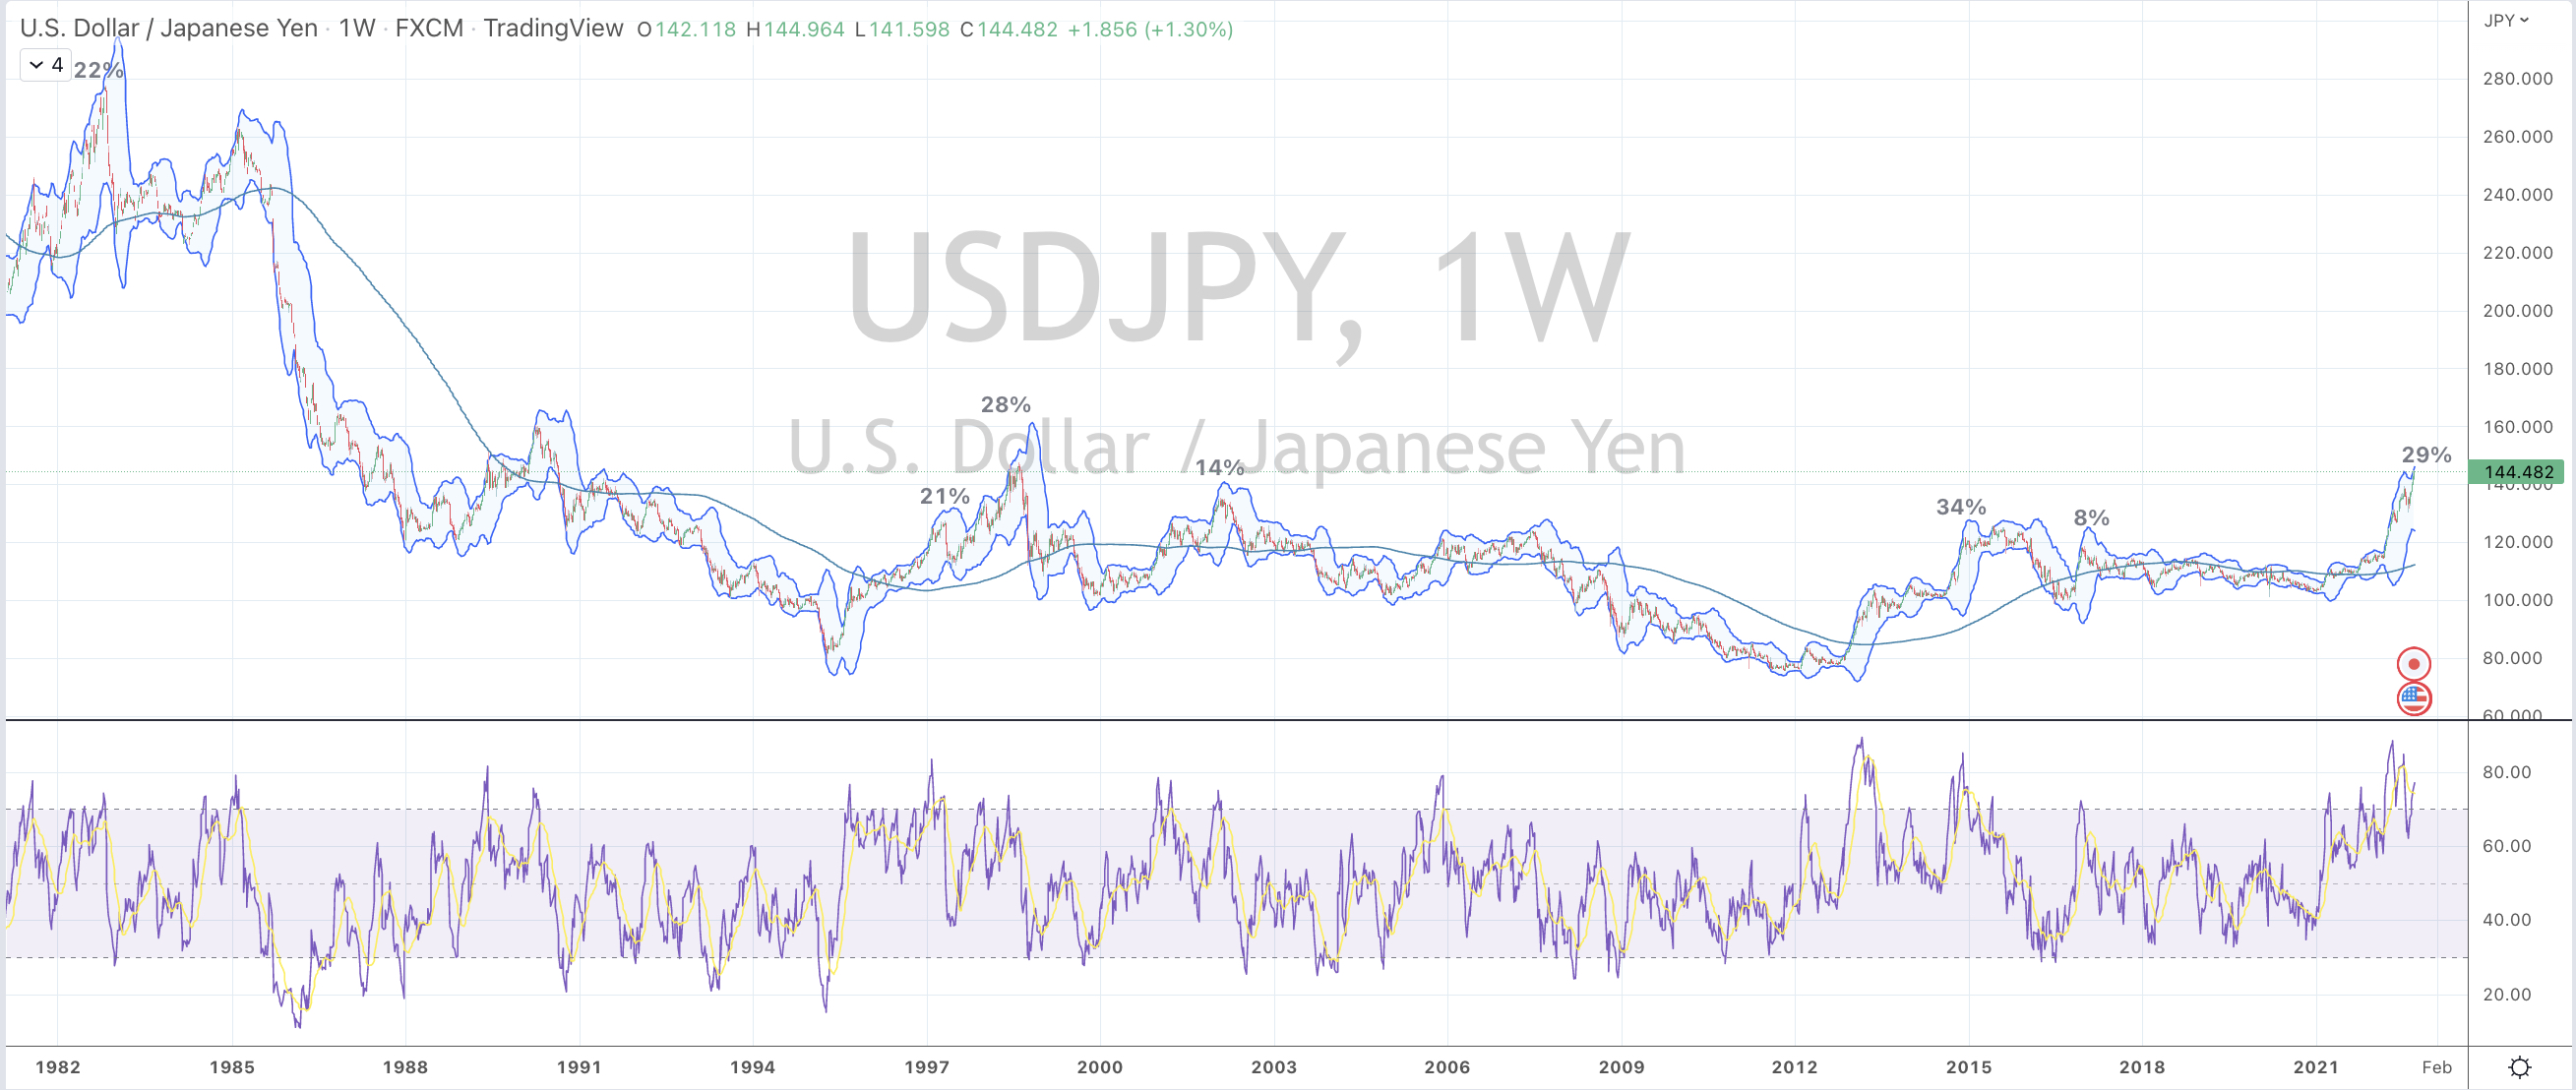
The chart below shows the U.S. Dollar at a historically stretched moment of strength.
Such extreme percentages above its 200 week moving average coupled with weekly overbought readings also coincide with a peak in the Australian 2 year bond yield and a trough in the CRB (commodities) index, to only mention a couple.
Aussie companies selling products into Europe, the UK and Japan have been seeing weaker receipts, while those selling to U.S. customers or in USD denominated products (commodities) are booking handsome profits on favourable currency differentiation.
Japanese and European assets are considered cheap for holders of Australian Dollars while Americans (and their corporations) may see Australian assets as being ‘on sale.
Expect those respective benefits to wane while these ‘extreme’ currency movements correct and consolidate.
On a side note, the almighty strength of the U.S. Dollar seems to be a surprise……
2 years ago, I wrote this note when I remember reports of the pending death of the U.S. Dollar to be palpable.
Peaks in the USD/AUD have corresponded with troughs in the CRB Index (give or take 1-3 months)
Keep in mind that the Commodity Research Bureau (CRB) Index calculates the pricing of a basket of 19 commodities with energy contracts comprising nearly 40% of the weighting.
In my recent writings and observations, the energy complex is the last holdout in the current mean reversion in commodity prices.
This and the markets are currently telling me……
1) the USD strength is closing in on a peak, while allowing for one more surge higher (read: probability that AUD sympathetically moves a little lower too)
and
2) I expect energy prices to have one more lower leg or wave (RBOB Gasoline has nearly completed its)
So, I am preparing for another moment where this peak and trough synchronise.
…..the chart below reiterates moments when the U.S. Dollar Index (DXY) hits a Monthly RSI Overbought reading along with a 2.5 standard deviations above its rolling monthly mean……
but I have also added a notation to the chart showing the percentage amount that the DXY was/is trading above its 200 MONTH moving average.
The emphasis in this study is that it’s on a Monthly basis, being much longer than my usual ‘weekly’ observations. Day traders need not apply.