And now it’s the ‘mother’ of a peak in Natural Gas
June 7, 2022 Leave a comment
On April 30, 2021, I wrote a note about the ‘mother’ of all breakouts.
The topic was about the price of Natural Gas.
At that time, Natural Gas was trading at $3.00.
The note (see link below) showed a pending trend reversal in a 20 year chart, not some little 3 week observation.
Then, the July 22, 2021 note was telling readers about taking some profits at $4.07
then on October 6, 2021, I wrote about selling the remainder of the position at $6.25
In the first chart below, I have placed annotations which follow the timeline of each of these posts.
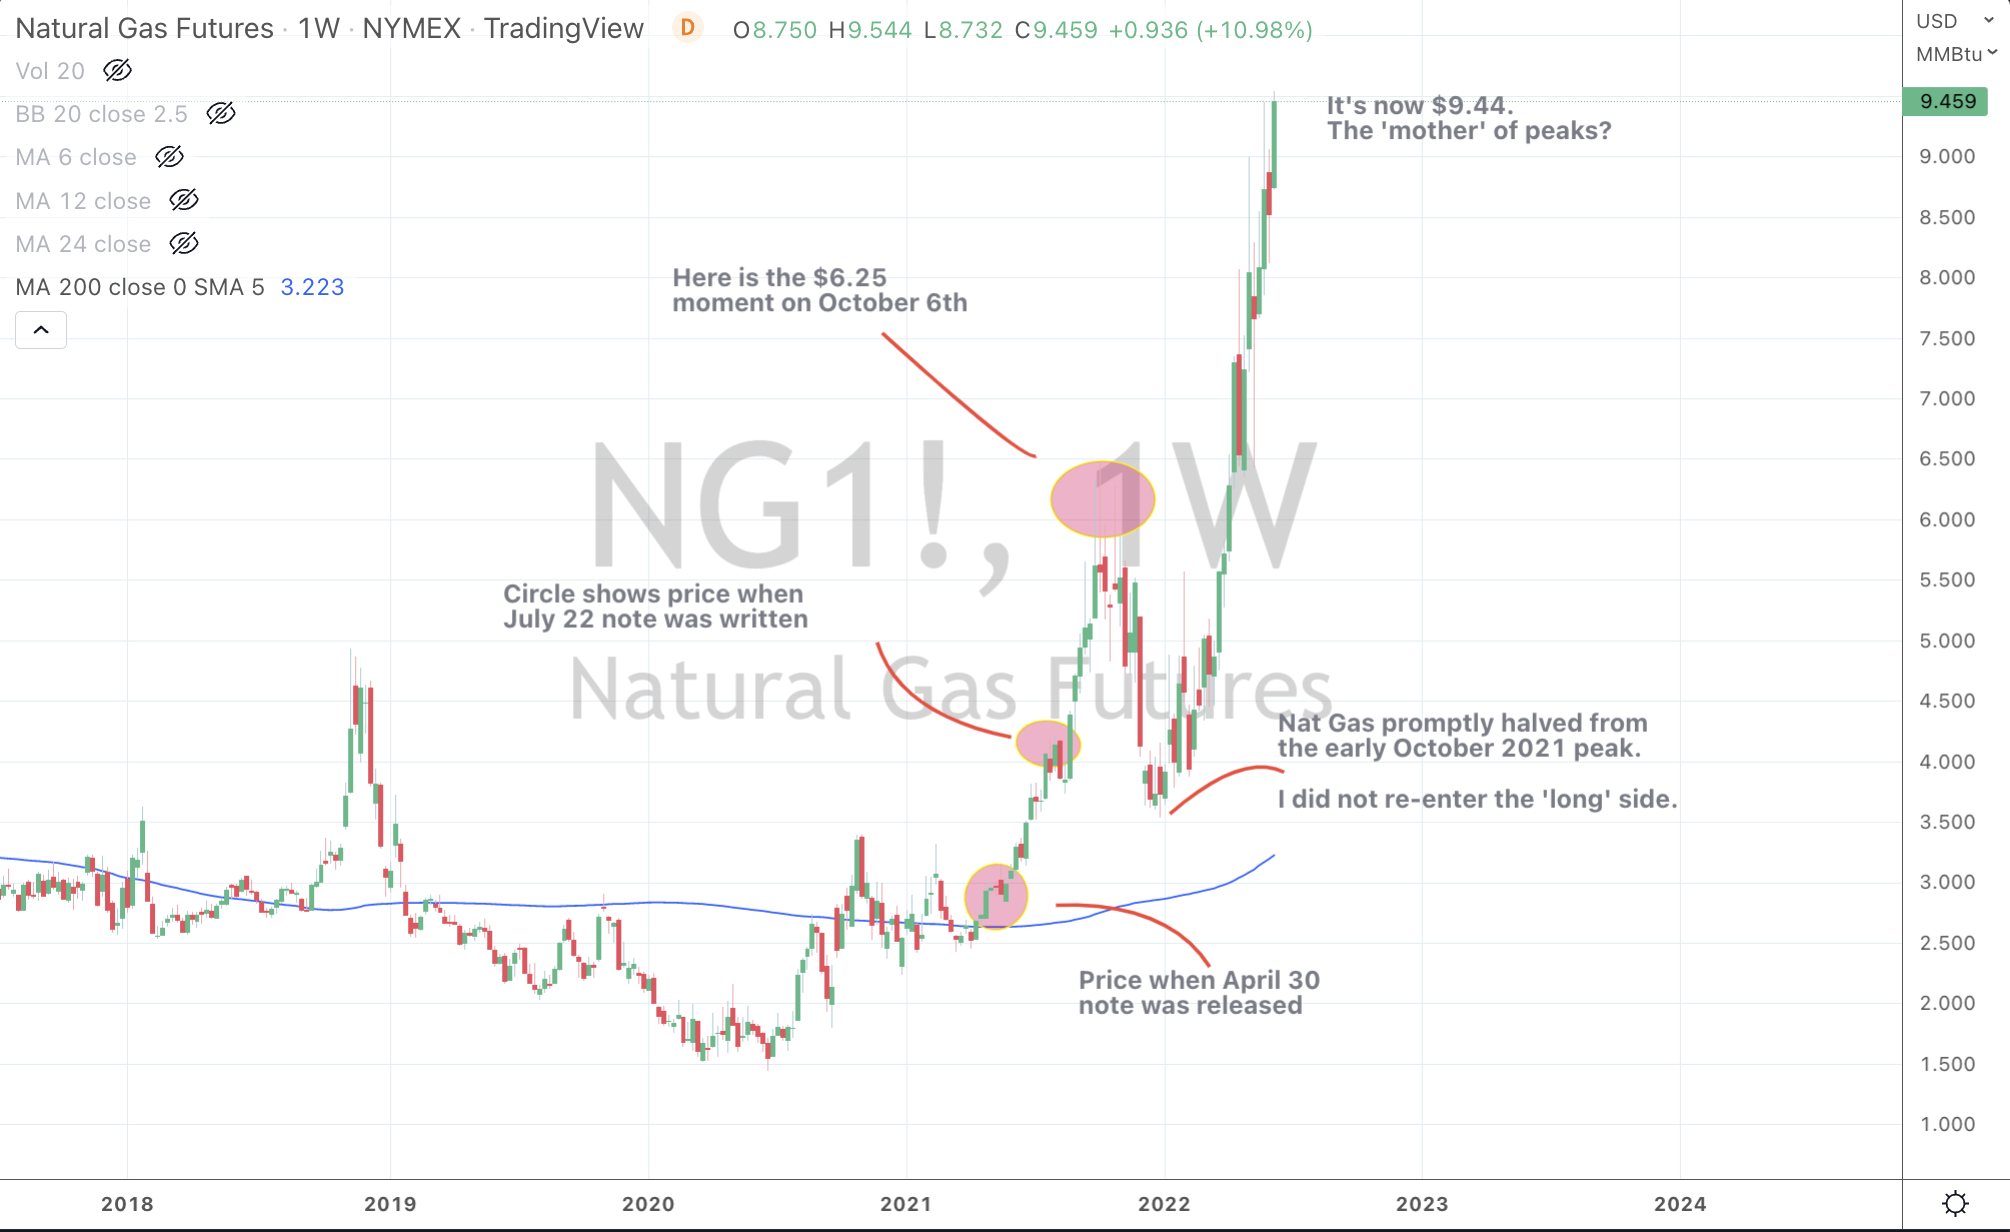
Following the October 6, 2021 call of selling the balance of the position, the price of Natural Gas nearly halved within 3 months, falling to $3.54.
Whether it was the markets way of correcting a parabolic move or sorting out the ‘unnatural’ owners and late-comers, the price decline didn’t satisfy and reach my re-entry points and so…….I didn’t re-enter the trade.
Today, the Henry Hub Natural Gas price is $9.50
From the New Year low of $3.54 (this timing coincided with the peak in the S&P 500), Natural Gas performed a second surge to the current price of $9.50.
There is no crying over spilt milk here !
All within 12 months, the Natural Gas price doubled, then halved, then tripled….
Hardly normal stuff.
But I will now call the opposite of my April 30, 2021 note,
with my various indicators coupled with fundamental observations,
for whether Henry Hub Natural Gas trades at $9.50 or $10.50, heed the extreme in this pendulum.
It’s the now looking like the ‘mother’ of all peaks.
The 20 year chart is below.
June 7, 2022
by Rob Zdravevski
rob@karriasset.com.au

