Dr Copper says…..
January 13, 2026 Leave a comment
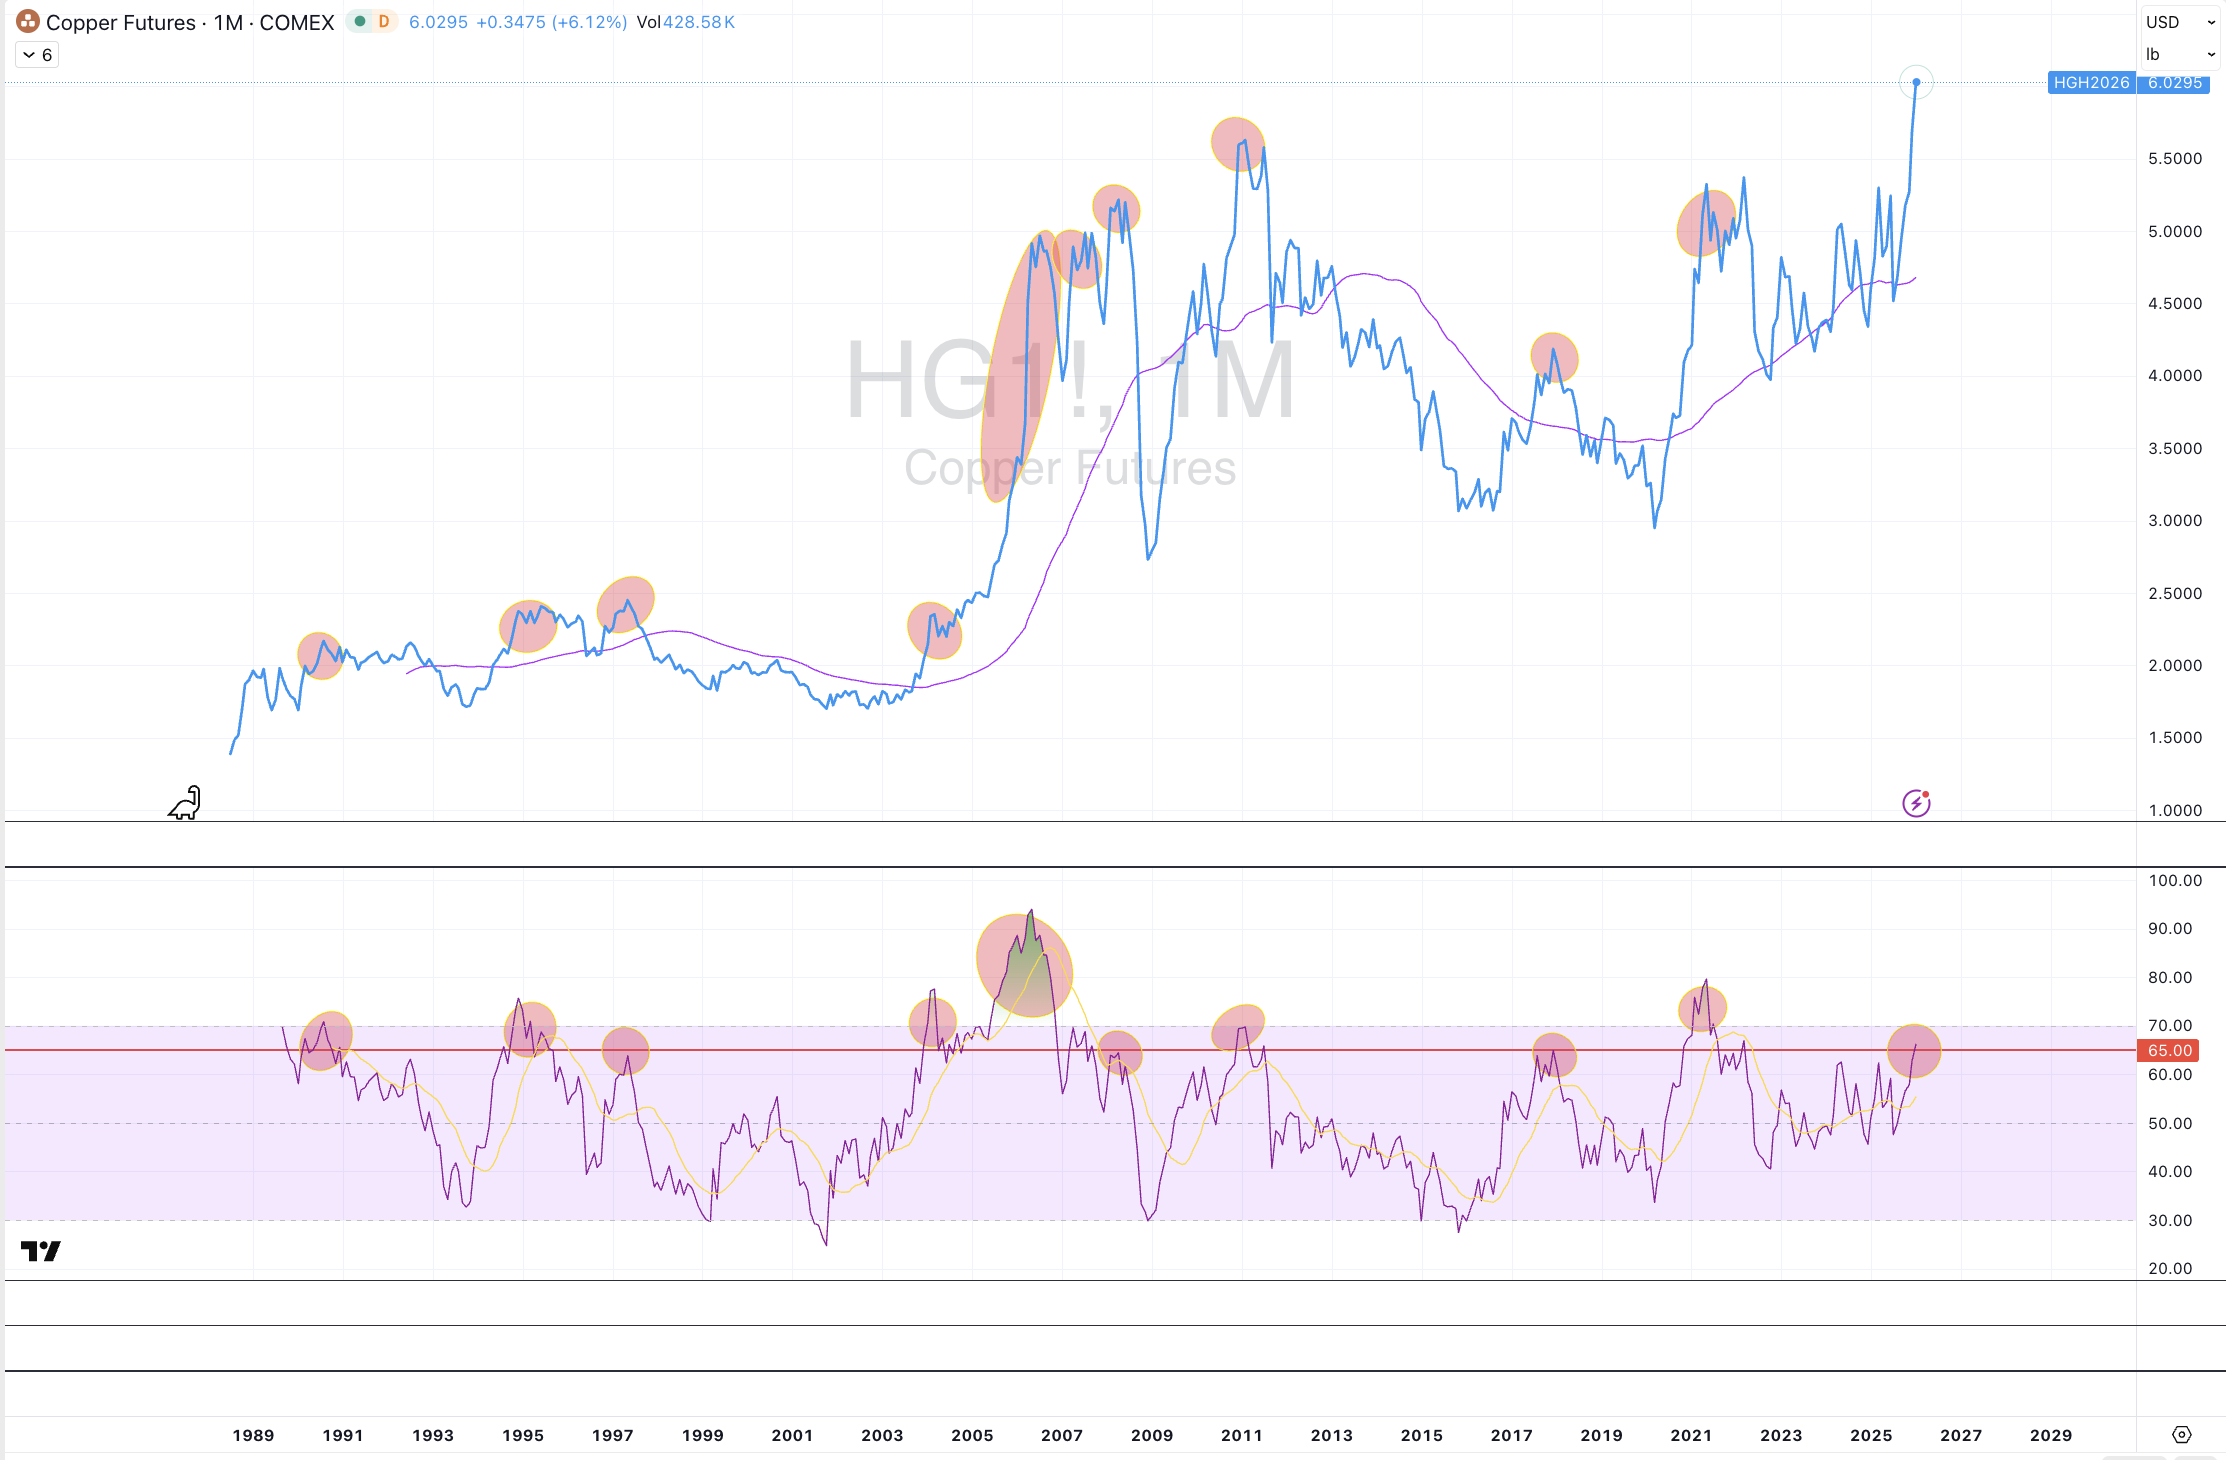
I don’t think it’s the best time to buy (or chase) Copper when the circles start appearing.
January 13, 2026
rob@karriasset.com.au
#meanreversion
#parabolas
Trying to hear what's not being said
January 13, 2026 Leave a comment
I don’t think it’s the best time to buy (or chase) Copper when the circles start appearing.
January 13, 2026
rob@karriasset.com.au
#meanreversion
#parabolas
February 27, 2025 Leave a comment
The attached study shows the weekly stock price of Australian mining company, IGO Group and the percentage extremes it has traded either side of its 200 week moving average.

May 3, 2024 Leave a comment
Cocoa prices have fallen 40% over the past 2 weeks.
#Cocoa ($7,070) is no longer more expensive (per metric ton) than #Copper ($9,700)
May 3, 2024
April 25, 2024 Leave a comment
4 months ago, I posted this note about Anglo American
It was titled, “Bugger this, take me private”
Today, #AngloAmerican (AAL) has said it received a #takeover offer from #BHP.
#AAL is now 48% higher since that December 13, 2023 note.
M&A activity is increasing and in this case, it is easier to buy existing copper and nickel mines, rather than developing them. BHP would also get 85% ownership of De Beers Group (diamonds) too.
If this deal closes, they won’t exactly become ‘private’ but certainly eases the quarterly investor and analyst palaver for AAL management.
Although, it is early at this dance, it’s always possible that a privately held suitor emerges with buying interest that doesn’t require any de-merger of Anglo American’s divisions or business lines.
April 25, 2024
by Rob Zdravevski
rob@karriasset.com.au
April 19, 2024 Leave a comment
Just a reminder that the metric price per ton of Cocoa ($10,895) is still more expensive than the metric ton of Copper, which is trading at $9,800.
While you can recycle copper, it’s supply is tempered because amongst other things, it can take 10+ years to bring a new mine into production.
Cocoa, on the other hand, is “replenished”. There are 2 harvests per annum.
April 19, 2024
March 26, 2024 Leave a comment
The two most notable parabolic price moves in recent times is being seen in the price of Cocoa and NVIDIA shares.
Both prices are trading at stratospheric percentages above their 200 week moving averages.
Cocoa is trading 3.5 standard deviations above its rolling monthly mean and even more astonishing, at US$9,950 per ton, it is more expensive than Copper which is trading at US$8,870 per ton.
Mean reversion or mean convergence?
Gravity is real.


March 19, 2024 Leave a comment
The run in Copper has been seen and it may be full, for the time being.
On July 18, 2022 (20 months ago), I signalled a long trade in Copper expressed through the shares of #Sandfire Resources (SFR.ASX).
Since then, #SFR‘s stock price has risen from $3.75 to its current level of $8.54.
The ‘fat part of the trade’ has been seen.
Today’s price suggests a stock price which is trading at the upper end of its extremes.
On a weekly basis, SFR.ASX is overbought, trading at 2.5 standard deviations above its weekly mean and it’s at a stretched percentage above its 200 week moving average.
The hubbub around the copper price (and related companies) paints a similar picture, while I specifically think there is a bull trap in #HG1!
In corporate finance land, this is a time when its advisable for copper related companies to conduct a capital raising (new share issuance) to either reduce debt or fund capital expenditures plans or perhaps use your (improved) currency, name your shares to make an acquisition.
March 19, 2024
by Rob Zdravevski
Karri Asset Advisors
rob@karriasset.com.au

January 11, 2024 Leave a comment
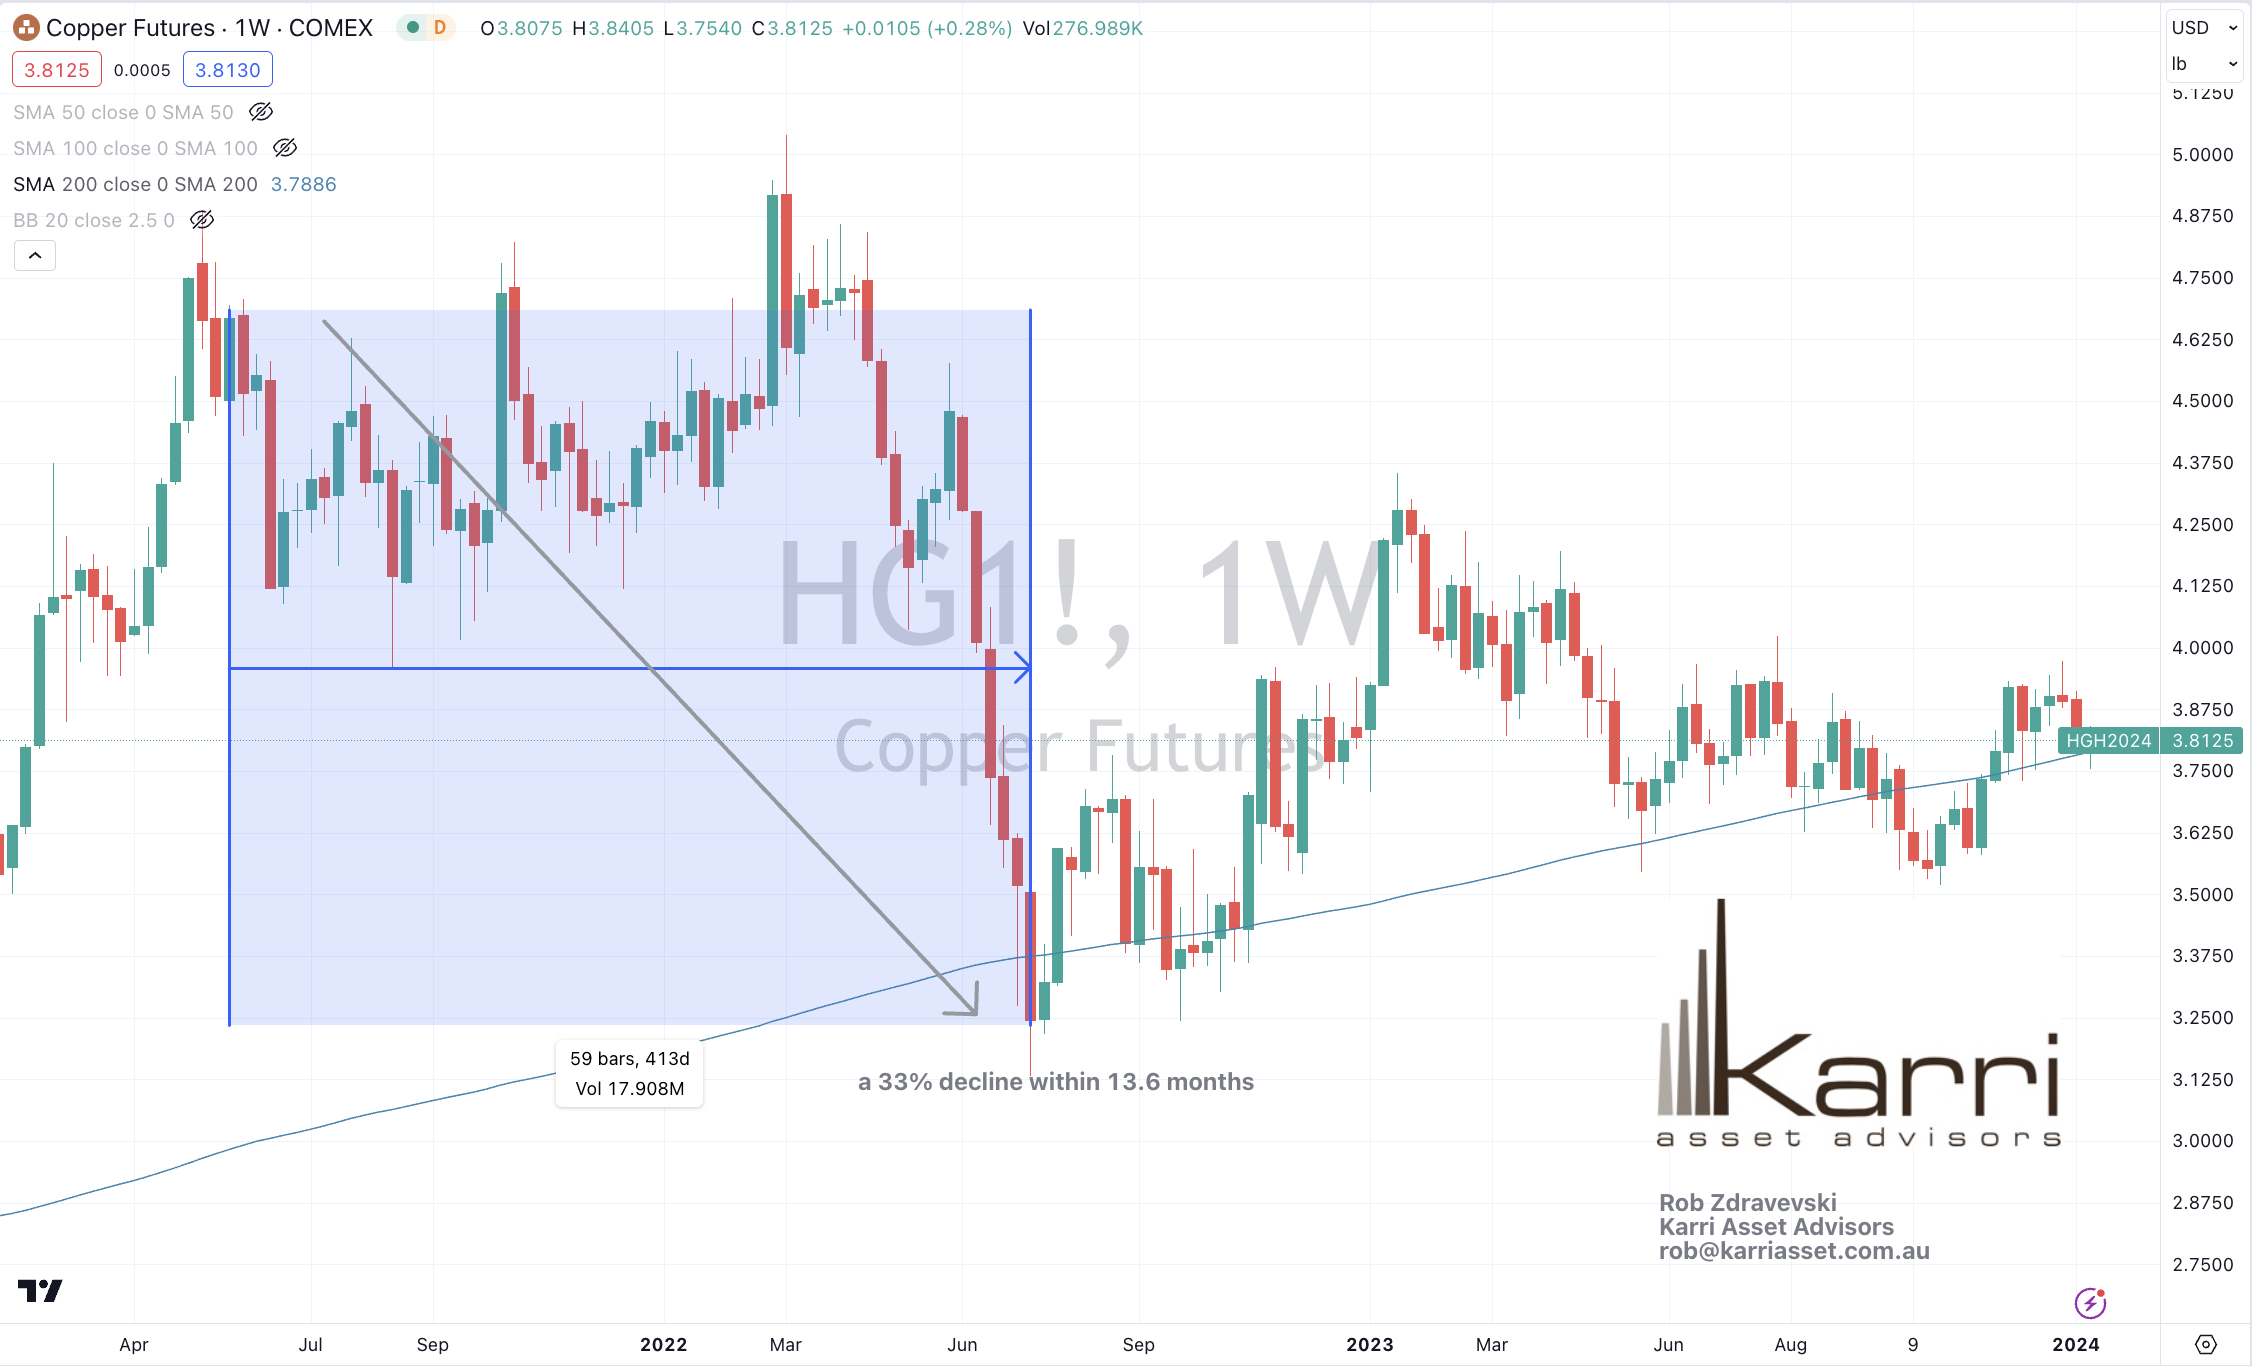
Copper fell 33% as per my quote in this S&P Global Market Intelligence article (published on May 20, 2021) which featured my non-consensus opinion that the price of Copper would decline “by a third within 10-14 months”.
Within the article, I furthermore cited its stretched levels above its 200 week moving average.
Aluminium prices suffered a similar fate.
The chart below shows the time frame that copper fell 33.4% within 13.6 months from the date the article was publishing……..whaddayaknow, it mean reverted down to its 200 week moving average.
At that moment (14 months later) Copper turned into a ‘buy’ opportunity.
This weekend, clients will be receiving my latest view.
January 11, 2024
by Rob Zdravevski
rob@karriasset.com.au
May 30, 2023 Leave a comment
In this note on March 16, 2023 (March 15, U.S. time), I suggested that shorter-term interest rates would start to rise when the Copper/Gold Ratio trades 2.5 standard deviations below its weekly mean and implies a poor moment of timing for those buying bonds.
As a follow up, the chart below shows what has happened to the U.S. 2 year bond yield since then.
Having risen from 3.9% to 4.68%, that extreme standard deviation low in the Copper/Gold Ratio did represent a ‘bull trap’ for bond buyers.
May 30, 2023
by Rob Zdravevski
Karri Asset Advisors
rob@karriasset.com.au

May 4, 2023 Leave a comment
The Comex Copper price (current forward month is $3.86) is giving me an embryonic sell signal.
This means its early and the trend is lacking strength….because it’s early.
It’s not a ‘grand daddy’ of sell signals but one that needs to be watched, possibly to washout the participatory and meandering players before longer term bulls get set.
However, lower copper prices also have a hand in preceding lower bond yields, weaker GDP readings, lower commodity sensitive currencies and a decline in stock prices.
Although, this will be a timing thing.
May 4, 2023
by Rob Zdravevski
rob@karriasset.com.au
