Mean reversion beckons for NVDA and Cocoa
March 26, 2024 Leave a comment
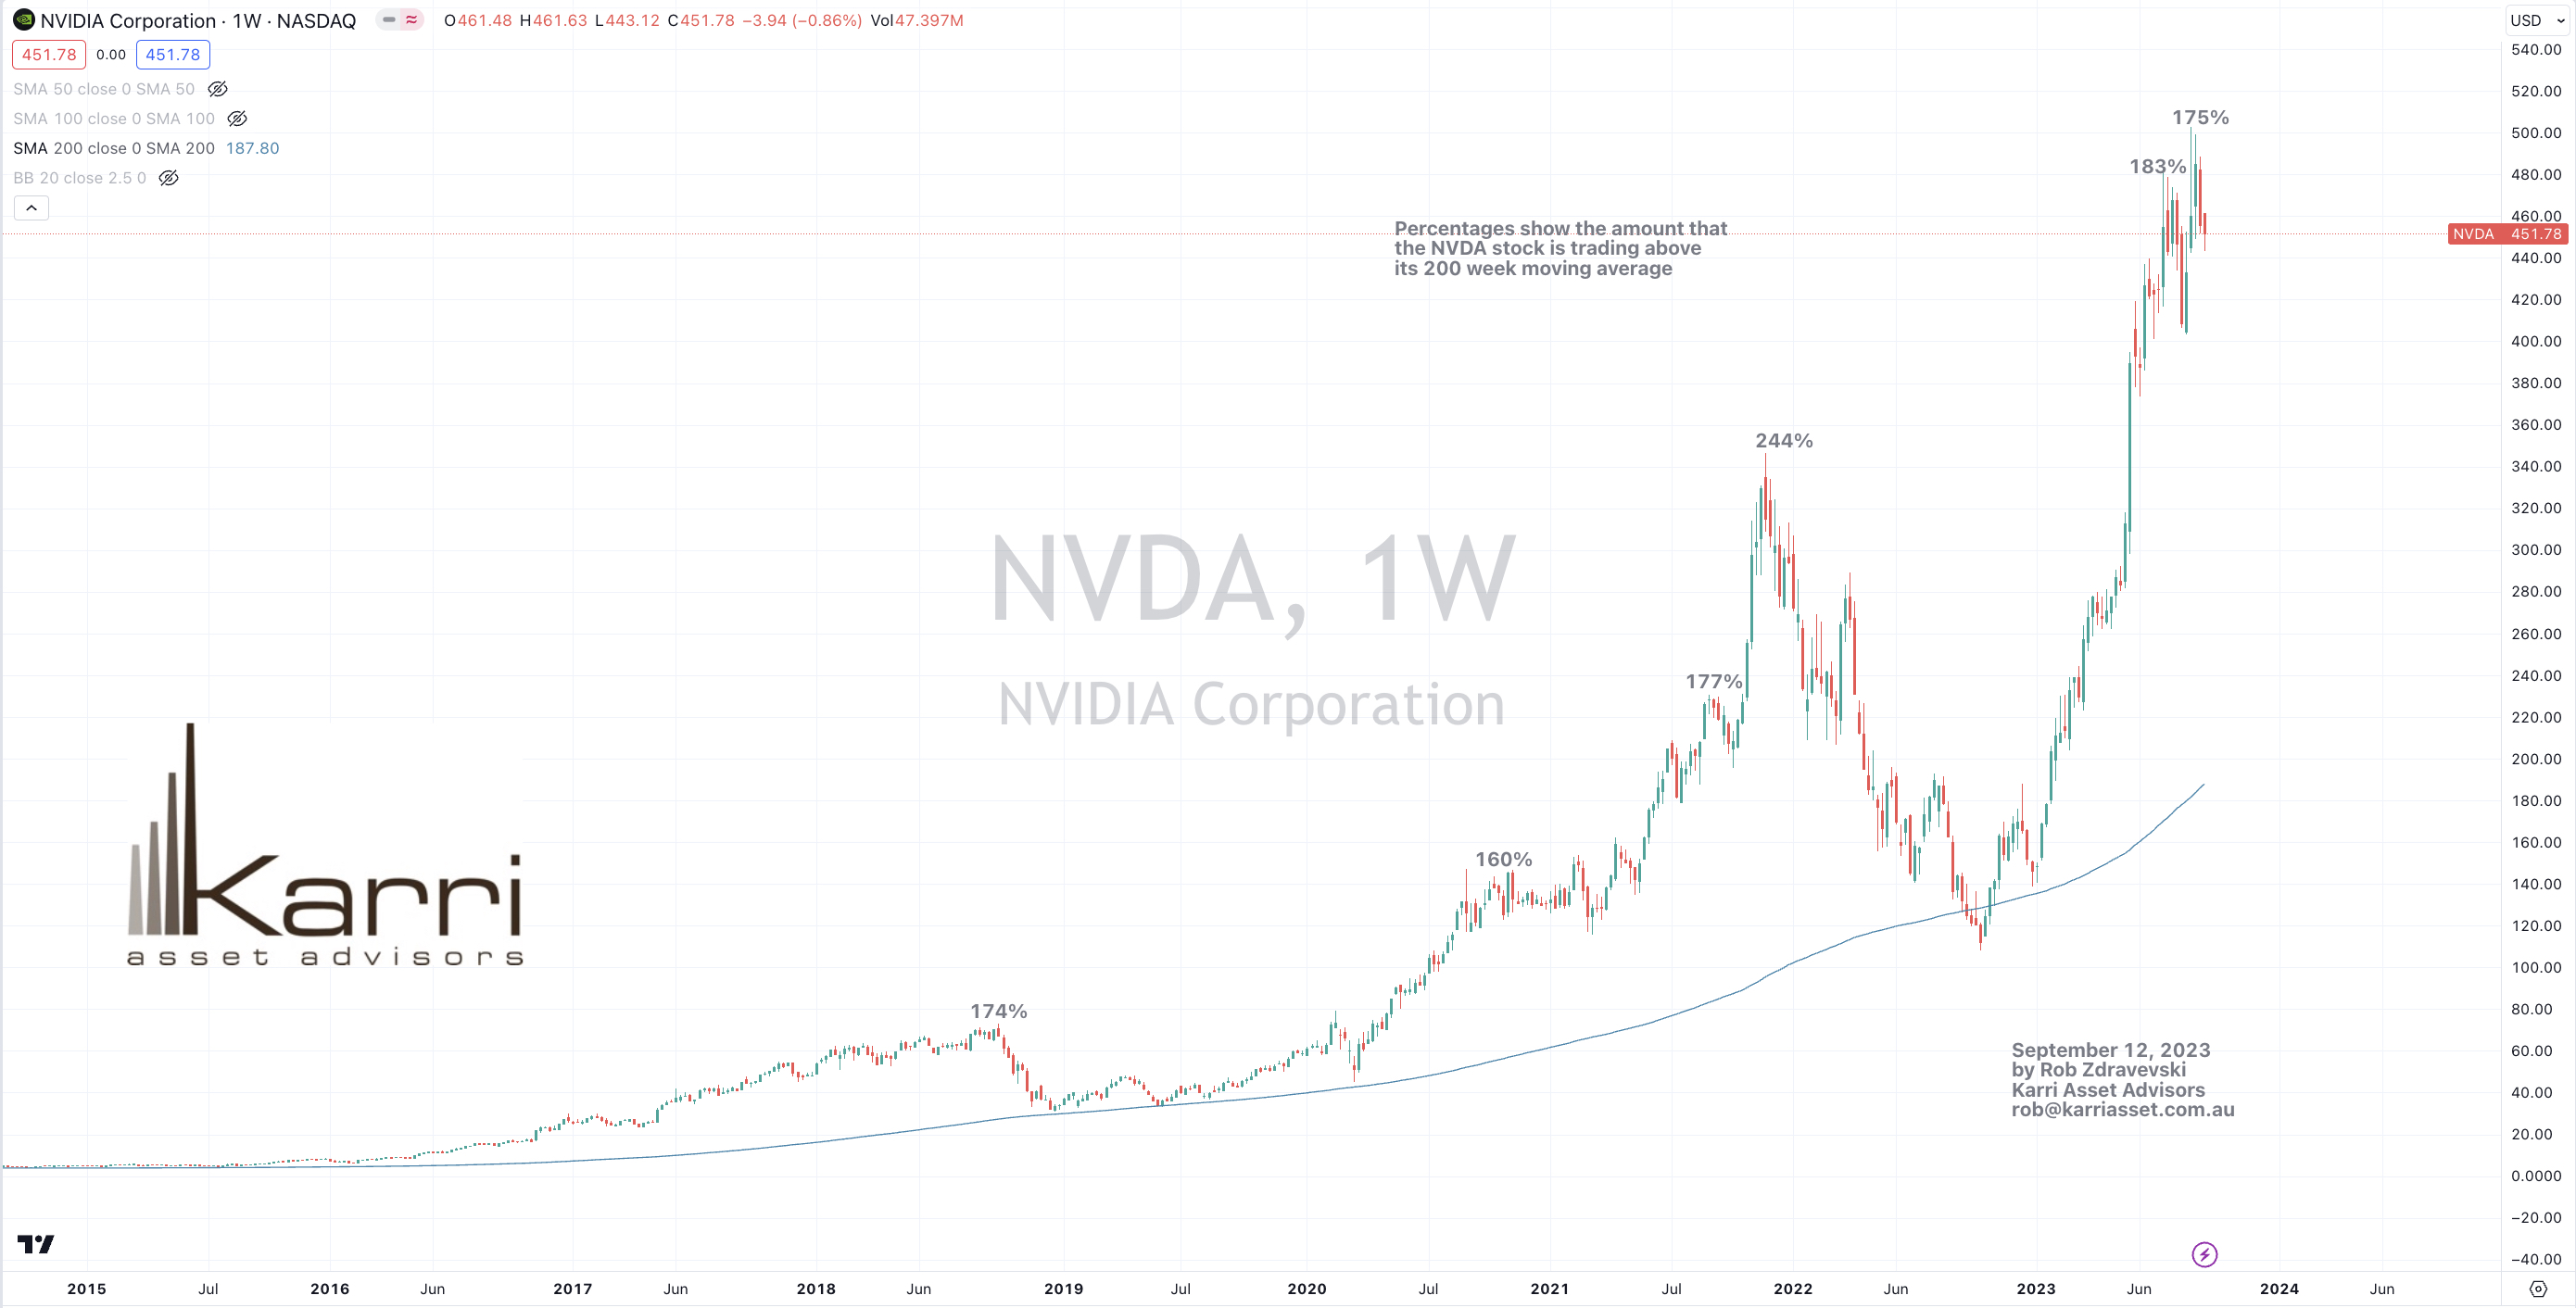
The two most notable parabolic price moves in recent times is being seen in the price of Cocoa and NVIDIA shares.
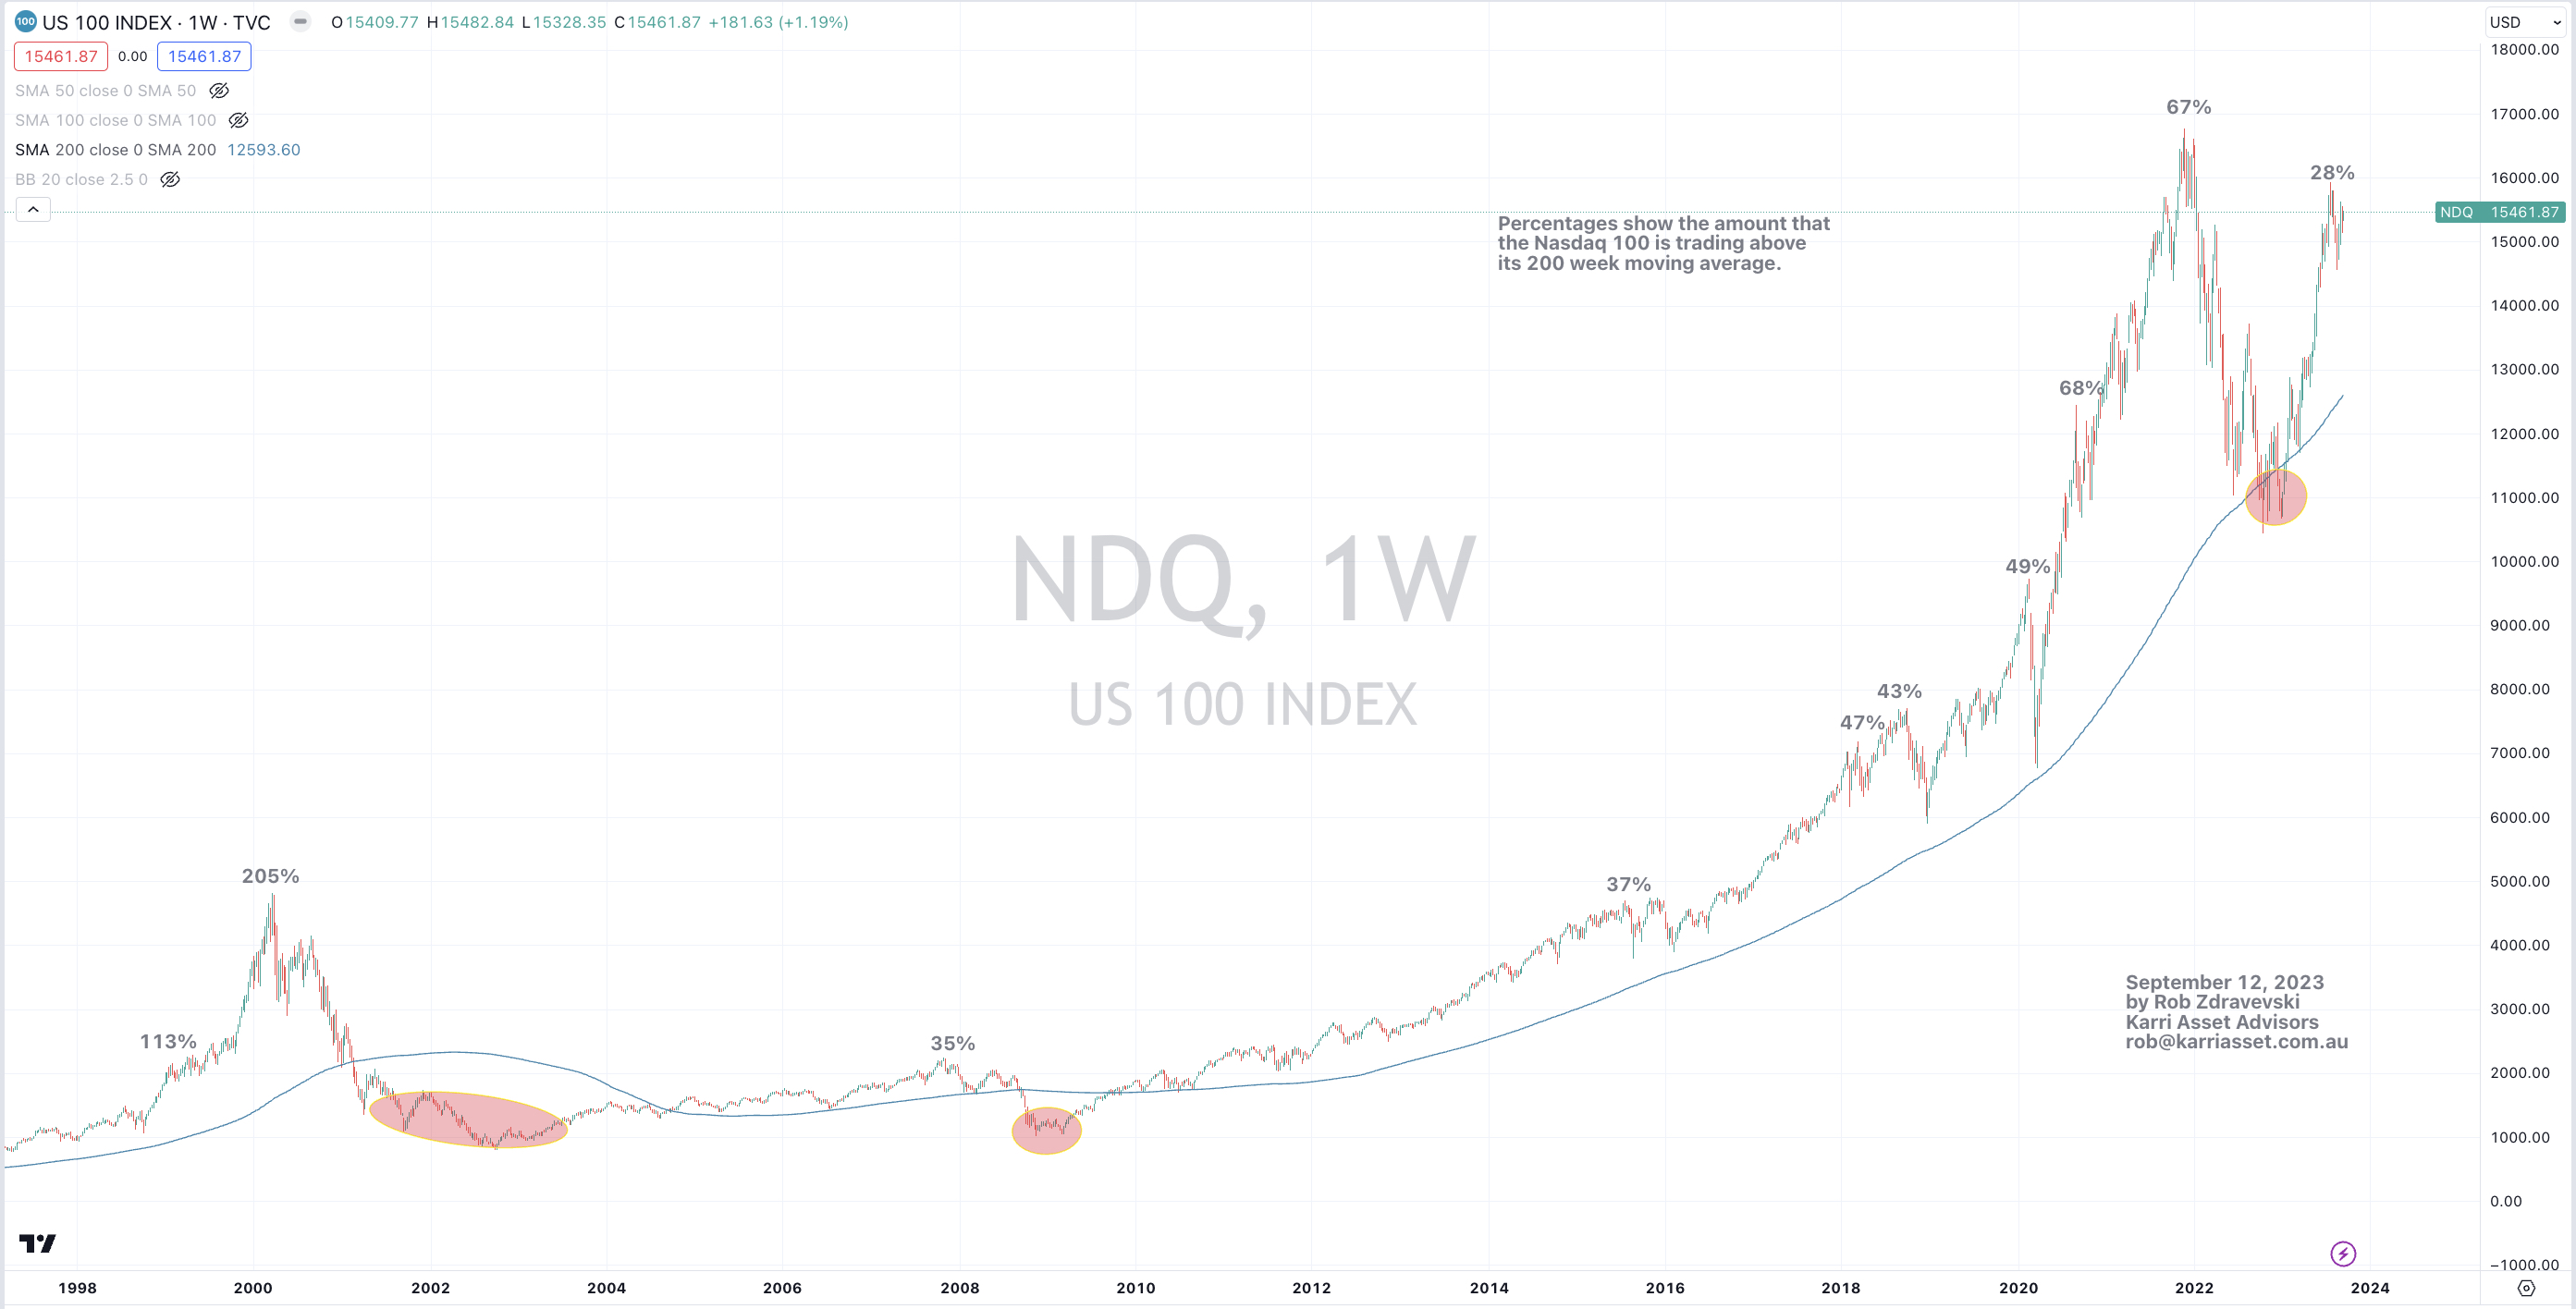
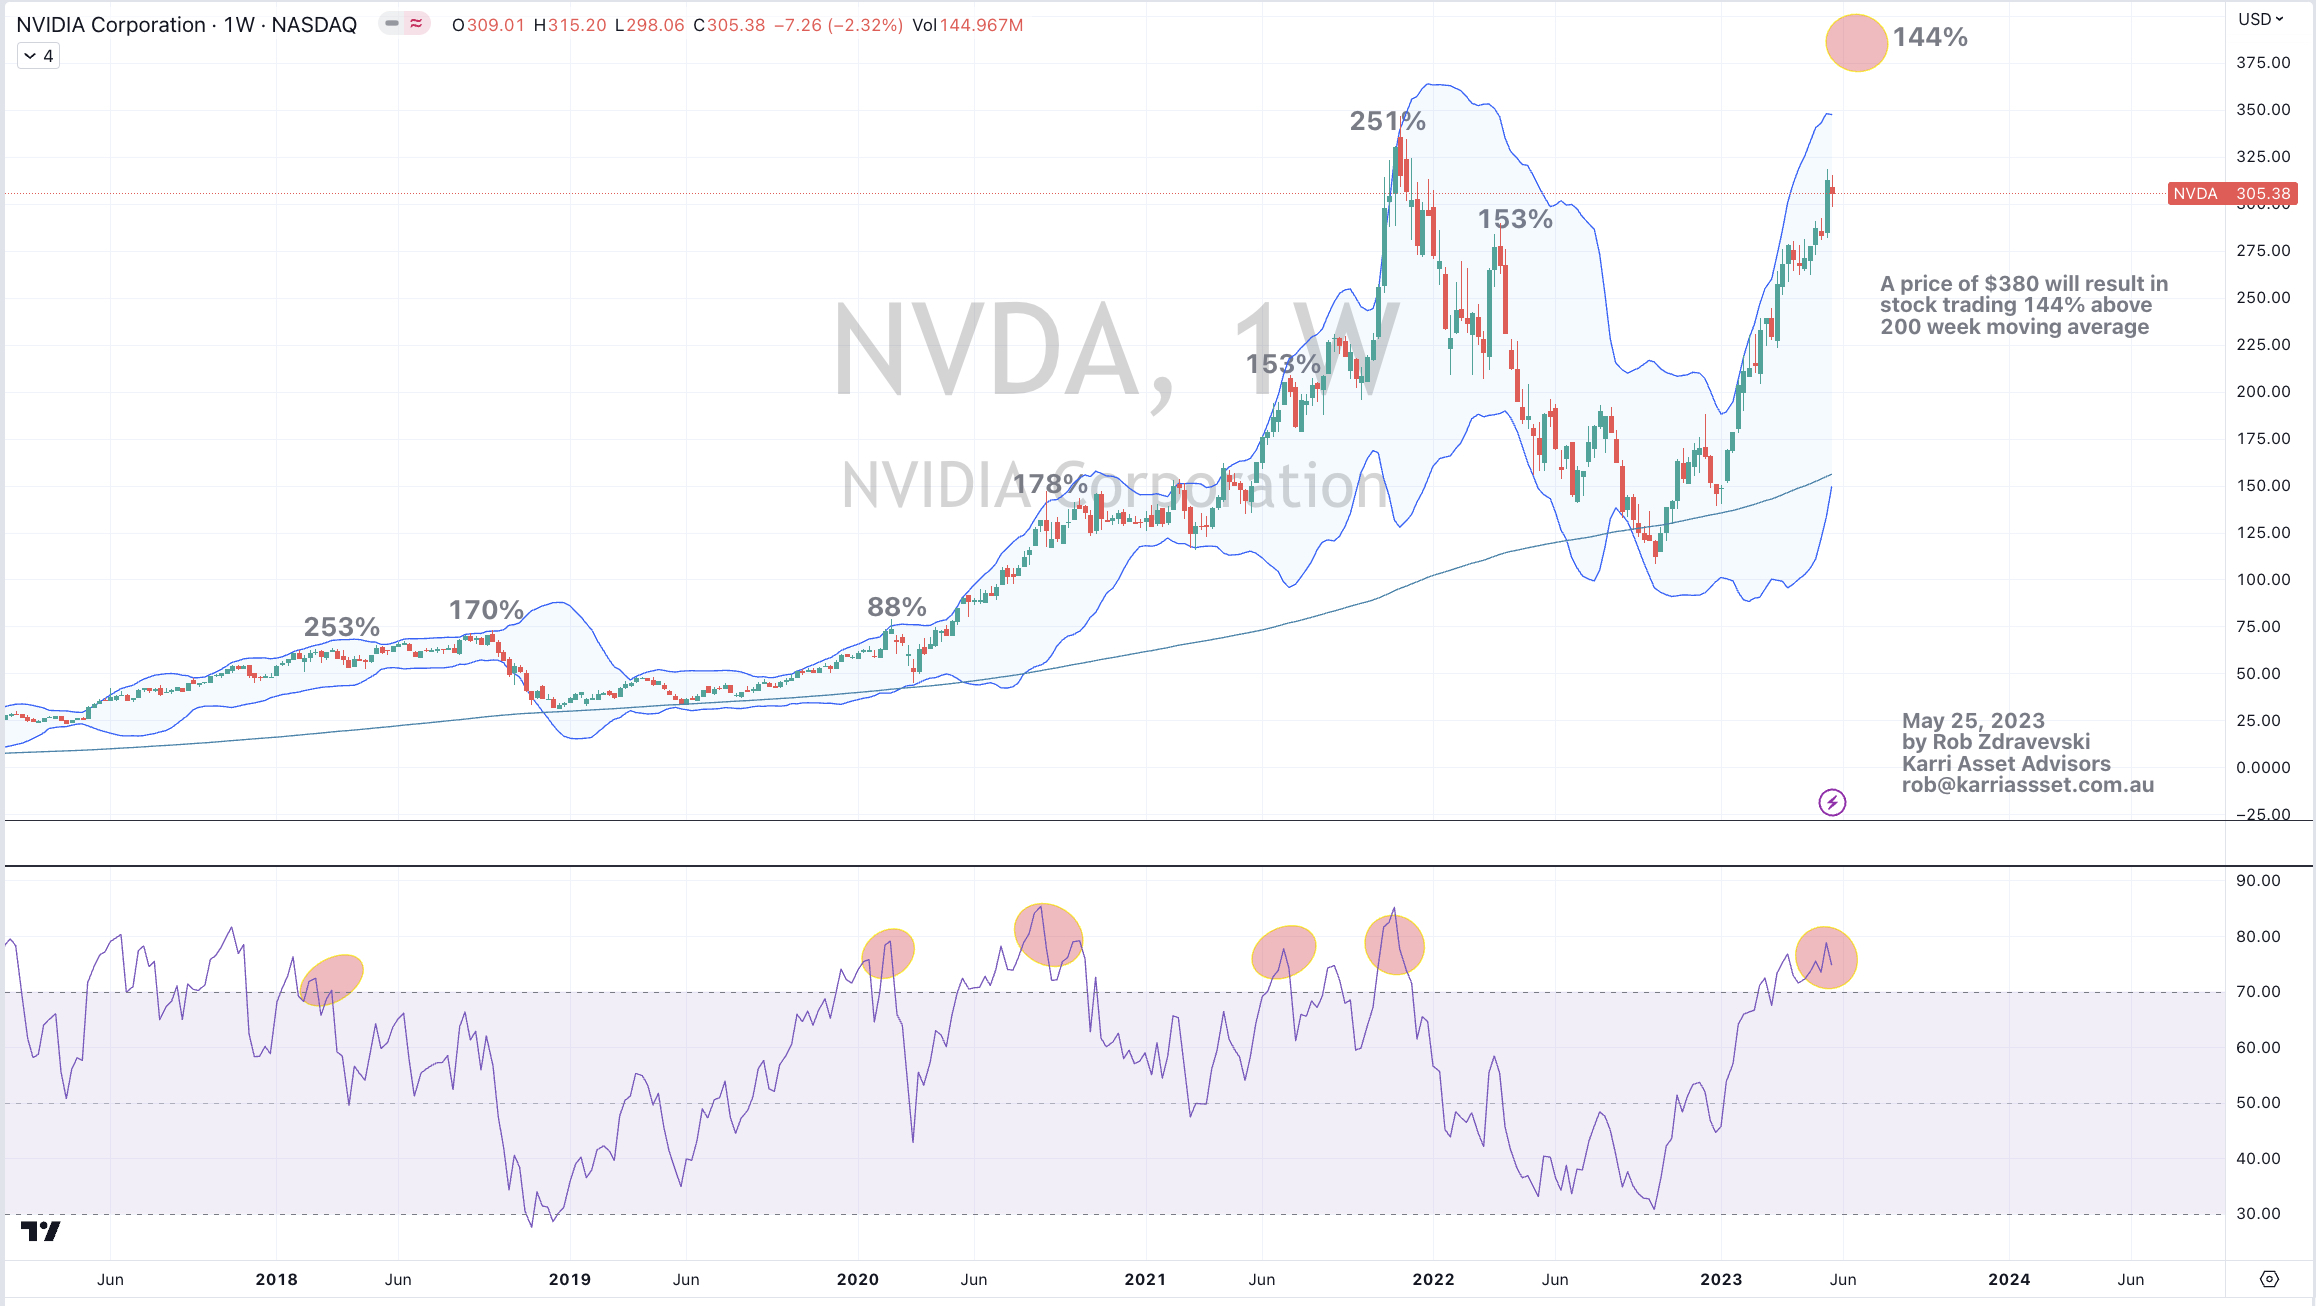
Both prices are trading at stratospheric percentages above their 200 week moving averages.
Cocoa is trading 3.5 standard deviations above its rolling monthly mean and even more astonishing, at US$9,950 per ton, it is more expensive than Copper which is trading at US$8,870 per ton.
Mean reversion or mean convergence?
Gravity is real.