When the circles represent an overbought condition for CHF/AUD on a Monthly basis, the rectangles on the main chart indicate an opportune moments for accumulating equities.
In this scenario, the S&P 500 is represented by the orange line.
The Australian Stock Exchange (ASX) has 2300 entities listed on it,
of which, 220 are ETF’s (Exchange Traded Funds) and a further 80 are LIC’s (Listed Investment Companies).
If we subtract those, we are back now to 2,000 ‘companies’.
Less the 90 companies which are are suspended,
takes us down to 1,910.
Dissecting those remaining 1,910 companies……
767 of them have market capitalisations below $25 million,
a further 256 are trading with a market cap between $25-$50 million,
and another 209 have market caps between $50m – $100m.
That’s a total of 1,230 companies (of the 1,910 left ‘trading’) having market caps of $100 million or less
And 170 companies have market caps between $100m and $200m.
Of that group, we have a total of 1,300 companies with a market cap below $200m.
Arguably, 68% of the companies listed on the ASX hardly matter, and less so to global investors.
Perhaps 40% of the total listed companies, shouldn’t be listed, at all.
Of the 600 companies remaining, 200 companies are trading with market caps between $200 and $686 million.
The 400th largest company has a market cap of $686 million.
The Australian equity market is shrinking and thus “de-equitising”.
The silver lining is…that being a public company allows investors to sift through a company’s particulars freely.
The de-equitisation of the ASX is a positive for the shareholders as feasible investment opportunities are becoming scarce.
It’s not good for the Australian Stock Exchange per se.
Scarcity and tension is also increasing as pension (superannuation) and private equity funds are seeking to deploy more of their ‘idle’ capital.
An added ’squeeze’ is that Australian companies are ‘cheap’ on a U.S. Dollar basis.
With a currency trading at an USD/AUD exchange rate of 0.6400…..buying an Australian business which has a market cap of A$400 million, doesn’t seem to much when you consider the price tag to an American buyer is only US$256 million.
The other ‘bullish’ reference I’ll leave readers with is that in 2003, there were nearly 8,000 securities listed on U.S. equity exchanges.
Today, it’s close to 5,000 securities.
That is the picture of de-equitisation and scarcity.
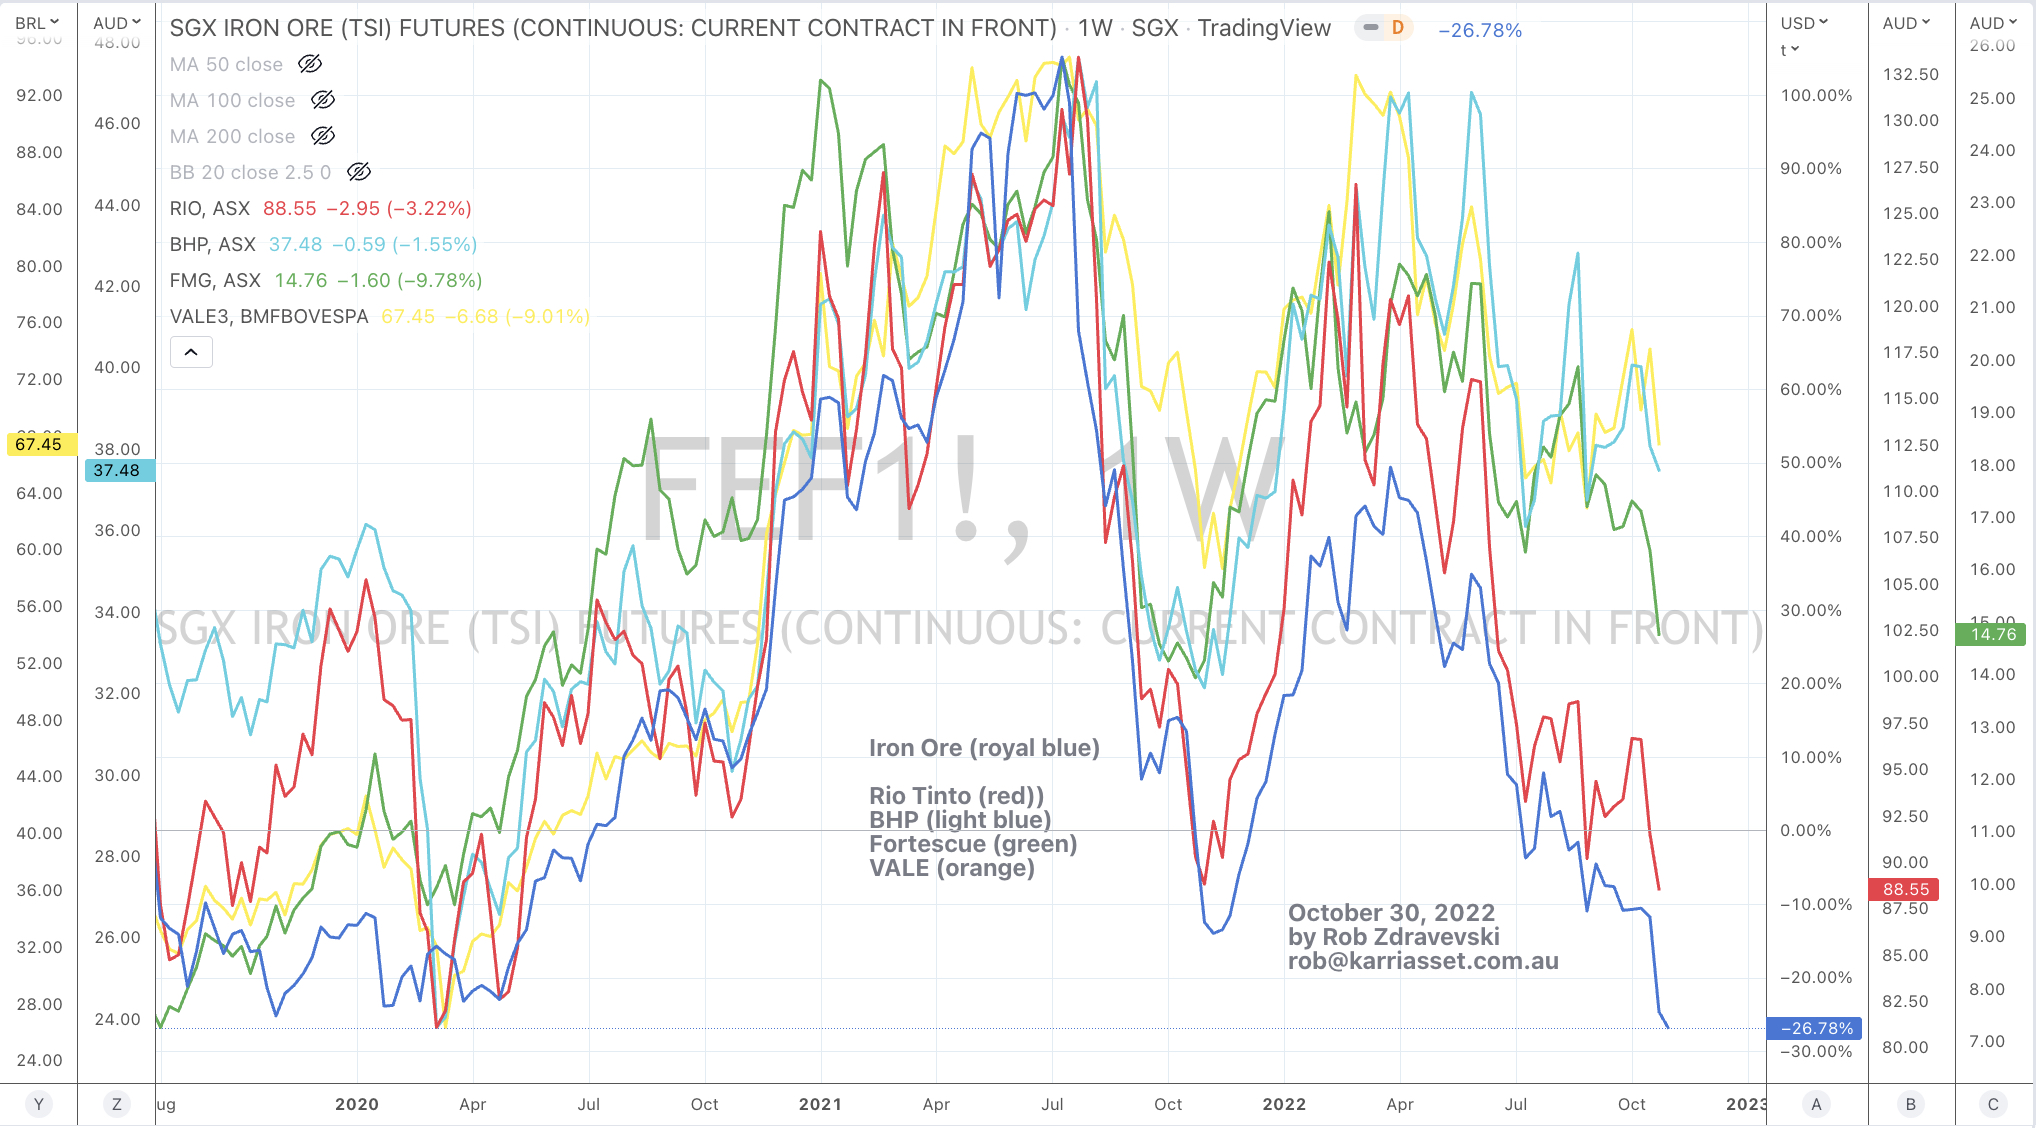
Here is a chart comparing the stock prices of Iron Ore’s Big 4 to the 62% grade Iron Ore price.
Rio Tinto is cuddling more sympathetically to iron ore’s recent decline.
Fortescue is next.
BHP less so.
VALE being the least.
The percentages that these stock prices are tracking Iron Ore’s price may be a representation of each company’s mine localities, corporate domicile, national allegiance or perhaps ‘politics’.
It may be a the market’s interpretation of who China may see as their preferred supplier?
The vertical lines show when the AU 10Y-2Y yield curve becomes oversold (on a weekly basis) it coincides with a starting point for an advance in the ASX 200.
Keep in mind, this is not a study about an inverted yield curve. On that topic, the current Australian 10 year minus 2 year government bond yields are not forecasting a recession.
I keep reiterating that what is more important about where interest rates have traded up to isn’t about the nominal rate, but rather the quantum or factor which the nominal rate have risen by.
Yes, the numbers look bigger when rates are rising from 0.5%…..but people, households, companies, governments etc etc don’t necessarily temper their borrowing when rates are low…..We tend to become accustomed to the ‘going rate’.
In general, the piggies are always at the trough.
When a family is seeking a mortgage of $600,000 but their credit provider announces the good news that they have been approved for $680,000, I suspect that they accept all of the $680,000. After all, they can use it for the landscaping etc etc.
We are happy to continue taking as much we can get or is available.
If my mobile phone plan allows for 20GB of data, I’m sure I’ll use it up and then ask for an upgrade to 40GB. Soon after, I’ll be requesting for an upgrade to 60GB of data.
When the Australian cash rates were 0.25% in last 2020, I was asked if I thought the Reserve Bank of Australia would cut rates at the next meeting.
My response was, “who cares”. The questioners were often shocked by my seeming flippancy.
At this point, I would add by asking, “How much debt do you have and how pressure are you under, that you need a further 15 or 25 basis points of relief”.
Today, if your cost of borrowing has risen from 3% to 6% and you are now speculating whether interest rates go up a further 1% receives the same response from me with the difference being, are you still carrying so much debt that you may ‘break’.
Is it the Fed that is possibly going to ‘break something’ or have we simply kept taking on more debt?
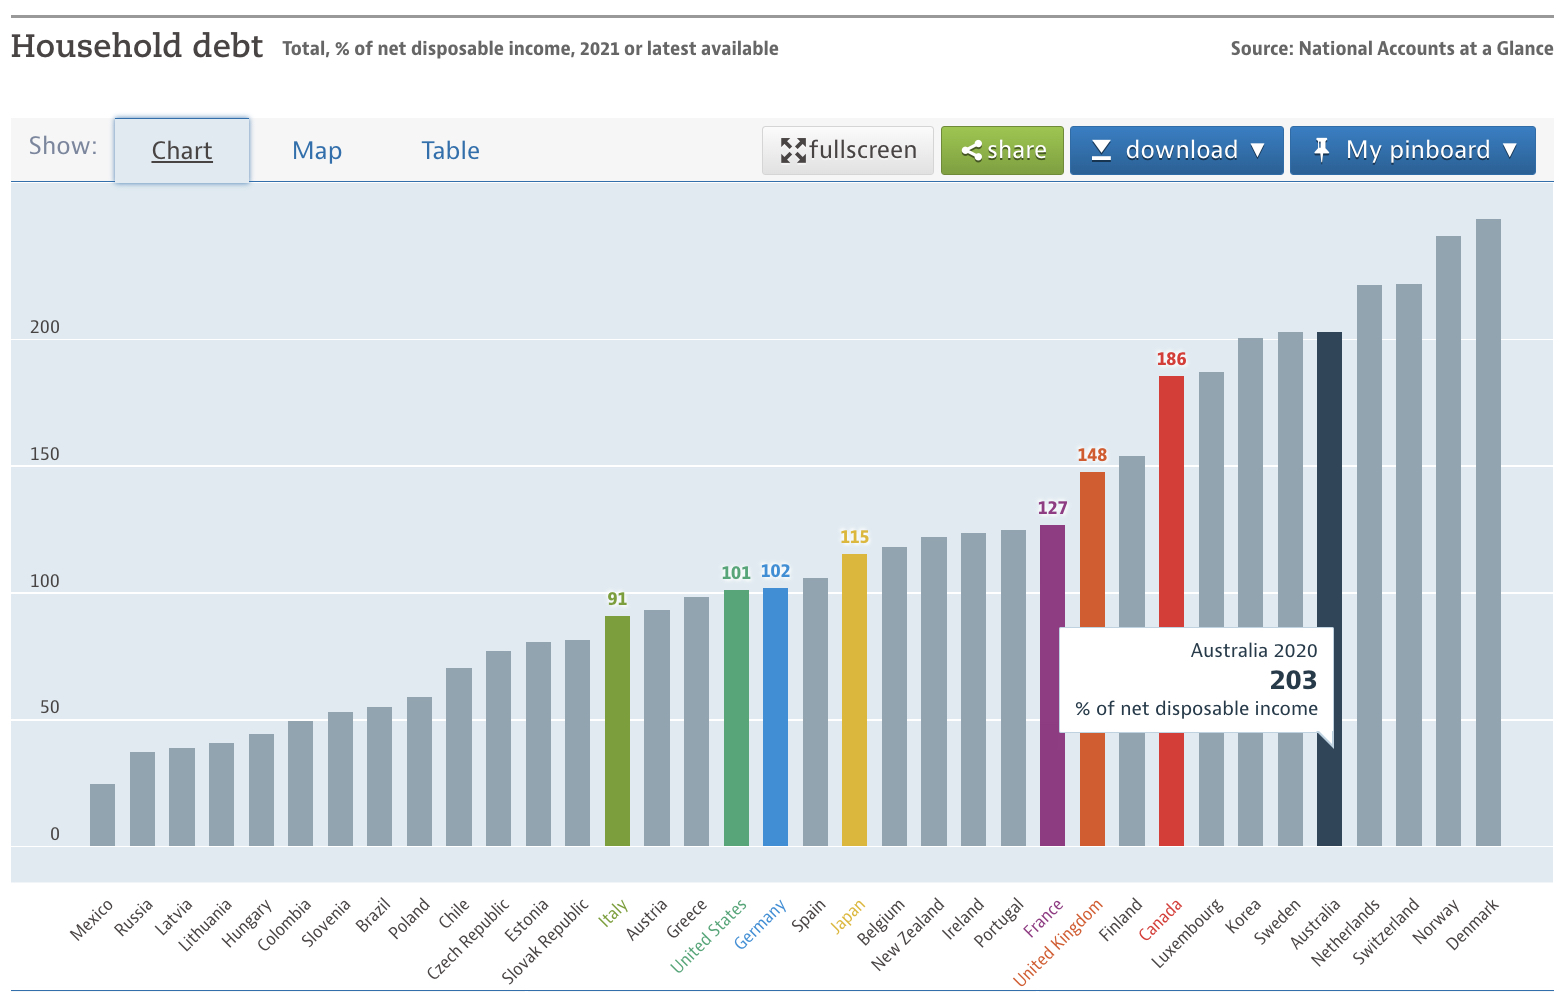
In the graphics below, you can see where the citizens of various nations sit in the indebted stakes.
Look at those frugal and financial responsible Latvians and Hungarians.
Household Debt as % of net disposable income source: OECD
Let me get back to the illustrating the ‘factor’ of the rise.
When rates went from 6% to 8%, it was only a 33% increase.
When rates went from 8% to 16%, it was ONLY a 50% increase.
Mortgage rates in Australia have nearly doubled. In the U.S., they have easily doubled.
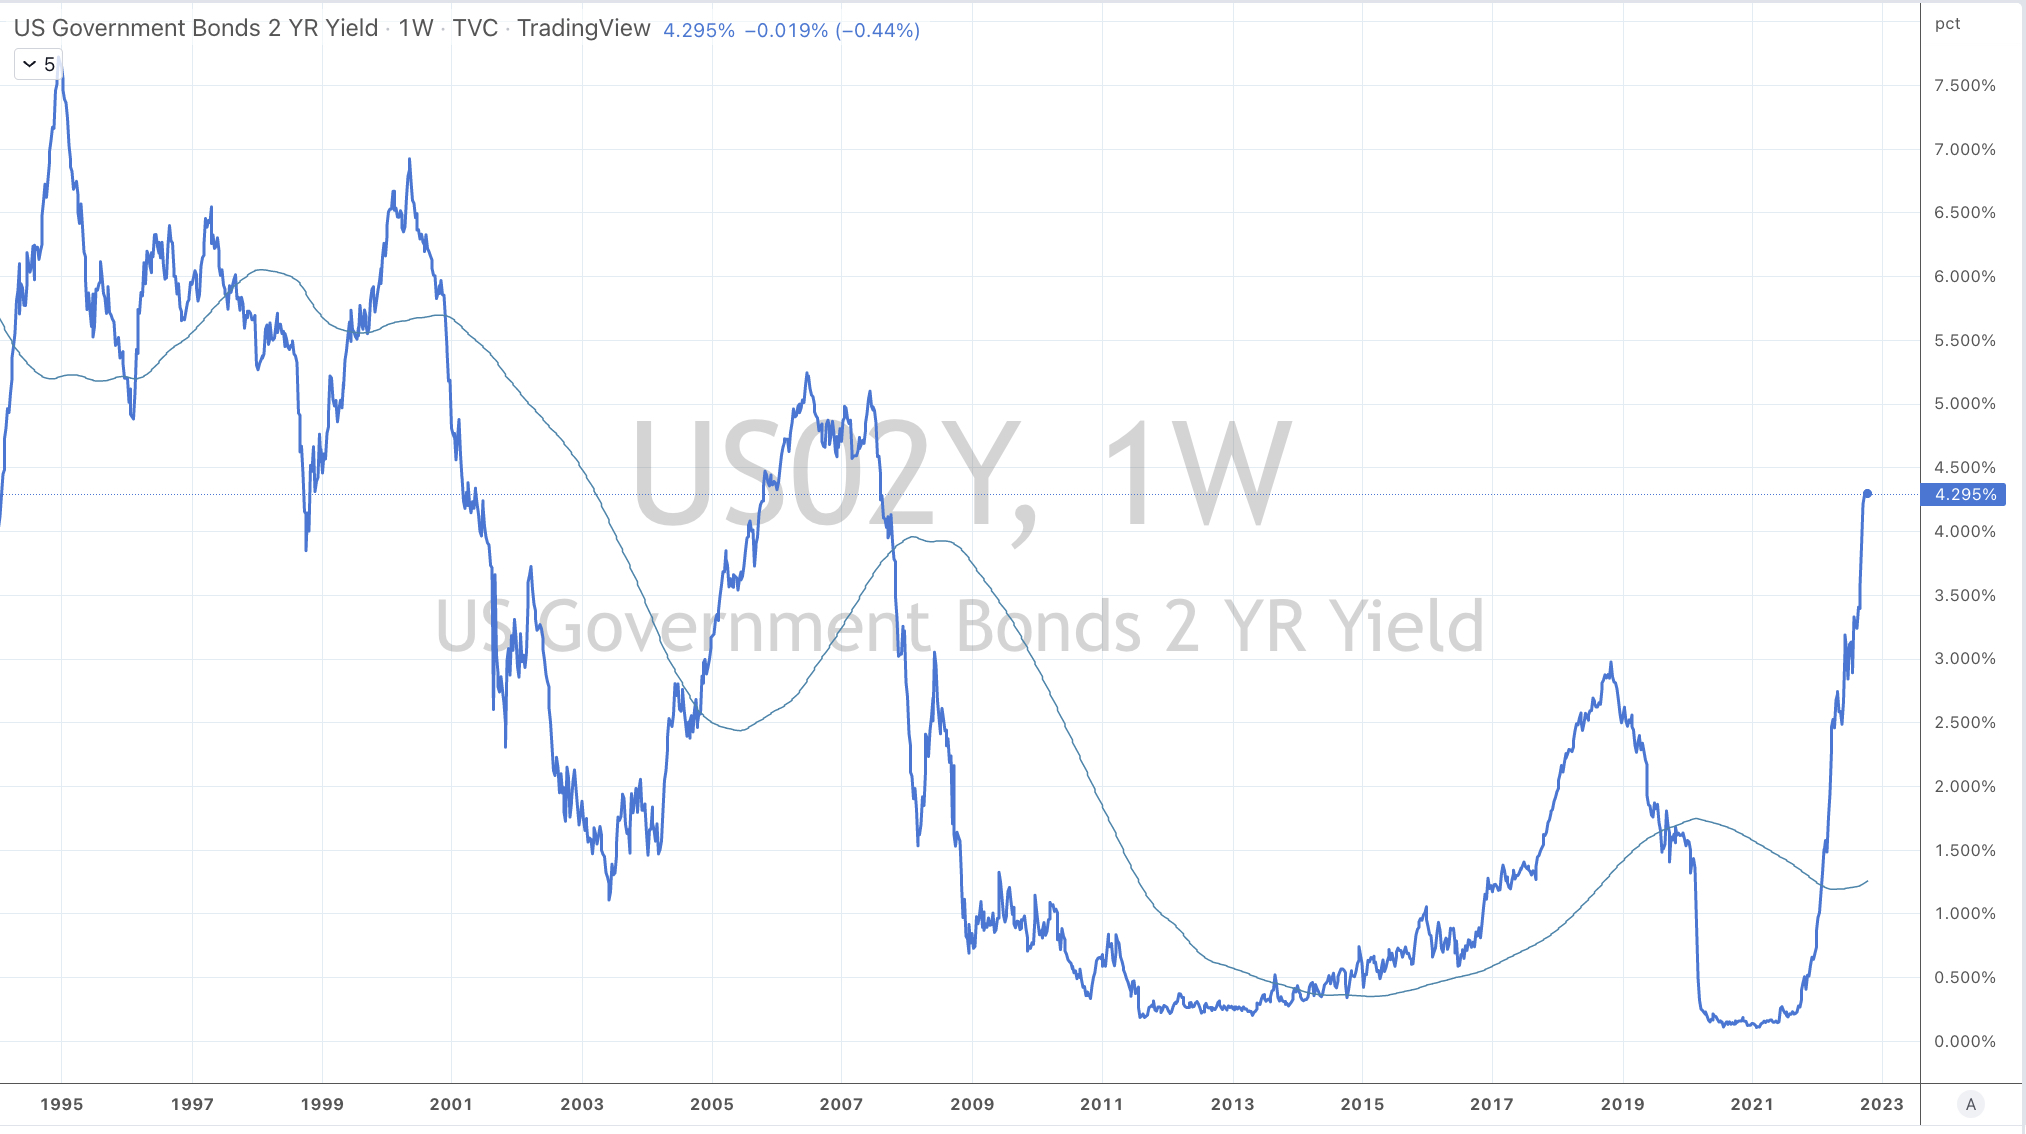
The U.S. 2 years Treasury Bond yield has risen 10 fold.
When your interest repayments or the total cost of capital increase by such a factor, it is the quantum of the rise from the previous levels where you were comfortable with, that hurts the most.
My studies show that government bond yields have never risen by factors of 3 or 4 from their lows within any credit cycle.
At these extremes, as the chart within the below shows, the 2 year bond yield is miles above its 200 week moving average.
Why doesn’t mean reversion matter now, when it has many times prior?
Expecting rates to go higher and challenge gravity, probability and mathematics is a very foolish and crowded trade.
This is not about calling doom and whether the Fed ‘breaks something’……but rather it’s about thinking independently and reading the market tape as it is.
Behind the talk of where rates go to, sits speculative or investing opportunity.
If you have a view….then make the trade and take a position.
Those who shorted bonds when rates were 1% have made a fortune.
Today, if you think rates go up noticeably more……enough to tempt you into a trade, then short bonds and ride the expectation of whether the Fed keeps hiking rates to a point where ’they break something’.
If you think interest rates will fall, you could buy bonds.
Although, this is not a binary choice and the bond market may not be your natural business.
You can express you trade idea in many different manners.
For example, if interest rates keep rising, then you could short the equity of heavily indebted companies or technology stocks which aren’t profitable and have negative free cash flow, or
If you think rates are going to decline, then perhaps owing shares in high growth companies may see their prices ‘catch a bid’.
Of course, this is not personal advice and it’s important to do your research and analysis.