30 year bond yield triples

It’s the quantum of the rate rises which I am watching.

When you have a lot of debt and potentially stretched, it doesn’t matter what the absolute interest rate is.

You risk being wiped out if you can’t service the interest payments once your interest cost triples.

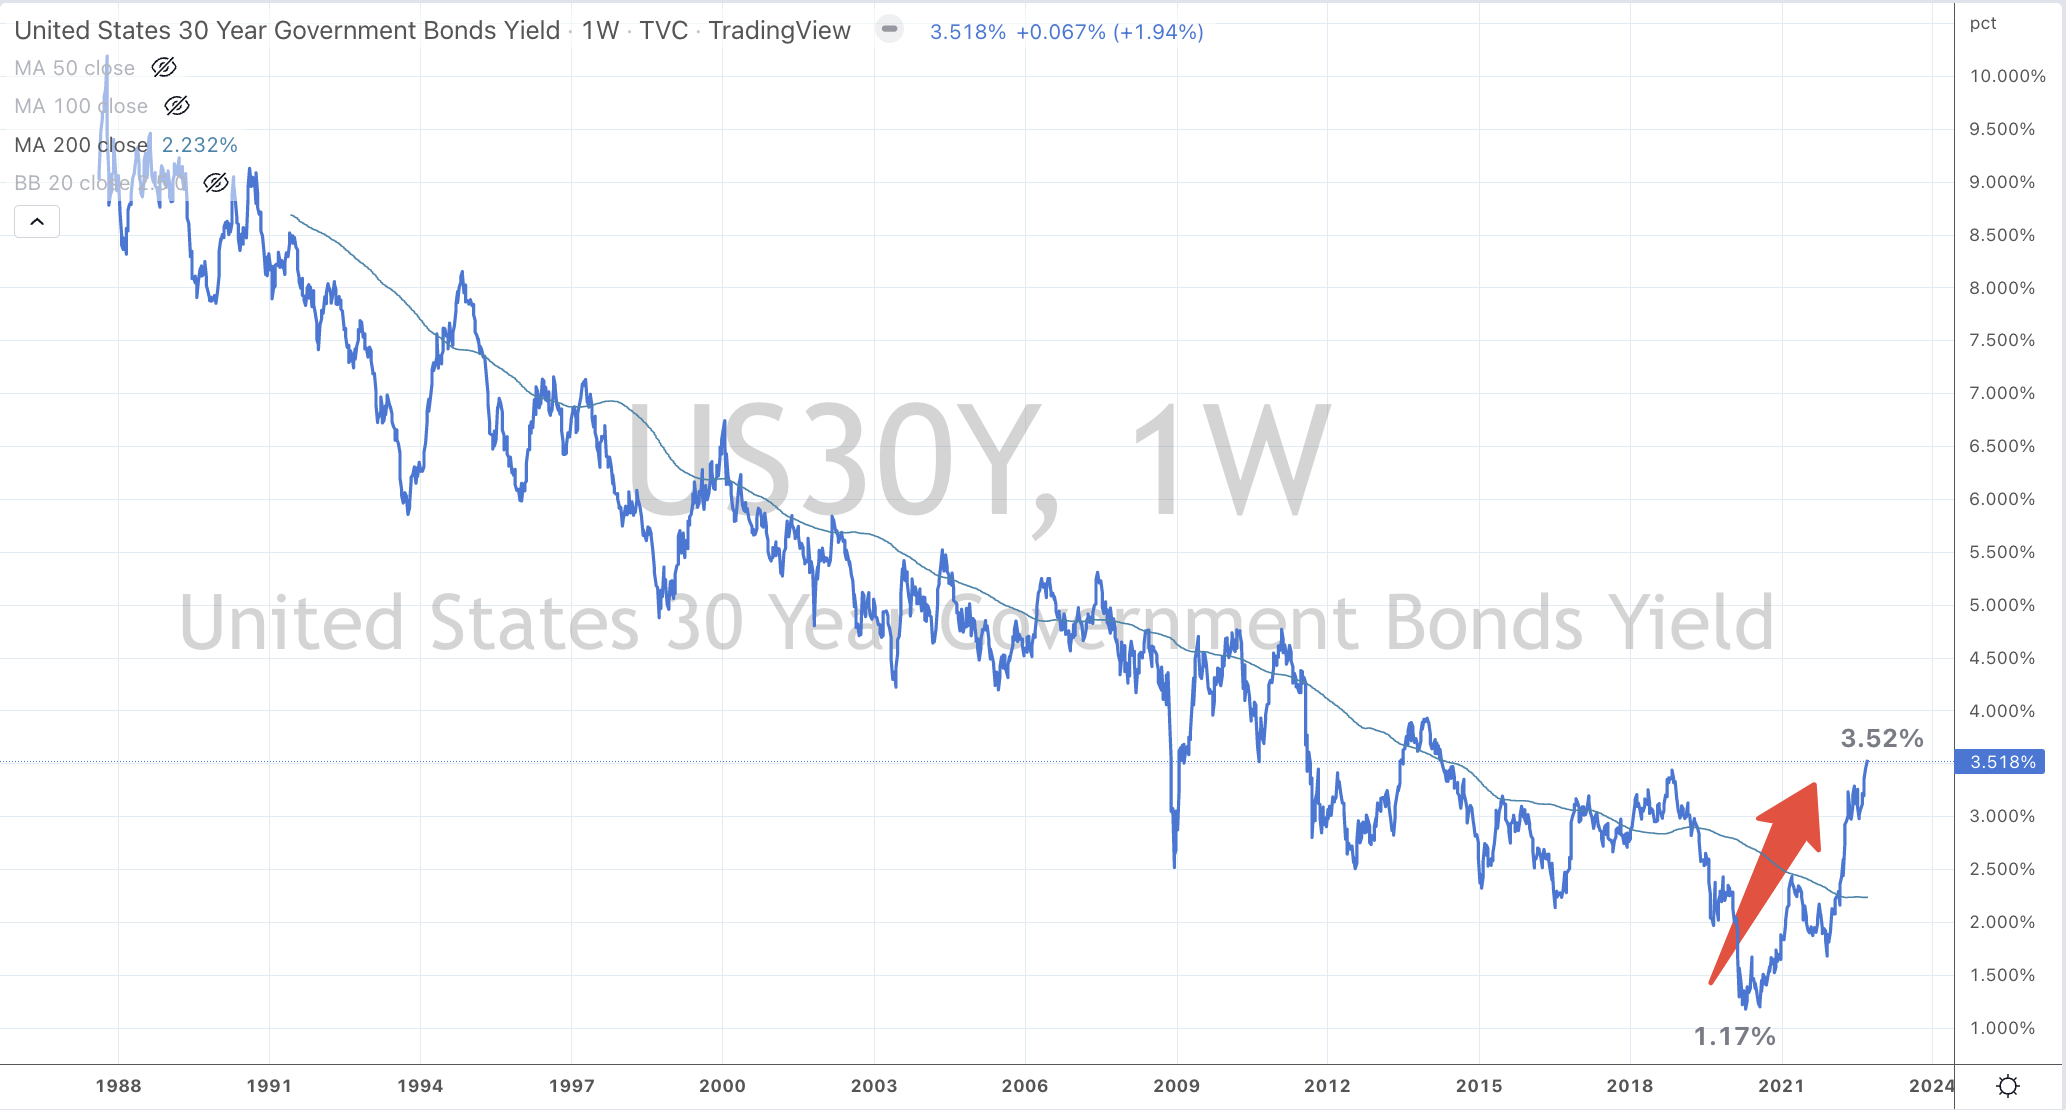
The chart below shows the travels of the U.S. 30 year government bond yield.

When rates were 6% in 1993 and then rose to 8% by 1995, it’s only a rise of 33%.

A rise from 5% to 6.7% as seen in 1998-2000 was only 33%.

During 2012-2014, 30 year rates moved from 2.5% to 3.9%. That’s an increase of only 55%.

The current rate cycle equals an increase of 300%.

My analysis is focused on the quantum of rate rises required, in order to temper credit applications and expansion which when combined with rhetoric will hopefully achieve the desired moderation of inflation.

And when we look at the developed world, we are much more closer to the end of the rate hikes than the beginning.

If the quantum of the rate rises expands, then there is risk to that large asset class known as residential real estate.

After all, the citizens of the developed world are awfully indebted while those in the developing economies (mentioned in the post below) have already experienced rate hikes of between 10 and 13 fold.

You can call it ‘front loading’ or anything else, but the cash rates along with 1, 2 or 3 year government yields of the developed world economies have already risen by the same factor of between 10 and 13 times.

So all this energy spent debating on where G12 central banks need to raise the absolute rate to, is futile.

But for the record, Canada currently has the highest interest rate out of all the G12 and a commodity sensitive (exporting) nation, they will a central bank to monitor for they have increased their policy rate 13 fold from 0.25% to 3.25%. The next BOC meeting is on October 26, 2022.

It’s time to get used to a new interest rate base from which central banks will work from and the investing effect is clear.

The absolute cost of capital has markedly increased and the return on investments will be adjusted lower.

September 19, 2022

by Rob Zdravevski

rob@karriasset.com.au

Macro Extremes (week ending September 16, 2022)

The following assets (on a weekly timeframe) registered an Overbought or Oversold reading and/or have traded more than 2.5 standard deviations above or below its rolling mean.

Extremes “above” the Mean (at least 2.5 standard deviations)

TBT

EUR/GBP

AUD/JPY

Overbought (RSI > 70)

U.S. 2 year government bond yield

German 5 year government bond yields

Spanish, French, Italian and U.K.10 year government bond yield

U.S. Dollar Index (DXY)

The Overbought Quinella – Both Overbought and Traded at > 2.5 standard deviations above the weekly mean)

U.K. 10 year government bond yields

U.S. 5, 20 and 30 year government bond yields

German 2 year government bond yields

Extremes “below” the Mean (at least 2.5 standard deviations)

CAD/USD

NZD/USD

IEI

Oversold (RSI < 30)

Tin

Hot Rolled Coil Steel (HRC)

GBP/USD

JPY/USD

The Oversold Quinella – Both Overbought and Traded at > 2.5 standard deviations above the weekly mean)

CNH/USD

KRW/USD

TLT

Notes & Ideas:

The big news for the week is the outside bearish weeks posted by the Shanghai Composite, the DJIA, DJ Transports, MidCap 400, NDQ, RTY, SOX, S&P 500, the SmallCap 600, Copenhagen’s OMX 30 and the Swiss SMI.

The declines and reversals in equites was preceded by my note, 9 days earlier, that markets can be (are) cruel.

The Government bond yield continue to gather an ‘overbought’ stream but the US 5 year minus 3 month yield spread is not longer Oversold.

The consensus is that Europe is ‘on the nose’. The CAC and DAX lows were seen six months ago, in March 2022. Those indices are back visiting and testing those lows.

Meanwhile, the Hang Seng Index and HSCEI have made ‘lower lows’, while the S&P 500 made a lower close than last week’s low.

Re-resting of lows in equity indices will be something I’m watching.

This past week, the Russell 2000 mean reverted (200 week moving average) again, the Philadelphia Semiconductor Index (SOX) is close to its 1st visit in a long time, the S&P SmallCap 600 is 5% away from doing so while the ASX 200 is nearly doing so for the 2nd time in as many months.

We saw more in the energy complex accelerate their decline. 

Diesel (Gasoil) fell 10%, the Japan Korean LNG Marker sunk 22%, and Heating Oil declined 11%.

My thoughts about the price of diesel halving were published 2 months ago.

The Baltic Dry Index has risen 40% in the past 2 weeks, showing demand for bulk shipping.

And Gold is working its way towards a buy target.

The larger advancers over the past week comprised of; 

Baltic Dry Index 28%, Iron Ore 3%, Lean Hogs 4%, Nickel 9.5%, Orange Juice 1.9%, Platinum 2.8%, Silver in USD 3.3%, Urea Middle East 2.2%, Silver in AUD 5.8% and Soybeans rose 2.6%. 

The group of decliners included;

Australian Coking Coal (2.3%), Rotterdam Coal(1.8%), China Coal (3.6%), WTI Crude (2.3%), Gasoil (10%), Copper (1.4%), Heting Oil (11.4%), HRC (3.6%), JKM (21.8%), Coffee (5.9%), Lumber (5.8%), Natural Gas (2.9%), Palladium (3%), Rubber (1.8%), Sugar (1.9%), CRB (1.9%), Cotton (7.6%), Dutch TTF (9.3%), Uranium (6.9%), Gold in USD (2.5%), Shanghai (4.2%), AEX (3.1%), KBW Banking (3.8%), CAC (2.2%), DAX (2.7%), DIA (4.4%), DJ Transports (8.8%), HSCEI (3.1%), HSI (3.1%), Bovespa (2.7%), S&P MidCap 400 (5.1%), Nasdaq 100 (5.8%), Oslo (2.7%), Copenhagen (6.3%), Helsinki (2%), Stockholm (2.7%), Russell 2000 (4.5%), Sensex (1.6%), SMI (2.7%), SOX (5.8%), S&P 500 (4.7%), FTSE 100 (1.6%), Toronto’s TSX (2%), S&P SmallCap 600 (4.1%), Nasdaq Biotech (3.9%), Nasdaq Composite (5.5%) and the ASX 200  fell 2.3%.

September 18, 2022

by Rob Zdravevski

rob@karriasset.com.au 

Stock prices are discounting lack of visibility.

Has the market already discounted a decline in earnings for FedEx?

Has it already anticipated broker estimate downgrades?

Today, FedEx (FDX) guides 1Q23 EPS well below consensus and guides Q2 EPS and revenue below consensus and withdraws FY23 earnings guidance.

But the adjustment of expectations relating to future earnings has occurred in many stocks across various industries.

There has already been much damage.

By tomorrow’s close (stock is down 17% in today’s after-market) the stock has halved from its June 2021 high.

It is interesting to note that many stocks peaked 14-18 months ago.

September 16, 2022

by Rob Zdravevski

rob@karriasset.com.au

Oracle’s earnings tells us more about currency effects

This week’s note highlighted USD currency headwind risk.

So, Oracle’s ‘currency headwind’ equated to nearly 15% of its quarter’s earnings.

No small change and it is a factual effect that the U.S. Dollar’s strength is having on American corporate earnings.

An extract from Oracle’s Q1 Fiscal 2023 earnings transcript is,

“The currency headwind this quarter was much higher than the 3% headwind that was present when we gave guidance. It was actually 6 points, even though due to rounding, it may look like 5%, and that’s a currency headwind to total revenue. It was, in fact, 6 points. And yet, we still exceeded our forecast on a reported basis, and we beat our constant currency revenue forecast by $200 million. We saw similar currency headwinds in EPS, which had an $0.08 negative effect, much worse than the $0.05 headwind present at the time of guidance in June.”

But with present USD strength being extended and stretched, in the spirit of positioning for ‘where the puck is going to be’, I’ll look for the contrarian effect to company earnings in the coming quarters.

In the meantime, well run Japanese companies should be ‘minting’ profits from their increasing competitive position of having a monumental weaker Yen.

September 15, 2022

by Rob Zdravevski

rob@karriasset.com.au

Bitcoin sentiment

On November 18, 2021, I wrote this note implying a peak in crypto currency mania with the news that a company called Crypto.Com paying $700 million for 20 years naming rights of a Los Angeles sporting arena.

This news was indeed such a harbinger that the peak was already in process, as the chart below shows….for only a week prior Bitcoin did peak at $69,000.

When you can’t analyse an asset by another means, anecdotes count for something.

p.s. I don’t know how a 71% decline is considered a ‘store of value’.

p.p.s. for the speculators, the dearth of interest in Bitcoin is suggesting it is nearing a new trough.

September 15, 2022

by Rob Zdravevski

rob@karriasset.com.au

Contracting P/E Ratios – European Value

I prefer ‘value’ (rather than growth) stocks being in distress because balance sheet analysis is an added and viable tool.

While there are surely holes in the argument that the ‘E’ (earnings) forecast may still be lowered, I think this market is in the general vicinity of favouring buyers, more so than ‘sellers’.

September 15, 2022

by Rob Zdravevski

rob@karriasset.com.au

Graphic Source: Bloomberg | Jean-Charles GAND

Convergence is also happening

Here is a story of convergence to the mean, not reversion.

The chart and graphics below show the Gold price (in USD) trading sideways for 2 years while the 200 week moving average has risen $300 or improved by more than 20%.

It has converged towards the oscillating price of Gold which has spent a couple years digesting and consolidating.

I’m preparing for a further 4% swoon from its current $1,706, down to around the $1,640 mark.

September 14, 2022

by Rob Zdravevski

rob@karriasset.com.au

For the contrarians, fund manager’s are bearish

This week’s Bank of America survey highlights include,

Fund managers are “super bearish” with average allocations to cash at the highest since 2001, with 62% being overweight cash;

A net 42% of global investors are underweight European equities, the largest such position on record;

A historically high 52% of respondents said they are underweight equities;

Of the polled 212 investors overseeing $616 billion in assets from Sept. 2-8, said 72% of those surveyed said they expected a weaker economy next year, and the most crowded trade was long U.S. dollar.

https://www.bloomberg.com/news/articles/2022-09-13/bofa-survey-shows-nadir-in-stock-allocations-amid-recession-fear?sref=qLOW1ygh

September 14, 2022

A trade for the ages….Sell USD / Buy JPY

The chart below shows the U.S. Dollar at a historically stretched moment of strength.

Such extreme percentages above its 200 week moving average coupled with weekly overbought readings also coincide with a peak in the Australian 2 year bond yield and a trough in the CRB (commodities) index, to only mention a couple.

September 14, 2022

by Rob Zdravevski

rob@karriasset.com.au

Another FANNGM is doing it

The Nvidia (NVDA:US) mean reversion is almost done.

It doesn’t necessarily mean that its 200 week moving average is the place to buy, as it may overshoot to the $103-$115 mark…..

this chart did tell you that it was dangerous chasing and buying this stock at stretched valuations as it soared way above its 200 WMA.

September 14, 2022

by Rob Zdravevski

rob@karriasset.com.au