A weekly Macro, Cross Asset review of prices trading at extremes which may generate future investment ideas and opportunities.
The following assets (on a weekly timeframe) either registered an Overbought or Oversold reading and/or have traded more than 2.5 standard deviations above or below its rolling mean.
Extremes “above” the Mean (at least 2.5 standard deviations
10 year Russian government bond yields
Lean Hogs
Tin
Overbought (RSI > 70)
Cotton
Cocoa
Rubber
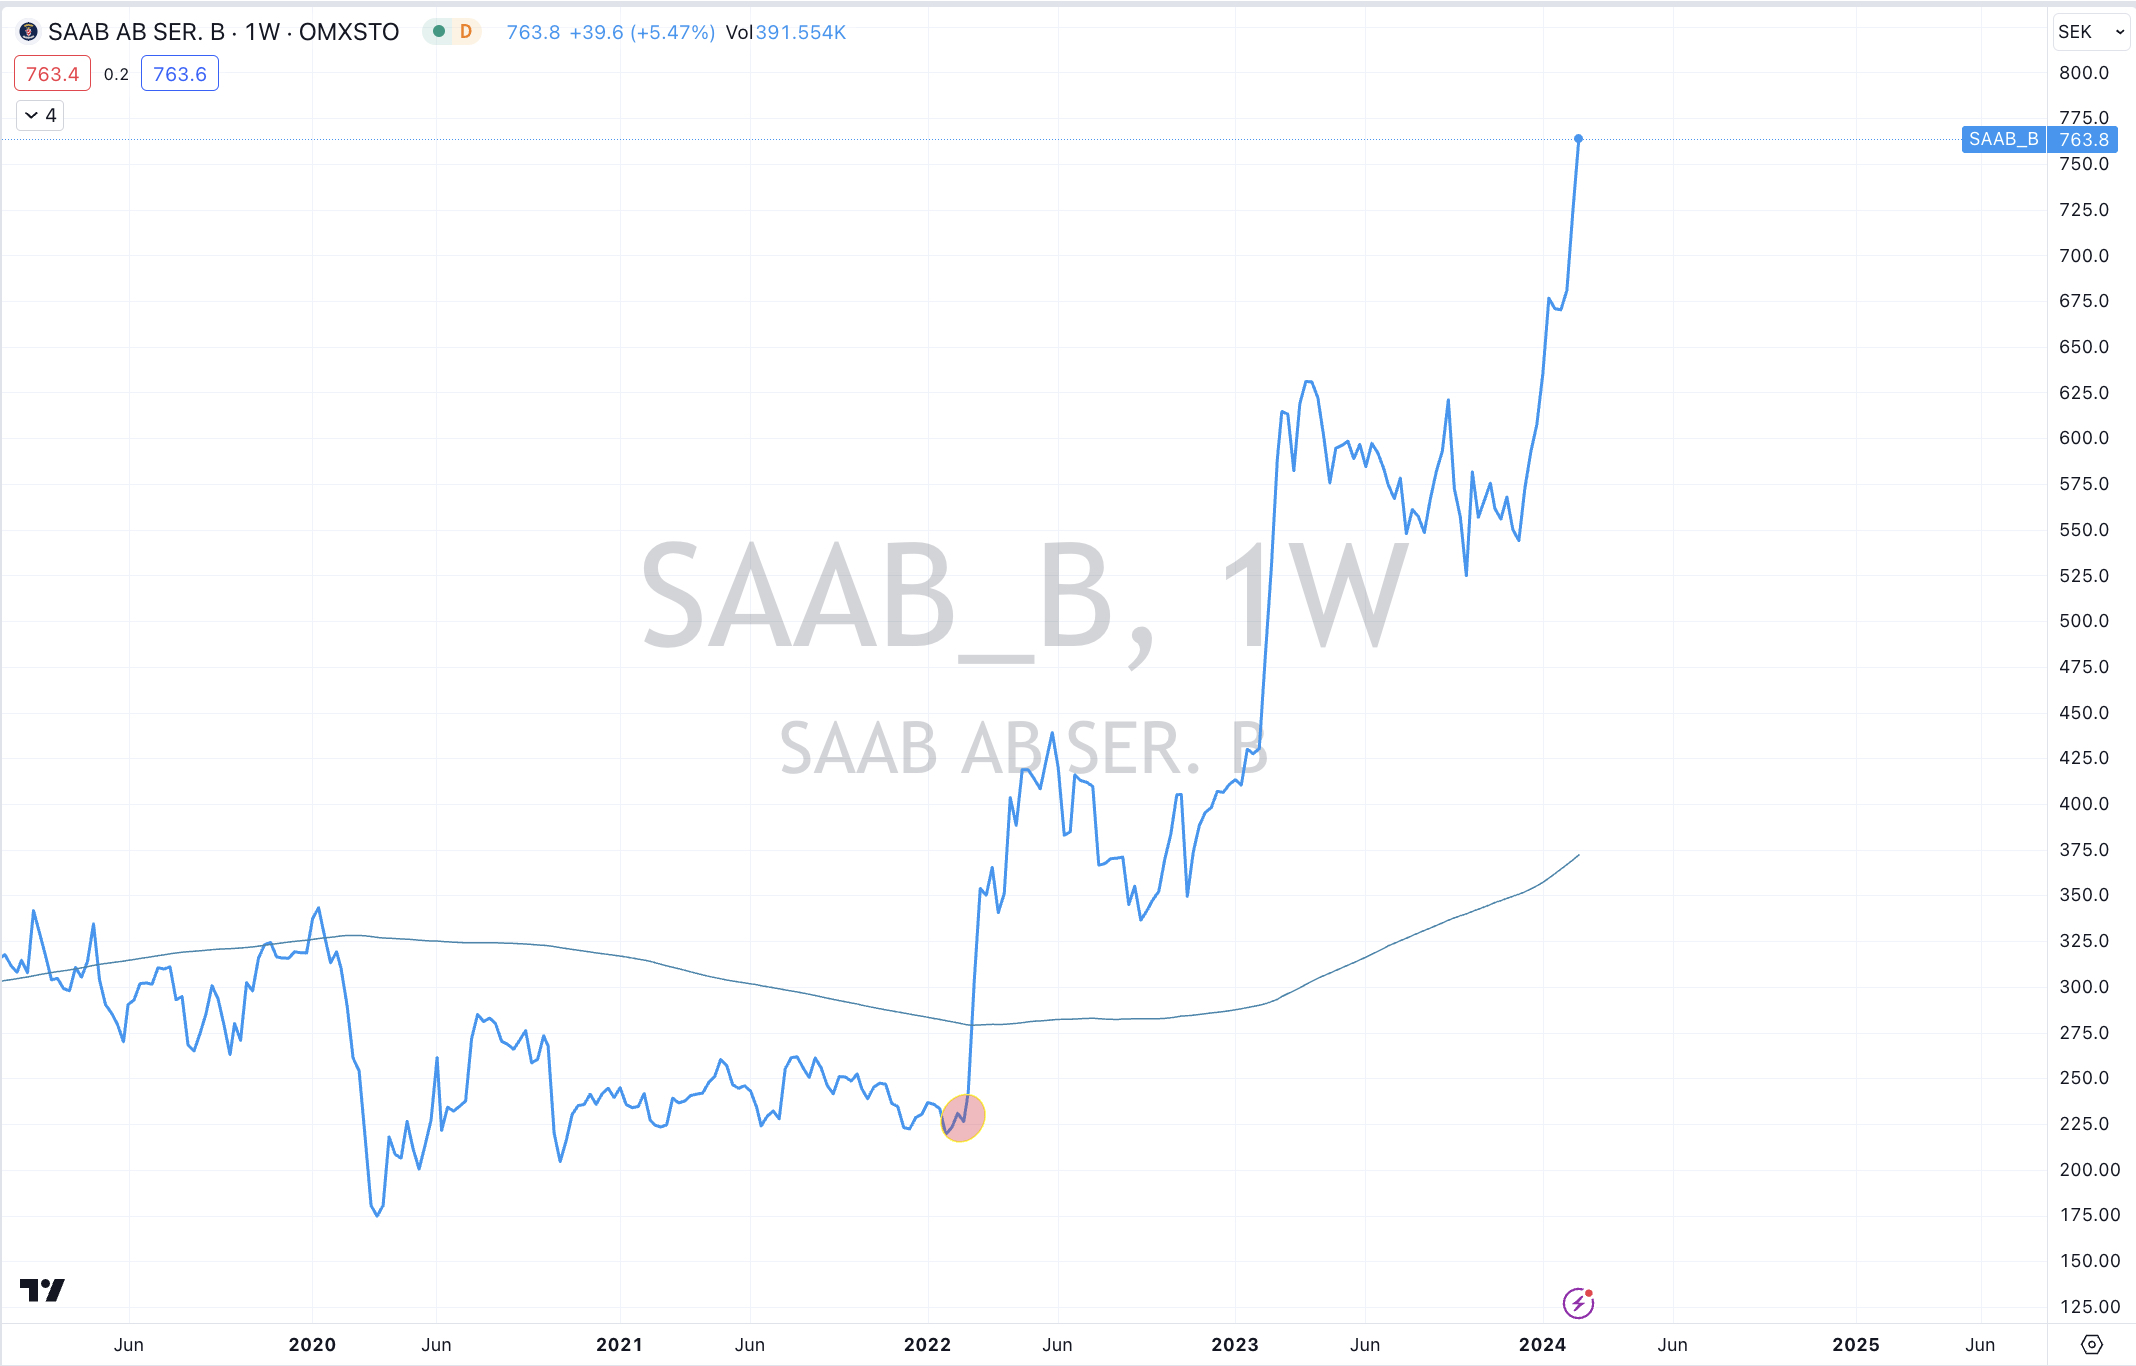
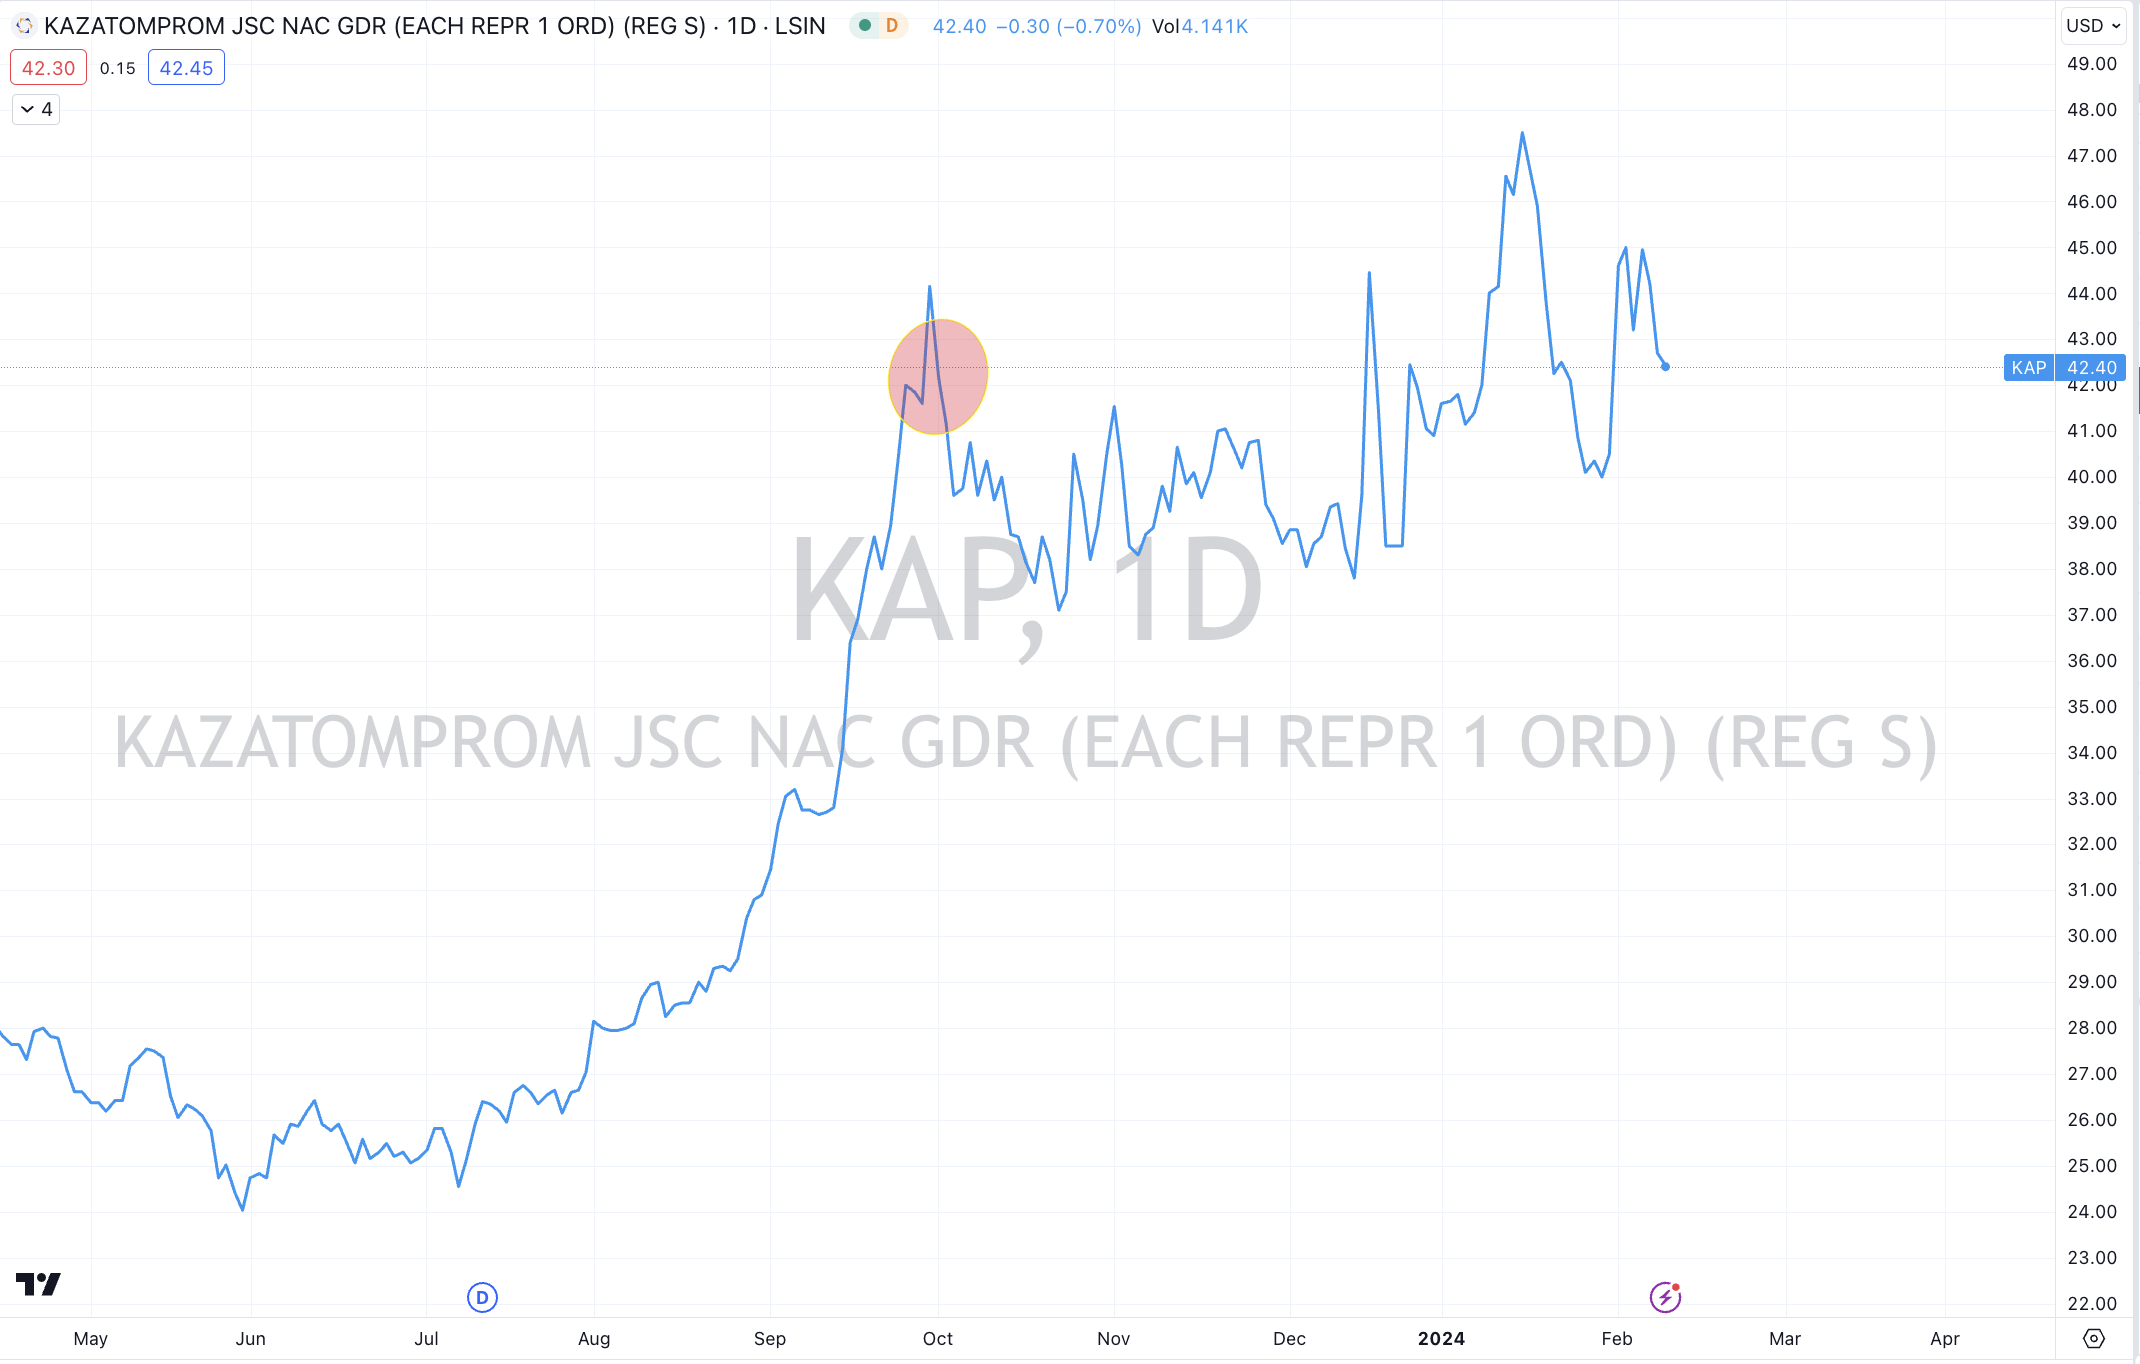
Uranium
Robusta Coffee
AEX
Italy’s MIB
KLSE
Dow Jones Industrial Average
NIFTY 50
Nasdaq Transportation Index
Egypt 30 Index
Philadelphia Semiconductor Index (SOX)
TAIEX
Budapest
And the S&P 500 Index
The Overbought Quinella – Both Overbought and Traded at > 2.5 standard deviations above the weekly mean)
Nikkei 225
Russia’s MOEX Index
Turkiye’s BIST 100 Index
Extremes “below” the Mean (at least 2.5 standard deviations)
Shanghai Composite
Oslo’s OBX Index
Wheat
Oversold (RSI < 30)
JKM LNG
Lithium Hydroxide
Nickel on India’s MCX Exchange
Corn
Soybean
The Oversold Quinella – Both Oversold and Traded at < 2.5 standard deviations below the weekly mean)
China 10 year government bond yield
Notes & Ideas:
Government bond yields were higher for week, again.
As mentioned in last week’s edition, many yields continue to move higher back towards the middle of their recent ranges.
German 10’s closed at their highest weekly close since November 20, 2023.
The Australian 10 year minus U.S. 10 year bond yield spread is in a 4 week losing streak.
The British 5 year’s are in a 5 week winning streak as are the Japanese 2’s. The latter have moved from 0.00% to 0.14% in that time.
Equities were stronger, however there were some losers too.
The Nasdaq 100, Composite and Transports aren’t overbought anymore, breaking wither their 4th or 5th consecutive weeks of advance.
The S&P 500 is still overbought but it did break its 5 week winning streak. It has risen for 14 of its past 16 weeks.
The CAC made a new all-time high.
The DAX performed a weekly outside bullish reversal which can be interpreted as a continuation of its rising trend.
Inversely, the Dow Jones Transports ‘did’ an outside bearish reversal, as ‘did’ the Nasdaq 100.
The Dow Jones Industrial Average broke its 5 week winning streak while it has now spent the past 10 weeks in overbought territory.
The S&P 500 is also in a 5 week winning streak and has risen for 14 of its past 15 weeks.
Amsterdam’s AEX continues to make new all-time highs.
Last week’s report that the Russell 2000 and the S&P MidCap 400 both performed a bullish outside reversal week has resulted in those indices bucking the declines seen in the other major U.S. indices.
Turkiye’s BIST has risen for 7 consecutive weeks making for a 22% (in TRY terms) return.
And the HSCEI has risen 6.5% over the past weeks……in amongst all of that pessimism.
Commodities were mixed with the notable advancers and decliners listed below.
Cocoa and Sugar broke their respective 5 and 6 week winning streaks.
Precious metals had a good week.
Softs and Grains were clearly weaker.
Energy was mostly weak, with Natural Gas tanking again.
WTI Crude outperformed Brent Crude.
Lithium Hydroxide prices was unchanged for the week, once again.
Is this called consolidation or digestion?
Lithium Hydroxide has now spent 32 consecutive weeks in weekly oversold territory.
Cattle is in a 7 week winning streak and has closed higher in 9 of the past 10 weeks.
Heating Oil continues its roller coaster. This week it fell 5%, the prior week it rose 11%, the week before that it fell 6% and the week before that saw it rise 7%. Mamma Mia !
Cotton is in a 6 week winning streak.
Soybeans and Corn are registering oversold extremes.
Soybeans are in a 9 week losing streak and have fallen 13 of the past 14 weeks.
Henry Hub Natural Gas prices made an new all-time lows, having fallen 28% ion the past 3 weeks while JKM LNG are trading at their lowest close since December 20, 2020.
And Rice performed a weekly outside bearish reversal.
Amongst currencies, the collective U.S. Dollar (DXY) Index is in a 7 week winning streak.
The U.S. Dollar has risen for 7 consecutive weeks against the Chilean Peso which perhaps correlates with the tempered commodity prices of late.
The AUD rose for the week across its pairs, the CAD was slightly lower.
While against specific pairs, the U.S. Dollar has risen for the past 5 or 6 weeks.
The AUD has slight gains, thus putting an end to its consecutive losing streaks against many pairs such as the 6 week losing streak for the AUD/SGD.
The Yen was weaker, again which dances well with the risk-on temperament seen in equities.
The larger advancers over the past week comprised of;
Baltic Dry Index 4.2%, WTI Crude 2.5%, Cotton 2.9%, Lean Hogs 4.9%, Copper 4.3%, Lumber 2.1%, Tin 6.3%, Nickel 2.7%, Palladium 9.6%, Platinum 4%, Silver in AUD 3.5%, Oats 2.1%, Shanghai 5%, CSI 300 5.8%, KBW Bank Index 1.9%, China A50 2.8%, MIB 1.9%, HSCEI 4%, Hang Seng 3.8%, Indonesia 2.5%, KRE Regional Bank Index 1.8%, Nikkei 225 4.3%, Helsinki 1.8%, Stockholm 2.4%, S&P 600 Value 2%, SMI 2%, Chile 4.9%, STI 2.7%, TAEIX 2.8%, FTSE 100 1.8%, BIST 2.3% and the ASX Industrials rose 1.8%.
The group of largest decliners from the week included;
Rotterdam Coal (1.6%), Cocoa (4.6%), Heating Oil (5.3%), Hot Rolled Coil Steel (1.7%0, Coffee (2.5%), Newcastle Coal (2.3%), Natural Gas (12.9%), Sugar (3.9%), Dutch TTF Gas (8.5%), Gasoil (3.9%), Corn (2.9%), Rice (3.2%), Wheat (5.9%), Cocoa (2.7%), Robusta Coffee (2.4%), DJ Transports (3.6%), Nasdaq Composite (1.3%), Nasdaq 100 (1.5%), Oslo (1.9%), S&P 500 (0.4%) and Pakistan’s Karachi KSE 30 fell 5.6%.
February 18, 2024
by Rob Zdravevski
rob@karriasset.com.au