The following assets (on a weekly timeframe) registered an Overbought reading or traded more than 2.5 standard deviations above its rolling mean.
Extremes “above” the Mean (at least 2.5 standard deviations)
Live Cattle
Natural Gas
Overbought (RSI > 70)
Tin (for the 9th week)
Gasoil
Heating Oil
WTI Crude Oil
Brent Crude Oil
Iron Ore
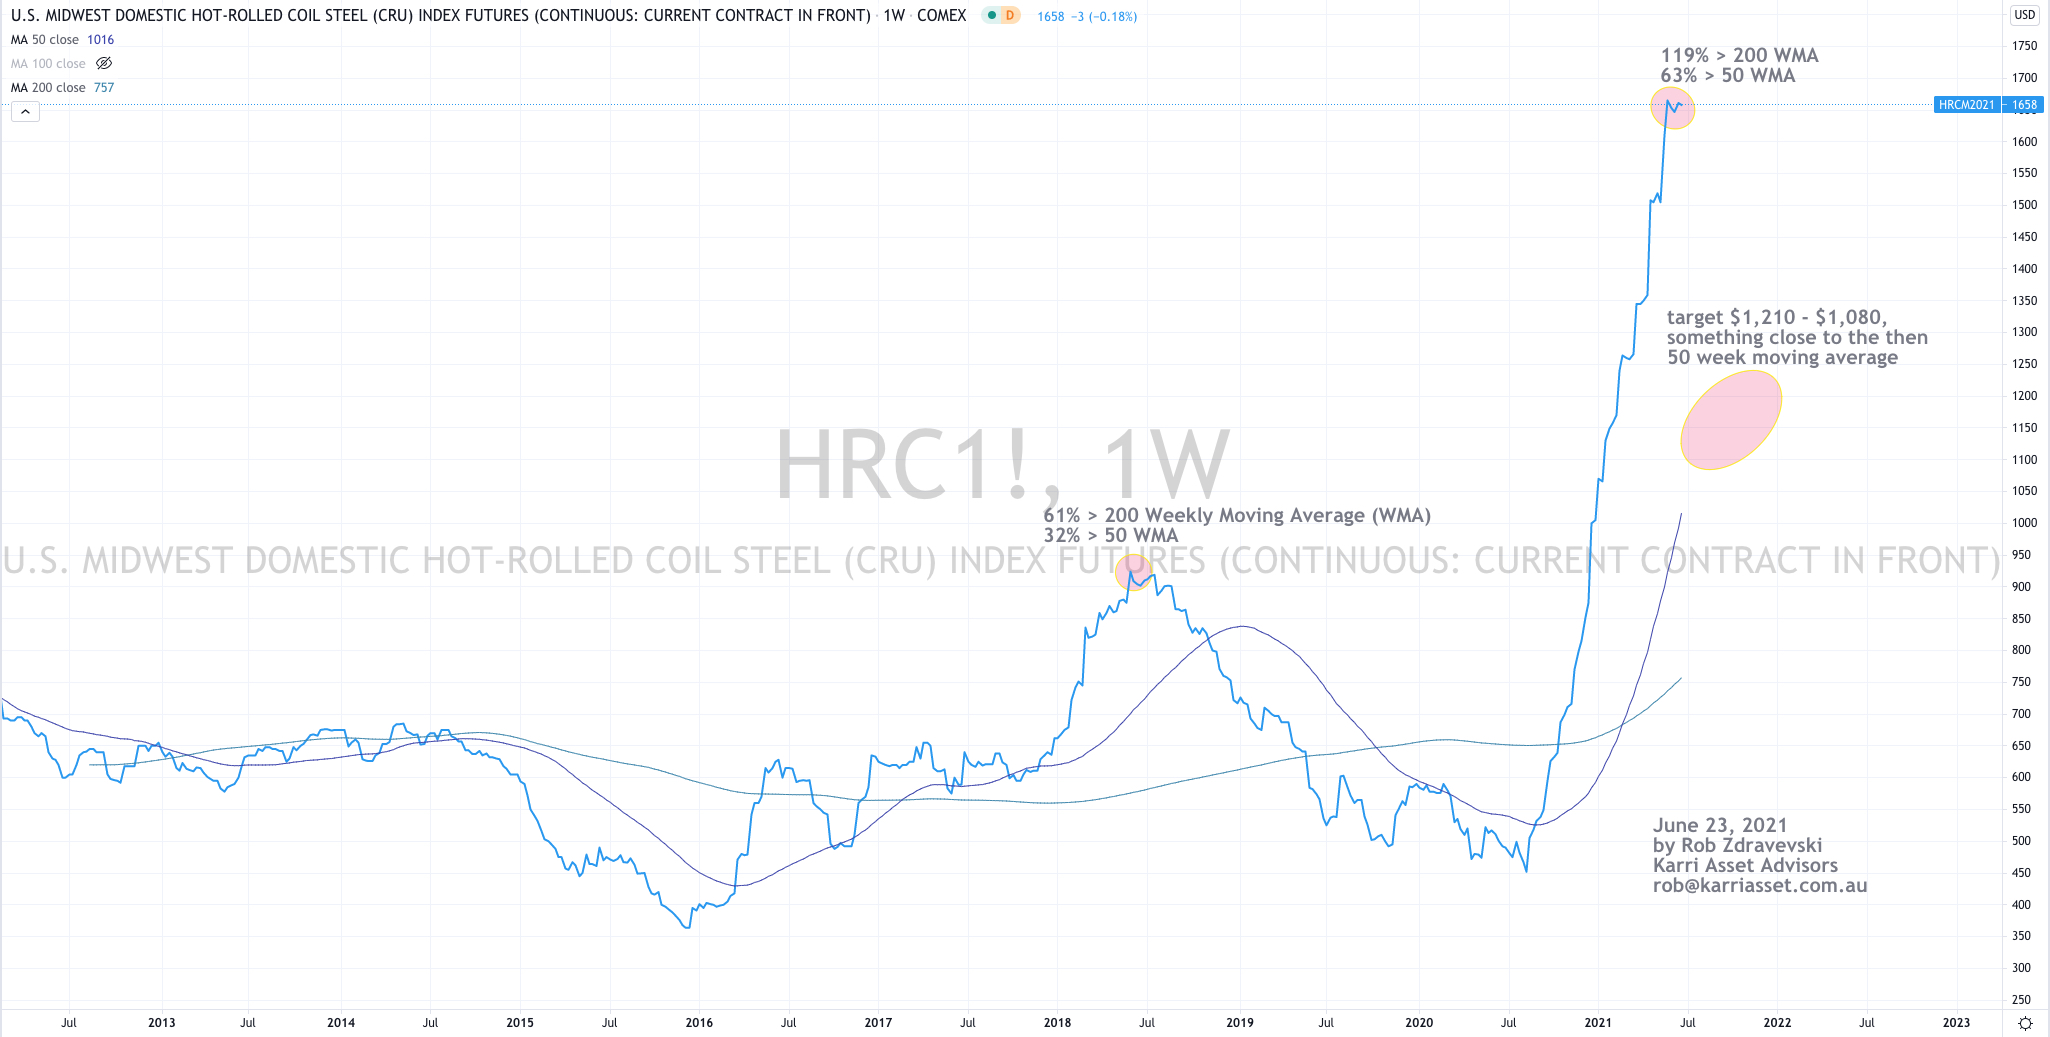
Hot Rolled Coil Steel
the CRB (commodities) index
France’s CAC-40 equity index (for the 11th consecutive week)
Korea’s KOSPI equity index
Switzerland’s SMI equity index (for the 2nd week)
and the Oslo and Helsinki equity indices.
The Overbought Quinella – Both Overbought and Traded at > 2.5 standard deviations above the weekly mean)
U.S. 2 Year Treasury Note yield
Assets (securities) within my immediate universe which touched the other side of the extreme, being Oversold (where the RSI is < 30) or were at least 2.5 standard deviations below its mean are;
Extremes “below” the Mean (at least 2.5 standard deviations)
Chinese 10 Year Government Bond Yields
Platinum
AUD/USD (for the 2nd consecutive week)
NZD/USD
Nikkei 225 equity index
Oversold (RSI < 30)
Nil
The Oversold Quinella – Both Oversold and Traded at < 2.5 standard deviations above the weekly mean)
Nil
Notes & Ideas:
The list of extreme readings continues to diminish as trend change direction and mean reversions take place.
It’s time time prepare for the extremes seen, most likely at the other end of the recent ranges.
Again….the larger price moves in global markets were seen in the commodity markets.
For the week…..
Lumber (8%)
Wheat (4%)
Leans Hogs fell 6%, following on from last week’s 11% decline.
Corn (8%)
Coffee + 4%
Platinum + 6%
Oil +4%
Russell 2000 and Midcap 400 (U.S.) equity indices rose 4%
and the ASX 200’s 1% decline for the week sees it move below (and out of) overbought territory.
The U.S. 10 year bond yield it yet to break above 1.75%, although Yields rose to 1.53%, up from last week’s 1.44%. This is the thing to watch. Hell may break loose if the 10’s break above 1.65%.
The Baltic Dry (shipping) index consolidated the 29% rise seen over the past weeks with a meandering 1% effort this week.
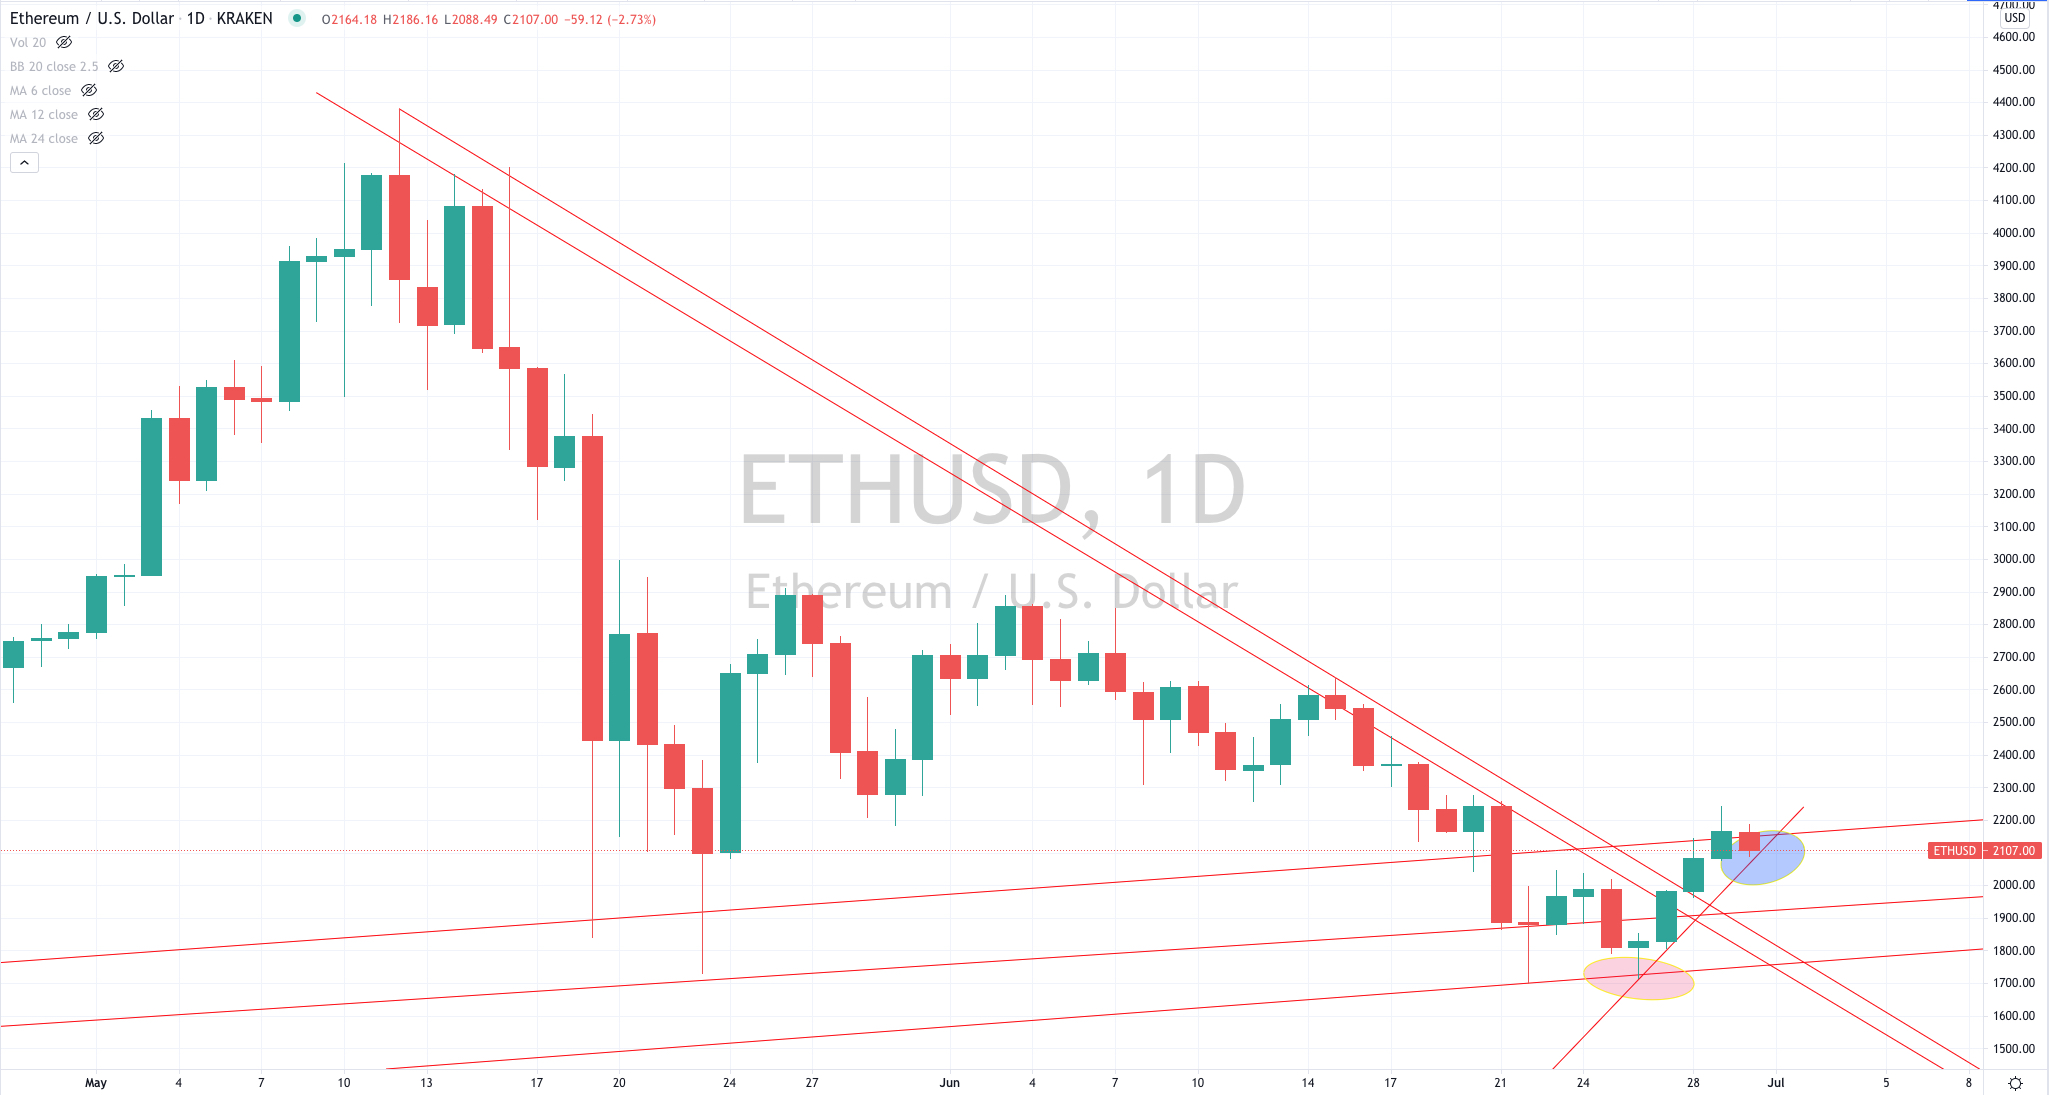
Cryptocurrencies has a negative week across the board.
During the week, Bitcoin fell 6%, Ethereum tanked 17% (compounding the previous week’s11% swoon), Litecoin slumped 17% (adding to last week’s 9% drop) and Ripple declined 20%, amplifying last week’s 12% slump.
Incidentally, no cryptocurrencies are Oversold yet.
And lastly, Bitcoin is trading 149% above its 200 Week Moving Average, which is lower from last week’s 158% reading and certainly lower when compared to its 466% peak in mid-April 2021.
June 27, 2021
by Rob Zdravevski
rob@karriasset.com.au