Ships are cheap again

Shipping your dry, bulk goods around the world is cheap again.

Is the supply chain crisis fixed?

This index is telling us that the supply chains are easing and healing.It can also mean that demand is slowing and there are more empty ships looking for customers.

The latter can also forecast slower GDP growth.


In any case, shipping prices are considerably cheaper.It is time to lock in your shipping leasing rates.


The recent story began on February 8, 2020, when the stock market was trucking along well and the cost of shipping goods around the world was cheap.


The price of shipping was near multi-decade lows and trading at a 60% discount to its rolling 200 week moving average.
Back then, the Baltic Dry Index was trading at 425.
Within a month, the coronavirus pandemic sent the stock market into a rapid decline and various manufacturing, industrial and labour constraints or bottlenecks were creating a squeeze in global supply chains.


As a result, the cost of shipping dry, bulk goods (as measured by the Baltic Dry Index) had quadrupled by October 2020.


A further year on, the Baltic Dry Index was 13 times higher. It had risen from 425 in February 2020 to 5,650 in October 2021.


That is extraordinary…..the price of leasing a ship rose 13 fold within 21 months.


What is more interesting, although completely expected, was a swift and savage retracement of that parabolic price rise.


Today, the Baltic Dry Index (BDI) is trading at 1,415.The price of shipping has fallen 75% in under 4 months.


The BDI is now trading below its rolling 4 year price average and back to a reasonable price seen repeatedly over the past 10 years.


What’s next for the BDI?


I’ll correct a comment made is a December 27, 2021 post, where I stated $900 is a plausible target.

I now think 1,150 may be an extreme low in this downdraft, while 1,220 and 1,340 would satisfy an Oversold reading.In the context of the decline, all of this is quite negligible. 


I don’t have a read if the BDI bounces again from here as was seen in 2004, 2006 or 2009 but it does mean its much cheaper to lease a bunch of ships.


Companies should be able improve their margins with these lower shipping prices.

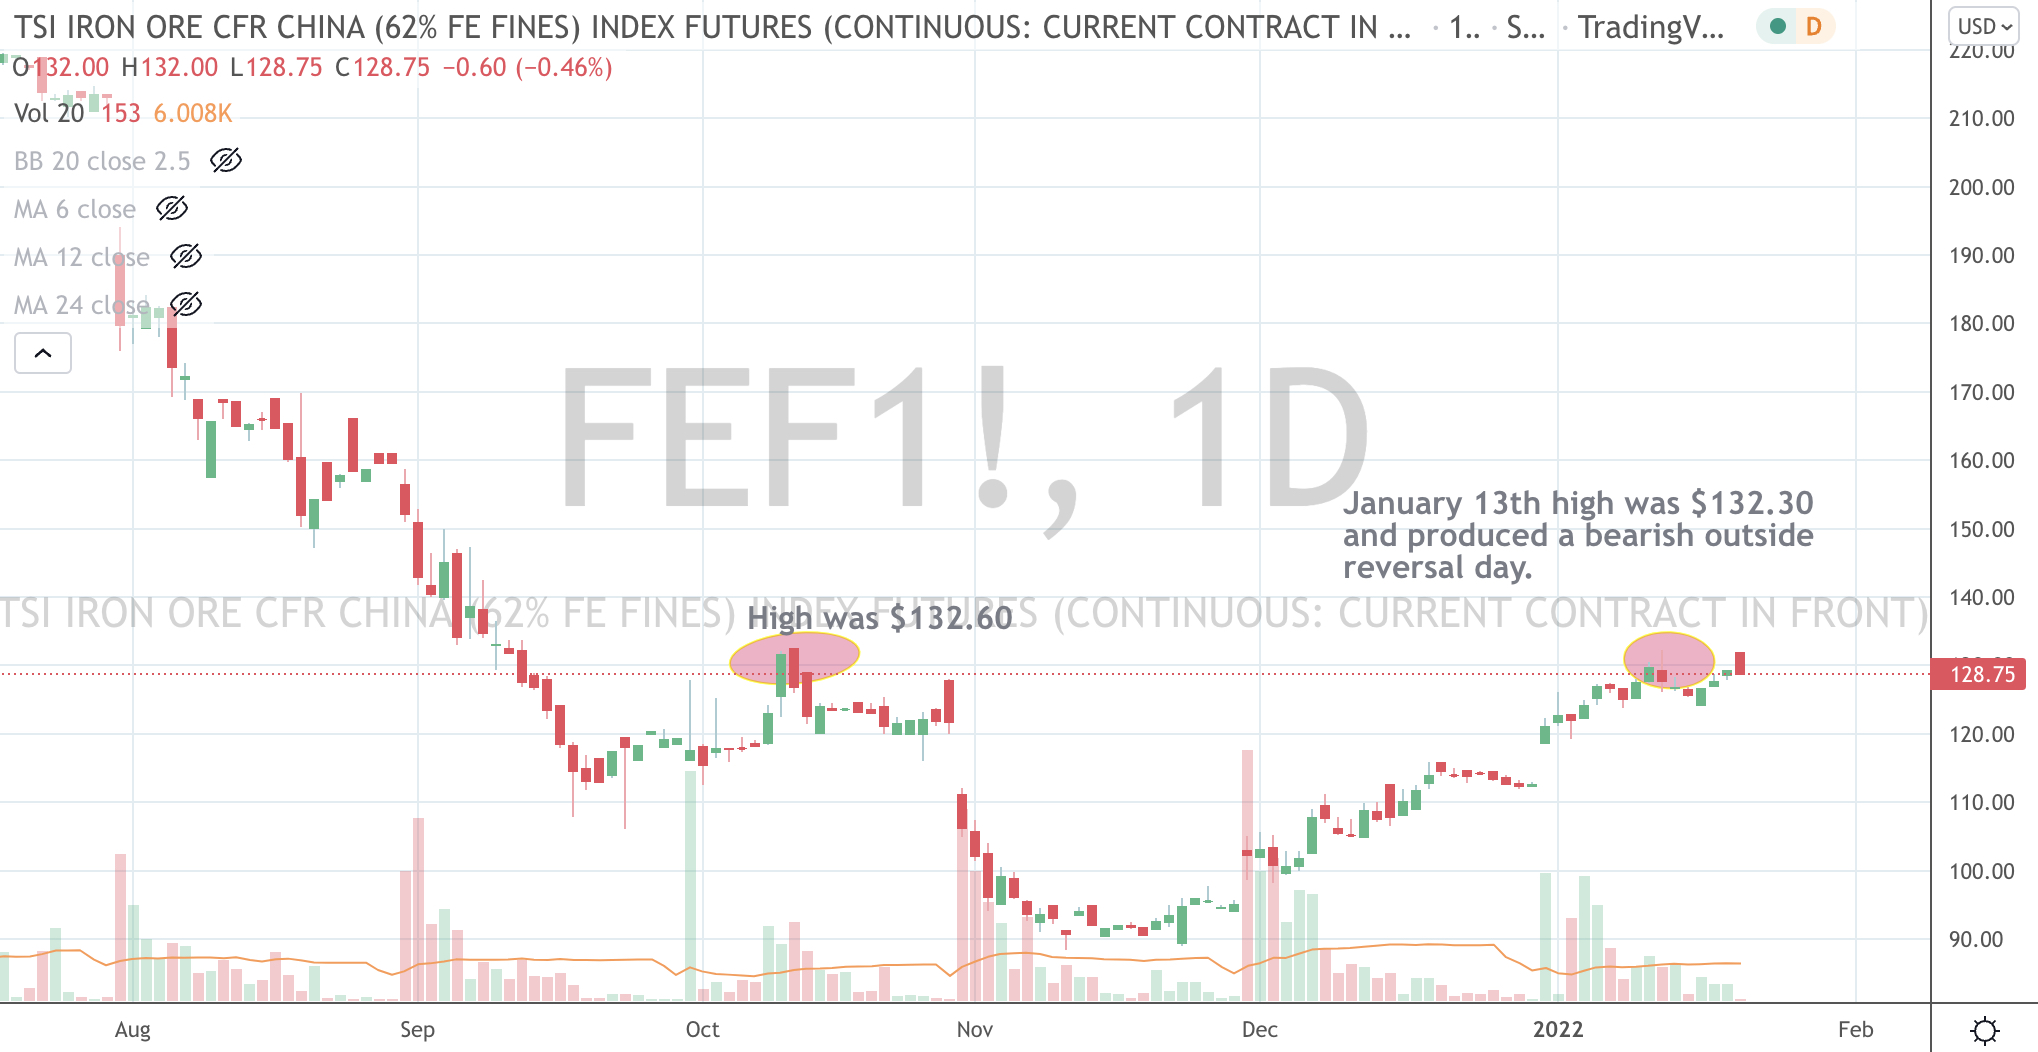
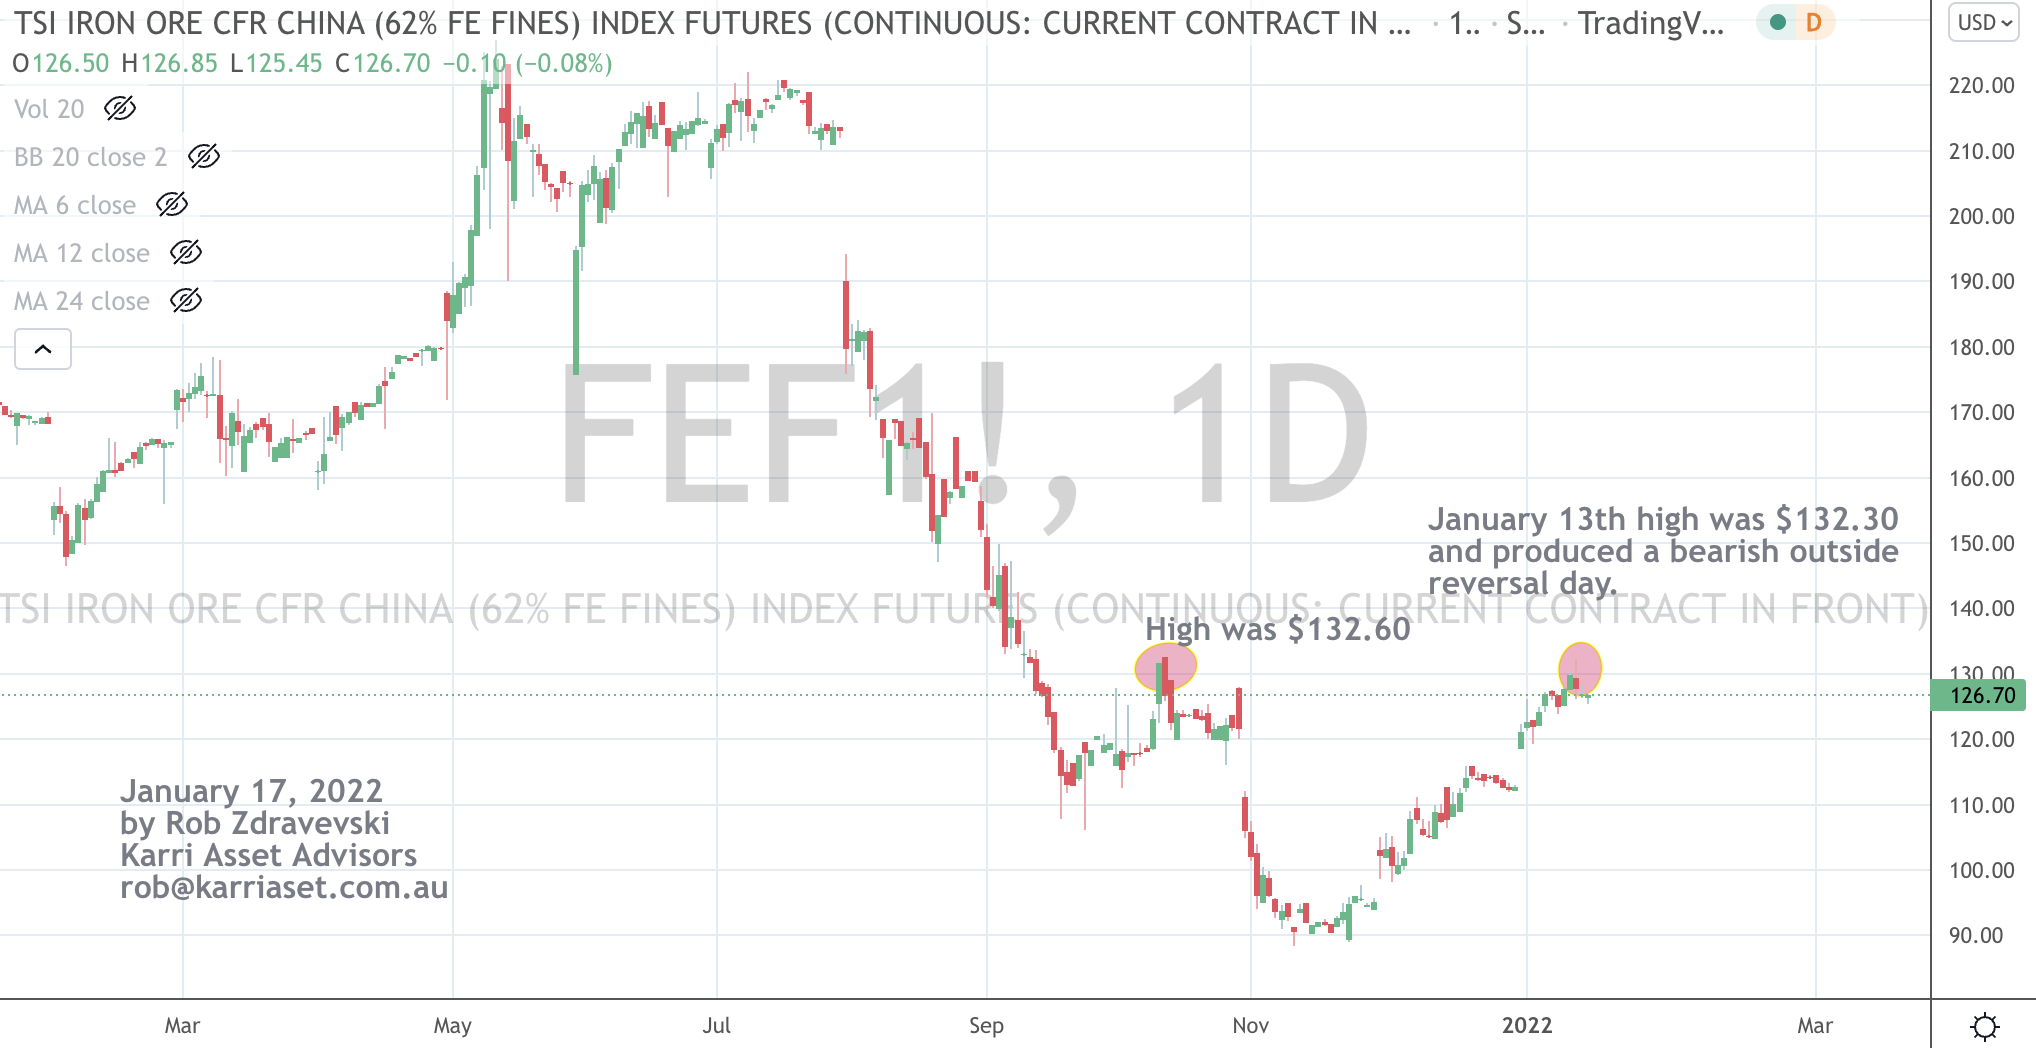
This is good for companies involved in transporting Grains, Iron Ore, Cement, Steel, Coal, Sugar, Salt and Fertilizer along with Automobiles and other finished products such as Building Materials.


Although, keep in mind that transportation is only part of chain.


My main interest are the companies who own and have the industrial capacity for they will be able to fill the output gap that I expect to persist.

January 22, 2022

by Rob Zdravevski

rob@karriasset.com.au

What Gravity Looks Like After A Visit To The Stratosphere

My latest newsletter is about the savage pullbacks seen in selected stocks following their frenzied climb.

https://mailchi.mp/karriasset/there-is-gravity-in-the-stratosphere

JP Morgan then and since

Nearly 10 years ago, (in May 2012) I wrote a post (link below) correlating an overreaction in the fall in JP Morgan’s stock price to being similar to that of BP’s decline following an oil rig explosion.

https://robzdravevski.com/2012/05/16/anatomy-of-an-overreaction/

It’s timely to re-visit the anatomy of overreactions as investors are experiencing a new downdraft in stock prices and putting it into perspective when considering a longer investing horizon.

This first chart below shows JP Morgan’s stock performance up to those weeks in May 2012, JP Morgan stock fell 25% (from $44 to $33). It was quite an event to see a major financial institution lose a quarter of its market capitalisation in such quick order.

The stock price is no stranger to volatility but I do think volatility is the price an investor pays for longer term capital gains.

So, there you see a chart where JPM was trading at the same price it was 10 years earlier, with many of peaks and troughs.

Sympathetically, the S&P 500 also paints the same picture between 2002 and 2012.

The next chart shows JP Morgan’s stock price since then.

The result has been a 500% rise with plenty of dips along the way.

A Warren Buffet quote comes to mind, ‘Only buy something that you’d be perfectly happy to hold if the market shut down for 10 years’.

And there lies a reminder that just because a company’s stock price is listed each day, one should be measured when making their next decision.

January 21, 2022

by Rob Zdravevski

rob@karriasset.com.au

Iron Ore still not taking me higher

As the week progressed, Iron Ore still didn’t / couldn’t make the higher high highlighted in my post earlier this week.

Privately Held Unicorns add little value when Public

The problem with past adoration for those privately-held unicorns is they added most or all of their shareholder value and market capitalisation whilst they were a private company and leaving little capital appreciation for their publicly listed life.

In other words, many of those companies used the stockmarket to provide liquidity and an exit for their powerful shareholders, rather than using it to raise capital for the company’s expansion and growth purposes.

One example (and there are many), shares in Uber are lower than its IPO pricing of $45 nearly 2 years ago.

The chart below shows you the ride it has been on and while there is an argument for buying it at $21 and watch it triple to $63….

My message is to highlight the disappointment for the shareholder who was sold on their ubiquitous position in the market and their fully-priced valuation, while the financial press lauded their stratospheric rise under the fog of being a privately held company.

Well done to the bankers who priced and sold the stock to punters.

Oh well, onto the next deal for them, I guess !

The next chart below show the humble chart of Google.

As a private company Uber raised $25 billion over 33 rounds while Google raised a paltry $36 million over 4 rounds.

Google then raised $1.7 billion in the IPO giving it a market cap of $23 billion.

Uber raised a further $8 billion in the IPO giving it a fully diluted market cap of $84 billion.

Caveat Emptor!

January 20, 2022

by Rob Zdravevski

rob@karriasset.com.au

US$50 billion in market cap erased

In another edition of Perspective & Misnomers,

JP Morgan’s stock price has fallen 12% in the past 3 days.
This means its market capitalisation has declined by US$55 billion.

That is the same amount as all of Westpac Bank’s total market capitalisation.

Furthermore, in the past 3 days, 95 million shares of JP Morgan were traded, which is equal to US$15.2 billion worth of stock.

This is equal to 2 days of traded value of the whole Australian Stock Exchange.

That’s a lot of money when you put in it perspective.

Incidentally, JP Morgan’s stock is back to the same price as 11 months ago.

January 20, 2022
by Rob Zdravevski
rob@karriasset.com.au

Iron Ore to double dip

Iron Ore too….is yet to make a new higher high.

Last week’s intraday high of $132.30 remains shy of October ’21’s $132.60 high.

In addition, trading in Iron Ore futures, on January 13th, 2022 produced a bearish outside reversal day.

I see risk in Iron Ore equities. The bounces have been impressive and taking the ‘fat part’ of the trade should satisfy many.

The advance wasn’t accompanied with robust volume.

I think this market will hurt the latecomers who have bought in the past week.

Markets do that sort of stuff. Shaking out those who shouldn’t be there…..is part of a market’s modus operandi.

Intuition suggests that we’ll see a test towards or close to recent lows. Perhaps I’ll call it a ‘double dip’.

At that stage, we’ll watch for any new ‘lower lows’ or where we see a consolidation.

There are plenty of ‘gap-ups’ to back and fill and the recent rally in those equities gives many a second chance to exit.

For some, it could be a ‘get out of jail free’ card.

#fmg #rio #bhp #min #ironore

January 17, 2022

by Rob Zdravevski

rob@karriasset.com.au

Gravity and the JKM LNG price

The Japan Korea Marker (“JKM”) fell 25% last week of which 22% occurred on Friday alone.

It closed at $25.25.

I expect it to (and it’s trying to) retrace or mean revert that parabolic move seen through 2021.

$22.50 is now an important support level which represents a 62% retracement from the $6 trough seen in March 2021.

Ultimately, $15.20 would be a better place to rest once it has ‘blown-off’ that sharp rally.

In the weekly chart below, the rolling mean illustrated is a 200 week moving average.

That average currently reads $9.55, however I expect it to roll (sharply) higher in the coming months, in essence converging
to a point that may be close to the $15 level mentioned above.

So, what does this mean?

Sellers should have already been locking in their forward price over the past few months, while I also expect lower equity prices in LNG producers as JKM pulls back a little more.

So, patience is a virtue for buyers.
Wait for your price, Wait for your pitch.

n.b. The JKM price reflects the spot market value of cargoes delivered ex-ship into Japan, South Korea, China and Taiwan.

January 17, 2022
by Rob Zdravevski
rob@karriasset.com.au

Oil about to hit a 3 1/2 year high

It’s an important coming day or two in Brent Crude Oil trading.

I’m watching if it trades above $86.68.

Friday’s high was $86.52.

That means it makes a ‘higher high’ seen on October 25, 2021.

Albeit, a ‘higher high’ while also recent making a ‘lower low’ portends for an extension of the current rally, on a Daily basis, Brent is now in Overbought territory and 2 standard deviations above its mean.

Whilst the chart below is current, it has notes on it from a post on November 5th, 2021, which also shows the previous high in Brent at $86.71 from October 3, 2018.

January 17, 2021

by Rob Zdravevski

rob@karriasset.com.au

Macro Extremes (week ending January 14, 2022)

The following assets (on a weekly timeframe) registered an Overbought reading or traded more than 2.5 standard deviations above its rolling mean.

Extremes “above” the Mean (at least 2.5 standard deviations)

Portugal 10 year government bond yields

Overbought (RSI > 70)

U.S. 2 and 5 year bond yields

Australian 2 and 5 year bond yields

Russian 10 year bond yields

Australian Coal

Coffee

Lumber

Tin

The Overbought Quinella – Both Overbought and Traded at > 2.5 standard deviations above the weekly mean)

Japanese 10 year bond yields

Assets (securities) which touched the other side of the extreme, being Oversold (where the RSI is < 30) or were at least 2.5 standard deviations below its mean are;

Extremes “below” the Mean (at least 2.5 standard deviations)

None

Oversold (RSI < 30)

Sugar

The Oversold Quinella – Both Overbought and Traded at > 2.5 standard deviations above the weekly mean.

None


Notes & Ideas:

The big news in global markets was the relative quiet action in equity indices.

Equally, bond yields were more subdued this past week, except for the Australian 2 year government bond yield, which soared from 0.46% to 0.76%.

With the Australian 10’s unchanged for the week, the Aussie government 10 year minus 2 year bond yield spread hit a new weekly low, not seen since August 16, 2021 and February 1st, 2021.

Those moments signalled the beginning of a rally in the ASX 200 equity index.

Last week, I wrote that the German 10 year bonds moved from (0.18%) to (0.04%) and from a price of (0.38%) 3 weeks ago. Alas, the German 10’s didn’t turn positive closing unchanged at (0.037%).

Seeing Japanese 10 year bond yields double last week from 0.07% to 0.14%, they continued their rise to 0.165%. More about JGB’s later.

Additionally, the Japanese Yen rose from its multi-year low.

In other news and observations, Soft Agricultural’s were weaker, Coal, Gas and Oil were higher for the week as were some base metals, Hot Rolled Coiled Steel rose 1.6% and moved out of Oversold territory. The Russian equity index is nearly Oversold, the Nikkei 225 looks like like commencing a new decking trend, the Nasdaq 100 and the CRB (Commodity) Index is nearly Overbought while the mean reversion in assets such as the Japanese Korean Marker (JKM) is on its way.

The larger advancers over the past week comprised of; 

Aluminium 2.7% (up 7.5% in 2 weeks), Australian Coal 4.1% (up 12% in 2 weeks), Rotterdam Coal 9.8% (up 27% in 2 weeks), Bloomberg Commodity Index 2.2%, China Coal 4.9% (mimicking last week’s return), WTI Crude 6.2% (up 11% in 2 weeks), Gasoil 5.2% (up 12% in 2 weeks), Heating Oil 6.1%, Lumber 6.6%, Tin 3.8%, Natural Gas 8.8%, Nickel 4.1%, Orange Juice 5.3%, Gasoline 5.2%, Silver 2.3%, CRB 3.2%, Brent Crude 5.5%, HSCEI 3.9%, Bovespa 4.1%, Istanbul 2.9%, Singapore Strait Times 2.4%, SOX 2.8% and India’s Sensex rose 2.5%.

The group of decliners included ;

Baltic Dry Index (23%) (having fallen from a October 4 high of 5,650 to 1,764), the Japan Korea Marker “JKM” (26%), Palladium (2.3%), Oats (8.9%), Wheat (2.2%), Soybean (2.9%), Corn (1.7%), Rice (1.4%), Urea (2.4%), CSI China 300 (1.6%), DJ Transports (2.2%), MOEX (4.2%), Swiss SMI (2.1%), Shanghai Composite (1.6%), Stockholm 30 (1.8%), Helsinki 25 (1.8%), Copenhagen 25 (2.8%) adding to last week’s 5% decline.


January 16, 2022

by Rob Zdravevski

rob@karriasset.com.au