Extremes “above” the Mean (at least 2.5 standard deviations)
French 10 year government bond yields
Japanese 10 year government bond yields
U.S. 10 year government bond yields
Overbought (RSI > 70)
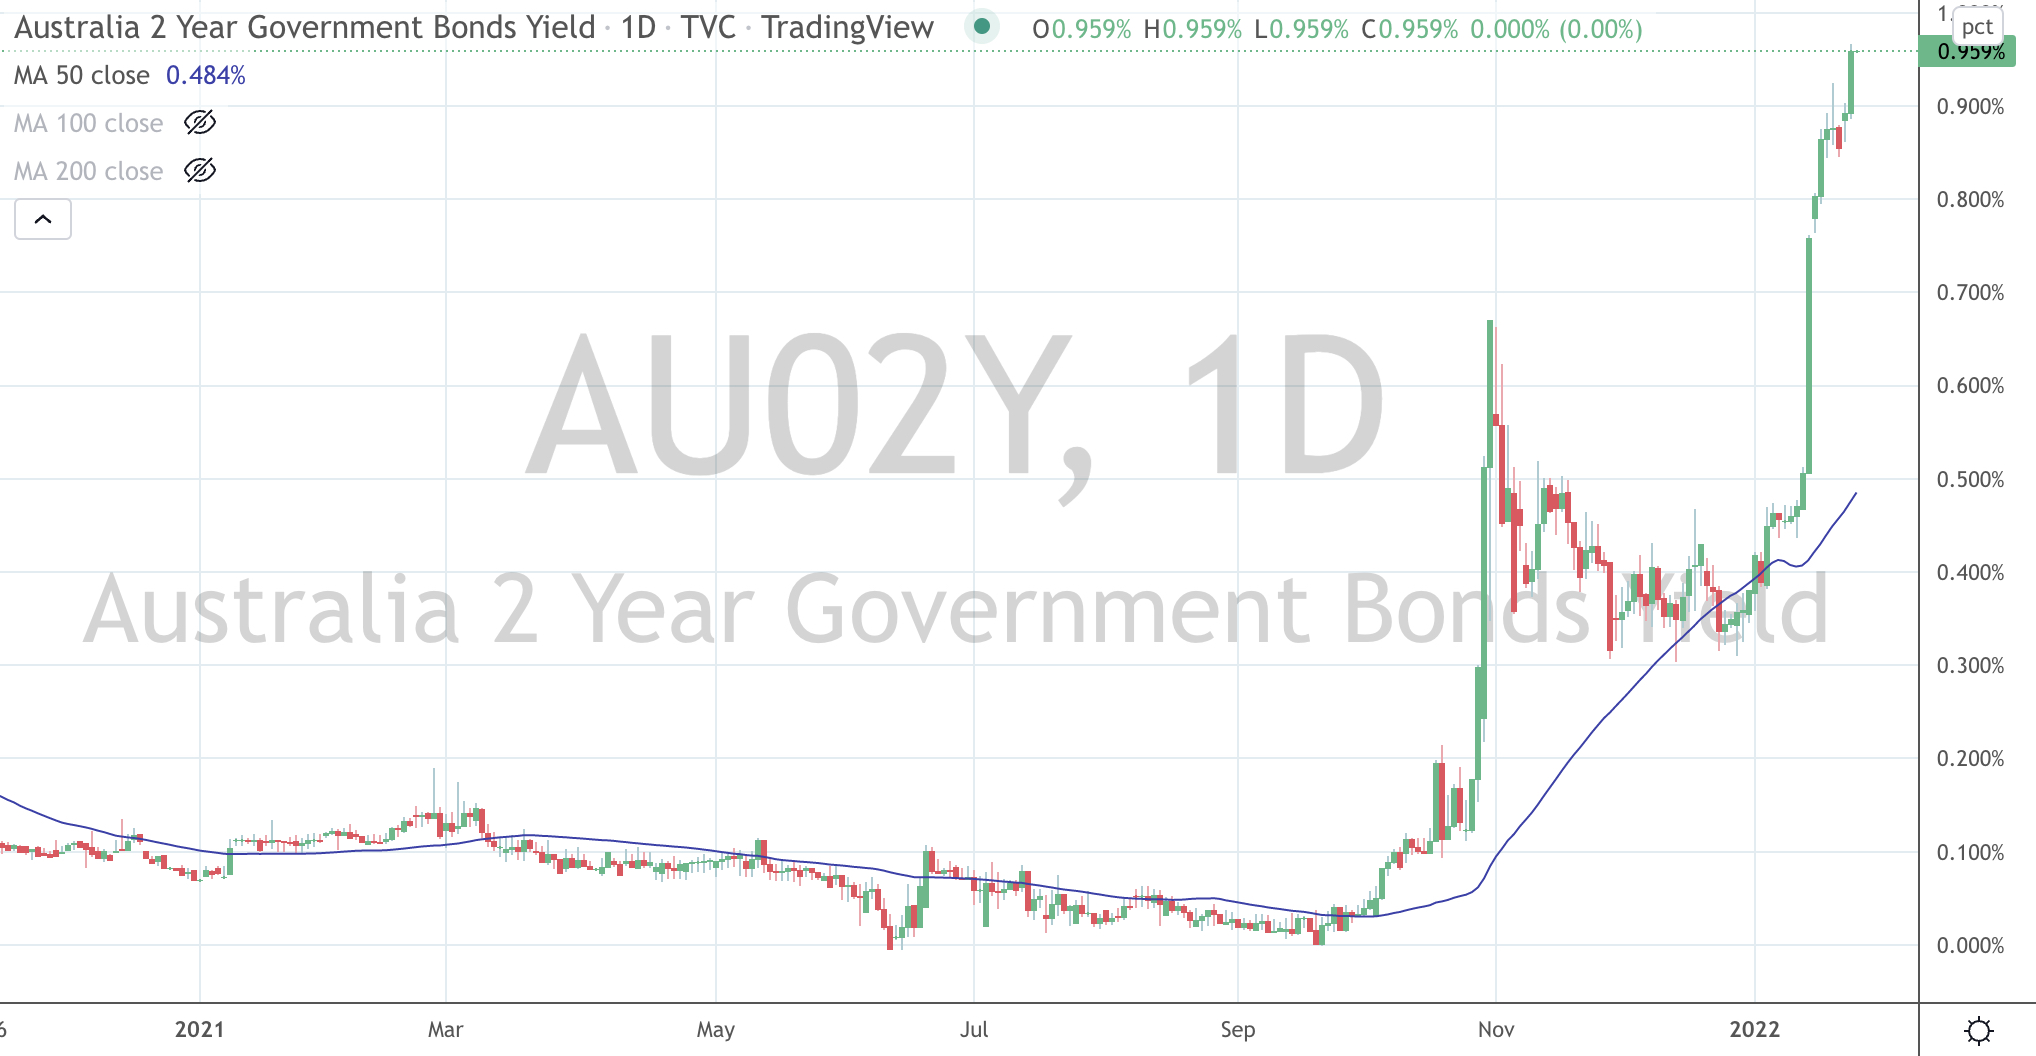
Australian 2 and 5 year bond yields
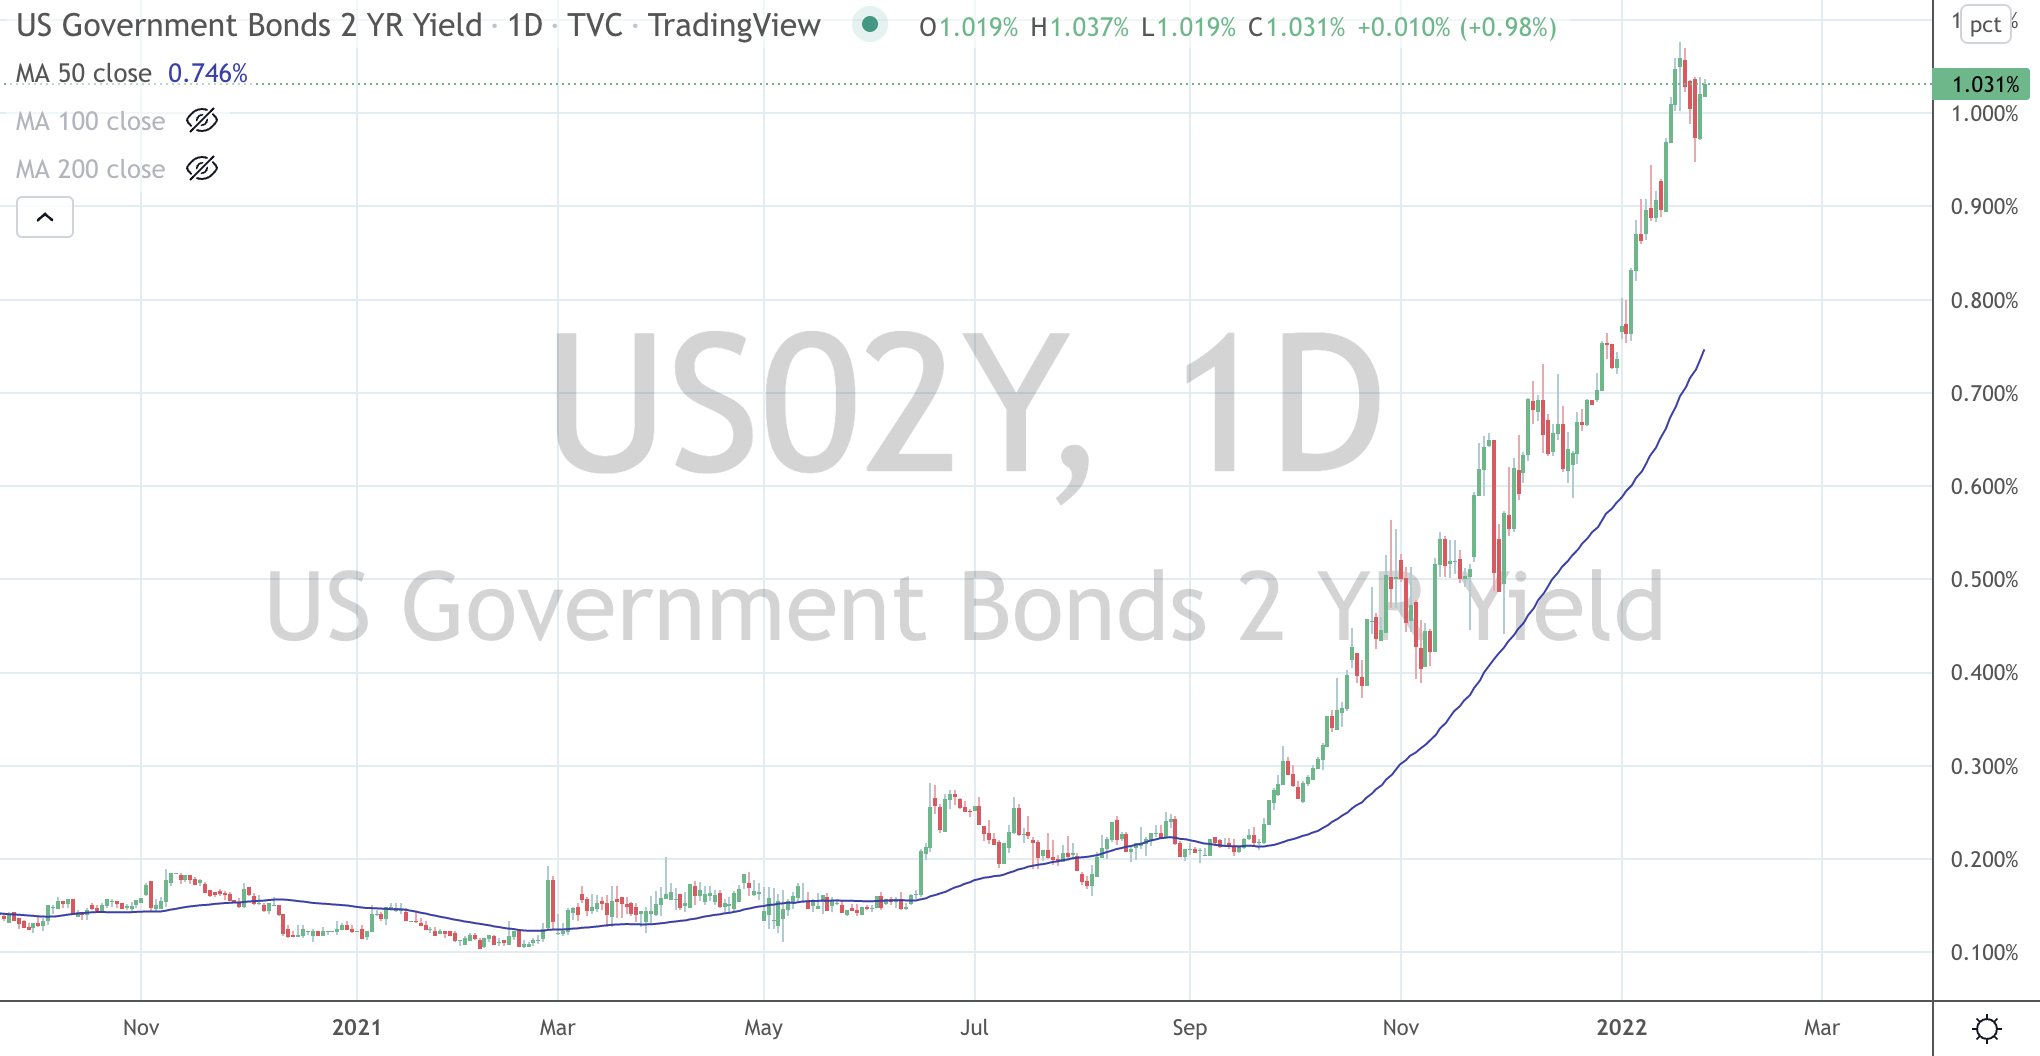
U.S. 2 year government bond yields
Greek 10 year government bond yields
Russian 10 year bond yields
Australian Coal
Tin
CRB Index
Cotton
WTI Crude Oil
Gasoil
The Overbought Quinella – Both Overbought and Traded at > 2.5 standard deviations above the weekly mean)
U.S. 5 year government bond yields
Nickel
Orange Juice
Extremes “below” the Mean (at least 2.5 standard deviations)
Chinese government 10 year bond yields
Ethereum
EUR/GBP
Korea’s KOSPI Index
Russia MOEx Equity Index
Russell 2000
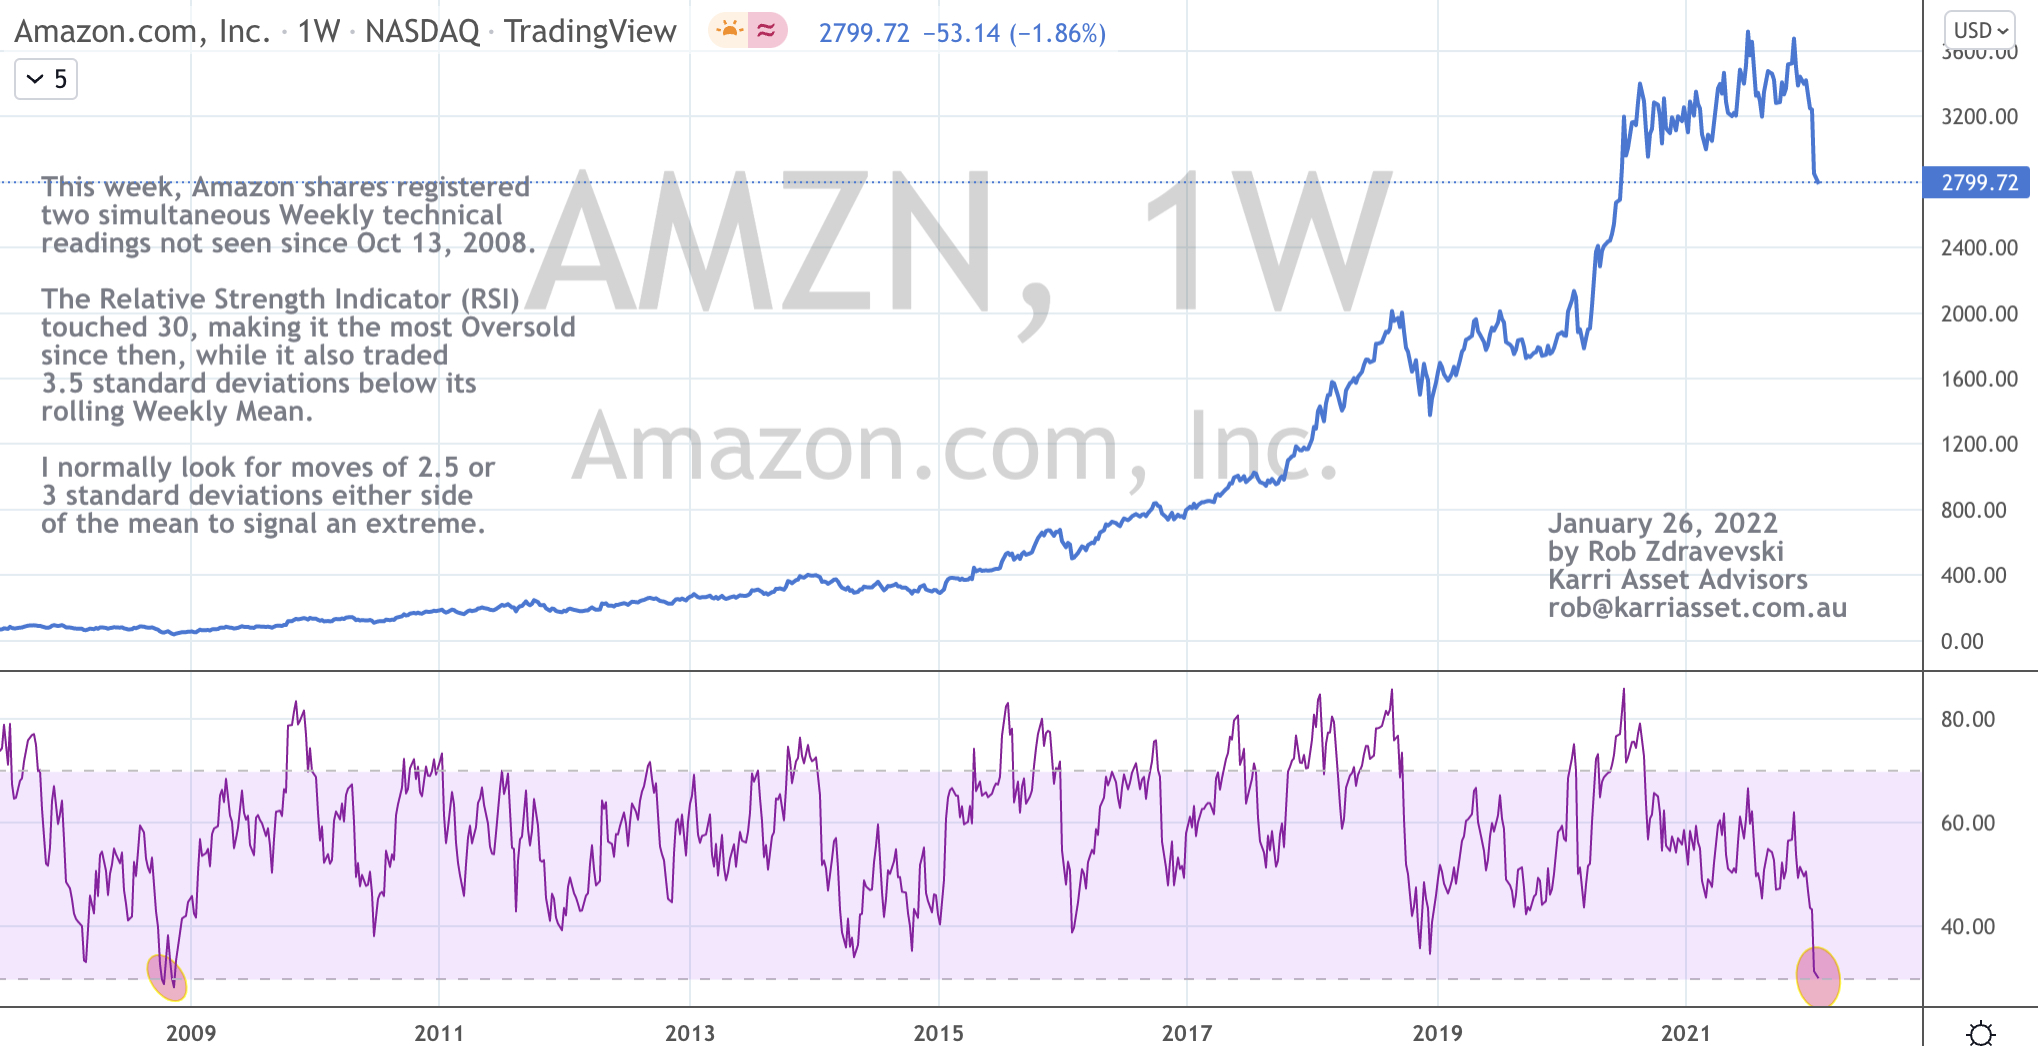
Oversold (RSI < 30)
Hot Rolled Coil Steel
Notes & Ideas:
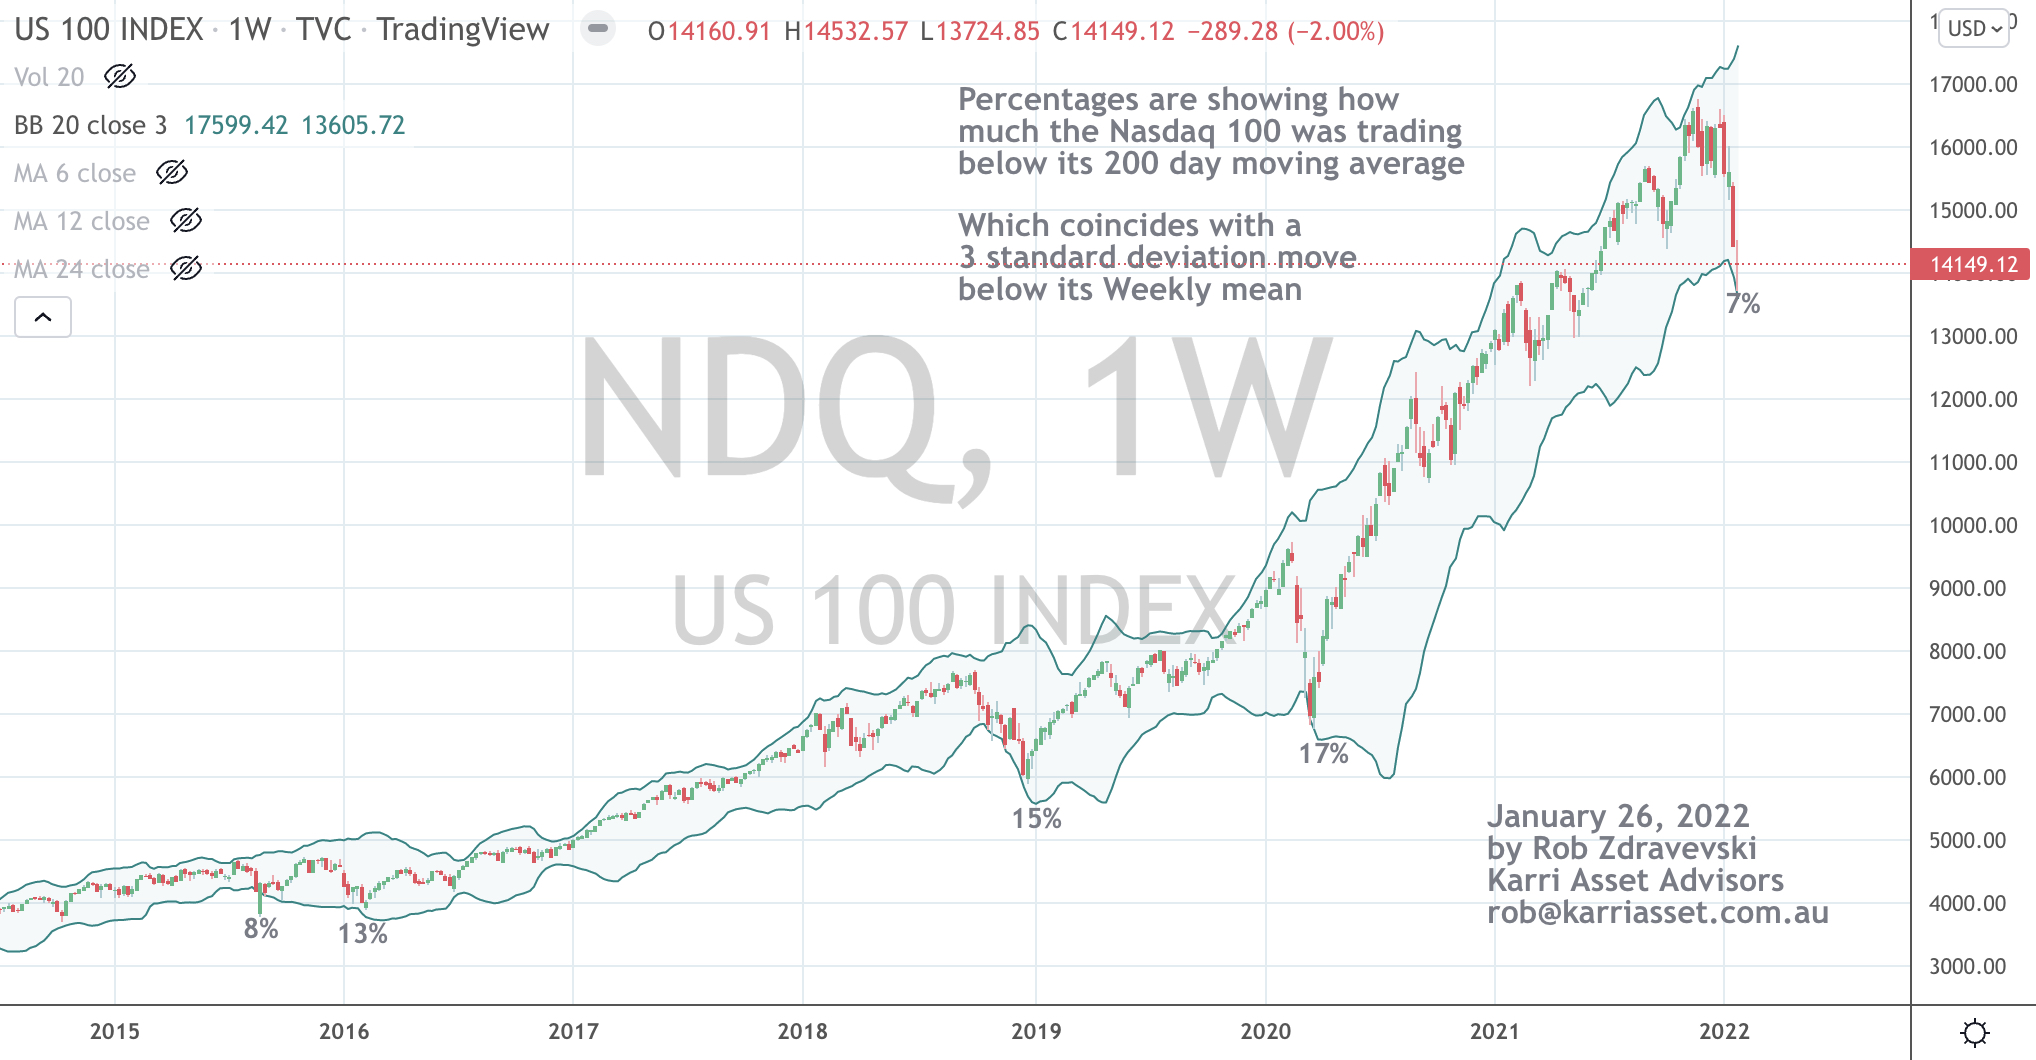
Last week’s post mentioned the quiet equity market. This week was a doozy, especially in the U.S. markets.
Interestingly, France’s CAC-40 only declined 1%, while China’s CSI 300 rose 1%, Shanghai was flat and the U.K.’s FTSE 100 barely fell 0.6%.
It proves there are places to hide and it pays to be global.
Funny how the world works….
The second notable piece of news was that assets weren’t acting in the manner they should have.
For example, bond yields rose. For example, the U.S 2 year bond yield rose from 0.97% to 1.01%.
This means bonds were being sold while equities were also fallen. It was difficult to find what the safe haven was.
p.s. that safe haven wasn’t Bitcoin, for it fell 16% on the week and the others one (Gold) barely rose.
German 10 year bond yield traded positive for the first time in 2.5 years
Coal continues its winning streak;
Coffee and Lumber moved lower and is no longer Overbought;
Some commodities in the energy complex became Overbought;
Steel is Oversold;
Selected government yields rose to extremes during the week before easing.
And on Monday, the ASX 200 Index will hit an extreme 2.5 standard deviation reading below its weekly mean.
The larger advancers over the past week comprised of;
Aluminium 2.1% (up 10% in 3weeks), Australian Coal 3.6% (up 16% in 3 weeks), Rotterdam Coal 5.2% (up 32% in 3 weeks), Bloomberg Commodity Index 1.8%, WTI Crude 2.2% (up 13% in 3 weeks), Gasoil 2.7%, Heating Oil 2.2%, Copper 2.3%, Tin 5.9%, Nickel 11.6%, Orange Juice 4.9%, Platinum 7.3%, Sugar 3.2%, Silver 6.1%, Corn 3.6%, Rice 2%, Soybean 3.3%, Wheat 5.2%, Oats 2.3%, Palladium 12%, HSCEI 2.7%, Hang Seng 2.4% and Brazil’s Bovespa rose 1.9%.
The group of decliners included ;
Baltic Dry Index (19.8%) (having fallen 77% in 4 weeks), the Japan Korea Marker “JKM” (12.5%) having declined 57% in 5 weeks, Cocoa (3.1%), Natural Gas (6.2%), Lumber (12.6%), Dutch TTF (9.2%), Uranium (3%), Bitcoin (16%), Cardano (22.9%), Ethereum (24.8%), AEX (2.5%), KBW Banking Index (10%), DAX (1.8%), Dow Jones Industrials (4.7%), Dow Jones Transports (4.1%), MIB (1.8%), Kospi (3%), S&P MidCap 400 (6.8%), MOEX (4.4%), Nasdaq 100 (7.5%), Nikkei 225 (2.1%), Oslo (3%), Copenhagen (1.9%), Helsinki (3%), Stockholm (1.9%), Russell 2000 (8.1%), Philadelphia Semiconductor Index (12%), S&P 500 (5.7%), Taiwan’s TAEIX (2.7%), Nasdaq Transports (6.9%), Istanbul (2.8%) and India’s Sensex fell 3.5%.
January 23, 2022
by Rob Zdravevski
rob@karriasset.com.au