Coming next: The great Corn unwind

The green line in lower chart tells us that number of ‘long’ positions held by financial speculators in Corn futures is at its highest since 1996.

Watch the correlation when the green line is barreling towards above than average heights and that of the highs being seen in the corn price…..and then see what happens to the corn price when the ‘great unwind’ occurs.

Incidentally, the red line in the lower chart show that producers (growers) are immensely net short. Meaning they are taking these forward prices as future payment. Of course they should.

If you a commercial participant in the corn market, it’ll be wise to wait a little longer before buying your corn. History and logic tells me you’ll get lower prices.

And today, Bloomberg have published this story;

May 6, 2021

by Rob Zdravevski

rob@karriasset.com.au

Currencies are in focus again

I’m watching currencies a little more closely this week and their subsequent relationship to commodity prices.

Currently, the Canadian Dollar (vs the USD) is registering an Overbought extreme not seen since September 2017 and again in April of 2011.

Furthermore, the AUD/USD (0.7730) is showing trending signs of moving lower.

Today, the AUD/JPY (84.53) has posted a bearish outside reversal day.

Should the 2 latter currencies confirm their new downtrends, expect to see lower commodity prices.

The consensus and herd are all long commodities at the moment and not many think they can go lower.

An unwinding of some historically ‘long’ contract positions being seen in the futures markets could turn ugly, especially if the Loonie (CAD) trades below 0.7950.

May 6, 2021

by Rob Zdravevski

rob@karriasset.com.au

What if rates double?

The $1.2 trillion of household deposits held in Australian banks doesn’t seem like it could move the needle, should all be deployed into the Australian residential real estate market, which has a cumulative value of approx. $8 trillion.

This assumption means all of the deposits are spent and leaving none for a rainy day, and what if a further $1 trillion is borrowed…..

then $2 trillion (in this sudden and assumed acquisition wave) could make an impact although Australia(ns) rank perilously high amongst the global rankings of;

a) personal household debt as a percentage of disposable income and

b) personal household debt versus GDP.

So, then……what if mortgage interest rates double from 2% to 4%?

May 5, 2021

by Rob Zdravevski

rob@karriasset.com.au

And so it has reverted to the mean

To follow up to the immediately previous post and with a focus on Spain’s IBEX 35.

I also ask readers to reference this link to a post from October 2020, where in amongst my Buy recommendation I made mention that I’ll  watch or expect the IBEX to mean revert to its longer-term 200 Month Moving Average.

Well, the 2 charts attached show the IBEX 35 in a Weekly and a Monthly form and my profit-taking senses are heightened today as the IBEX is touching its 200 Week Moving Average, while the Monthly equivalent is still 11% higher.

This is when you need to think about how to manage this investment position.

And so I ponder, after seeing a 33% return in 7 months, how much risk do I take in trying to squeeze out a further 11% ?

And then compared to an increased probability of an equal 11% decline from today’s price.

May 5, 2021

by Rob Zdravevski

rob@karriasset.com.au

Spain’s IBEX 35 Equity Index on a Weekly Basis
Spain’s IBEX 35 Equity Index on a Monthly Basis

An adequate return for the risk taken

7 months ago I made these macro Buy calls on Spain’s IBEX and U.K.’s FTSE 100 equity indices.

Since then they have risen 33% and 19% respectively.

Although you can always dig around to find better comparative returns, when adjusting for the risk taken, I’m quite pleased.

In other words, it’s more than an adequate return for the risk taken.

In fact, there is probably too much complacency and expectation about what is considered an adequate return.

Incidentally, they are nearing my ‘sell’ signal.

May 5, 2021

by Rob Zdravevski

rob@karriasset.com.au

Up via the stairs

I love a good corporate spin-off.

PayPal’ spin-off from eBay was a tremendous investment for clients.

Last year, in the midst of a market meltdown, United Technologies (UTX:US) spun off their Otis (the escalator and elevator business) and Carrier Global (the heating, ventilation, and air conditioning company).

Carrier shares have tripled in the past 12 months and Otis’ have nearly doubled.

Market conditions presented an opportune moment to accumulate the stocks especially when combined with ETF managers divesting their newly assigned stock holdings as they didn’t meet their index weighting criterium etc etc.

Who would of thought that the shares of an elevator business would climb in value in amongst a pandemic which disrupted the commercial office real estate market?

Today, I’m trimming the Otis Worldwide position.

May 4, 2021

by Rob Zdravevski

rob@karriasset.com.au

Investment Theme – the anti ESG theme

My latest newsletter is brief and not climate change friendly.

May 4, 2021

by Rob Zdravevski

rob@karriasset.com.au

More about the Copper/Gold Ratio

In an earlier post covering the Copper/Gold Ratio, I mentioned how the ratio is helpful in taking the ‘temperature’ of the economy but it is most correlated to the U.S. Government 10 Year Bond Yield, as the chart below shows.

In the chart below, the Copper/Gold Ratio is represented by the red line.

A sharp rise in this ratio is often driven by outsized price rises in copper when compared to the gold price, which is the case presently.

It’s difficult to discern who leads who but I can tell you that the Copper/Gold Ratio and the 10 Year Bond Yield are both Overbought on a longer term weekly basis’.

May 2, 2021

by Rob Zdravevski

rob@karriasset.com

Macro Extremes (week ending April 30, 2021)

The following assets (on a weekly timeframe) registered an Overbought reading or traded more than 2.5 standard deviations above its rolling mean.


Extremes “above” the Mean (at least 2.5 standard deviations)

Coffee

Sugar

Italian Government 10 Year Bond Yields


Overbought (RSI > 70)

Canadian 10 year bond yields (for 11th consecutive weeks)

German, French, Korean Government 10 year bond yields

along with the U.S. 5 and 10 year bond yields

The Copper/Gold Ratio

The Commodities Indices (the CRB and Bloomberg’s)

Iron Ore (for the 3rd consecutive week)

Aluminium (for 10 consecutive weeks)

Copper (for the 20th consecutive weeks)

Lean Hogs (for the 11th consecutive week and its highest price since July 2014)

S&P 500 Index (for the 4th consecutive week)

Dow Jones Industrial Average (for the 4th consecutive week)

S&P Mid Cap 400 (8th consecutive week)

U.S. KBW Banking Index (9th consecutive week)

Nasdaq Transportation Index  (8th consecutive week)

Dow Jones Transport Index (8th consecutive week)

Sweden’s OMX 30 Equity Index (9th consecutive week)

France’s CAC-40 Equity Index (for the 3rd consecutive week)

Ethereum


The Overbought Quinella – Both Overbought and Traded at > 2.5 standard deviations above the weekly mean)

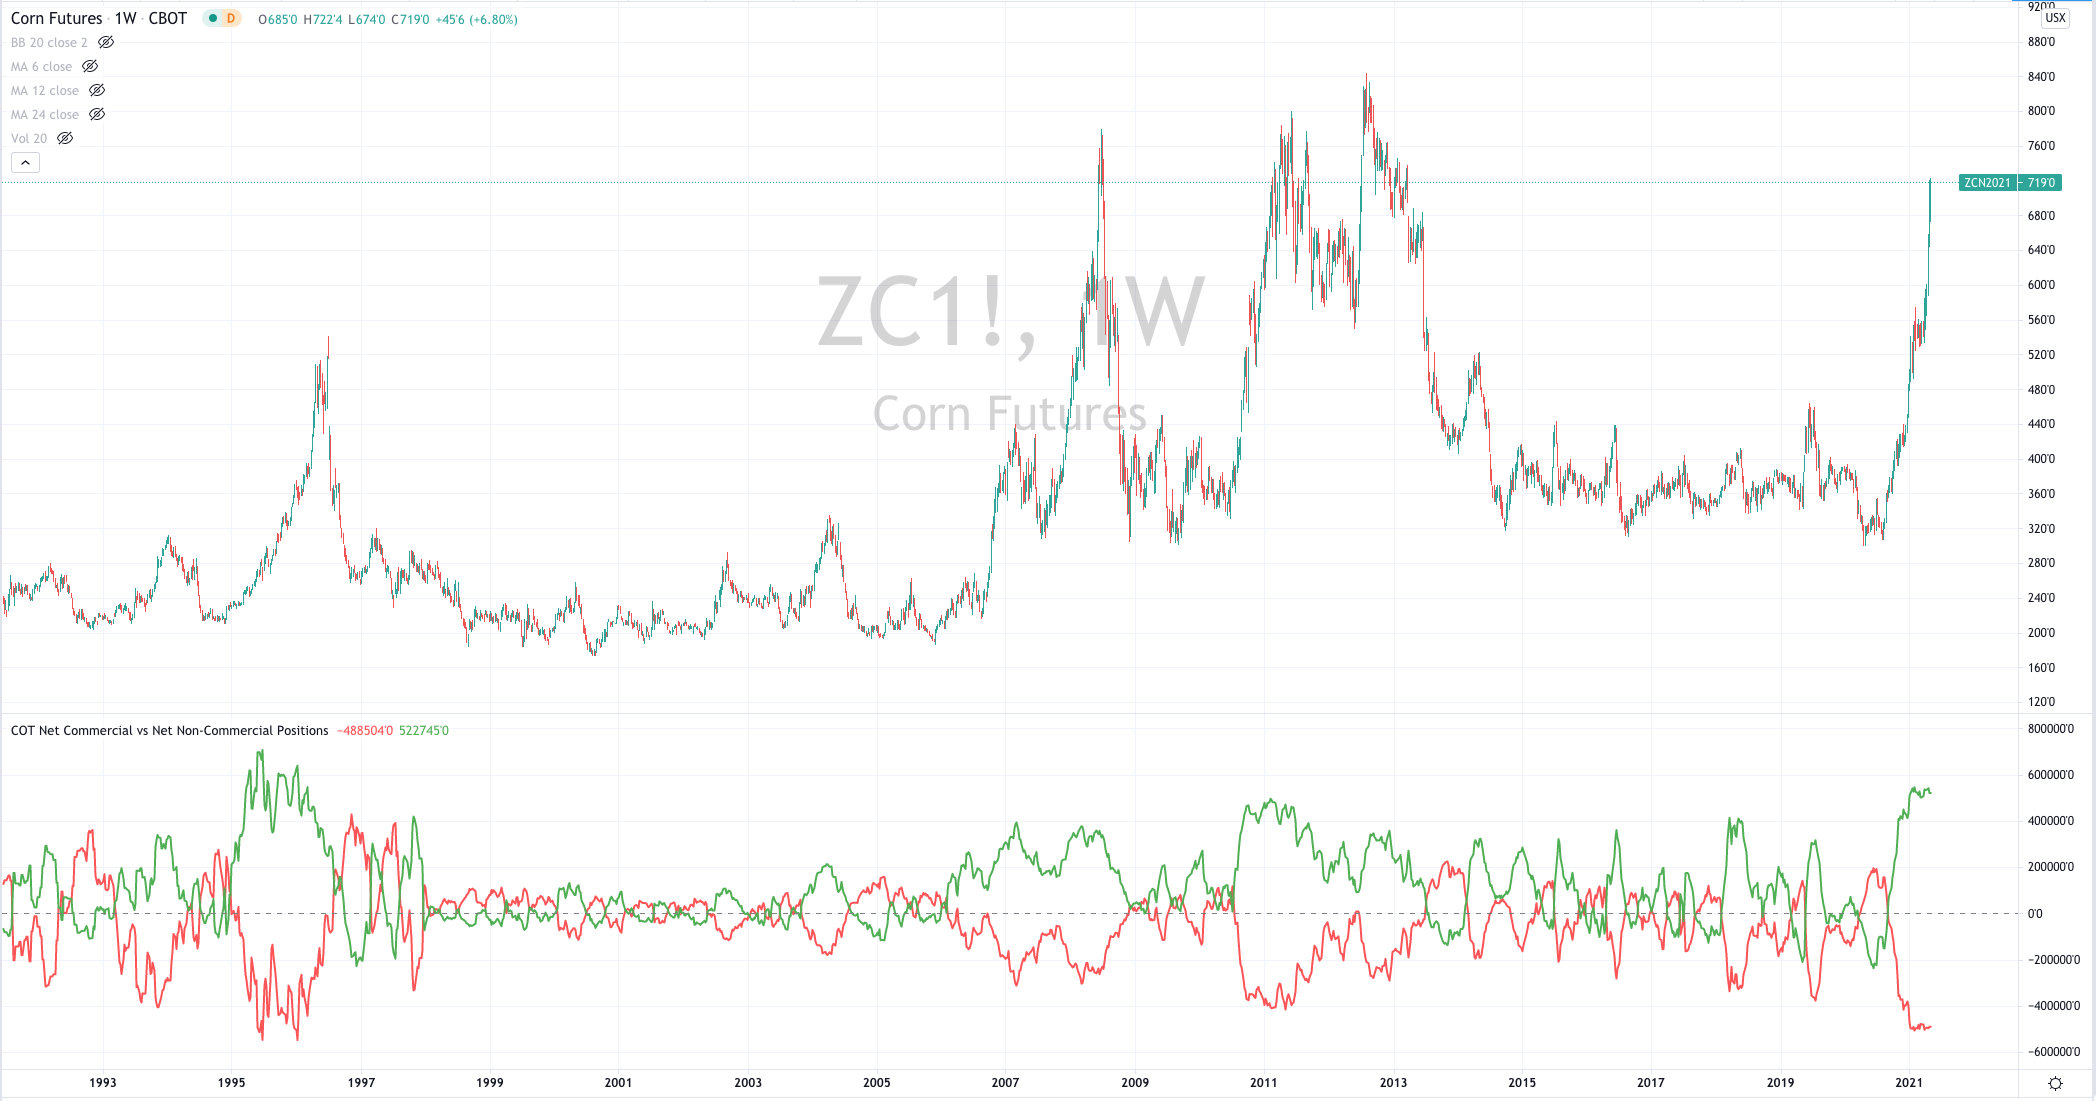
Corn (for the 21st consecutive week & trading 73% above its 200 Week Moving Average)

Soybeans (overbought for 8 consecutive weeks & 73%> its 200 Week Moving Average)

Lumber (having risen 55% in past 6 weeks)

Wheat

Cryptocurrencies Dogecoin, Ripple (XRP) & Monero

Assets (securities) within my immediate universe which touched the other side of the extreme, being Oversold (where the RSI is < 30) or were at least 2.5 standard deviations below its mean are;


Extremes “below” the Mean (at least 2.5 standard deviations)

Nil


Oversold (RSI < 30)

Nil

The Oversold Quinella – Both Oversold and Traded at < 2.5 standard deviations above the weekly mean)

USD/CAD

(meaning sell your strong Canadian Dollars against the weaker U.S. Dollar)


Notes & Ideas:

The ‘softs’ have continued their rise, more so this past week.

Another notable occurrence is the return of Government 10 Year Bond Yields to the  Overbought side of the ledger.

On the equities front, the U.S indices continue to linger in overbought territory as does France’s CAC-40, while the ASX 200 has eased lower from its standard deviation stretch.

The only currency registering an extreme is the strong Canadian Dollar vs. the USD, which coincides with strength seen the broader Commodity Indices.

If you are wondering, the AUD/USD was last Overbought in mid-February 2021, when it traded to a high of 0.8007.

and selected cryptocurrencies remain overbought.

May 2, 2021

by Rob Zdravevski

rob@karriasset.com.au

Health Check – the Copper/Gold Ratio

The watching the direction (not necessarily its value) of the Copper/Gold Ratio helps me reading the health of the economy.

And it has been healthy….

It’s particularly correlated with the direction of the U.S. Government 10 Year Bond Yield. More on that in the next post.

The chart below shows us the 6 moments when the Copper/Gold Ratio has registered an Overbought reading over the past 20 years.

Such occurrences correlate to and increase the probability of lower prices in the S&P 500 Index or at the very least see it trade sideways for the coming months. This also coincides with my thesis in my recent newsletter.

https://mailchi.mp/karriasset/quadrupling-yields-increases-equities-risk-2

What this chart tells you is that probability does not suggest ‘going long’ or making any meaningful capital deployment into equities at this juncture.

May 2, 2021

by Rob Zdravevski

rob@karriasset.com.au