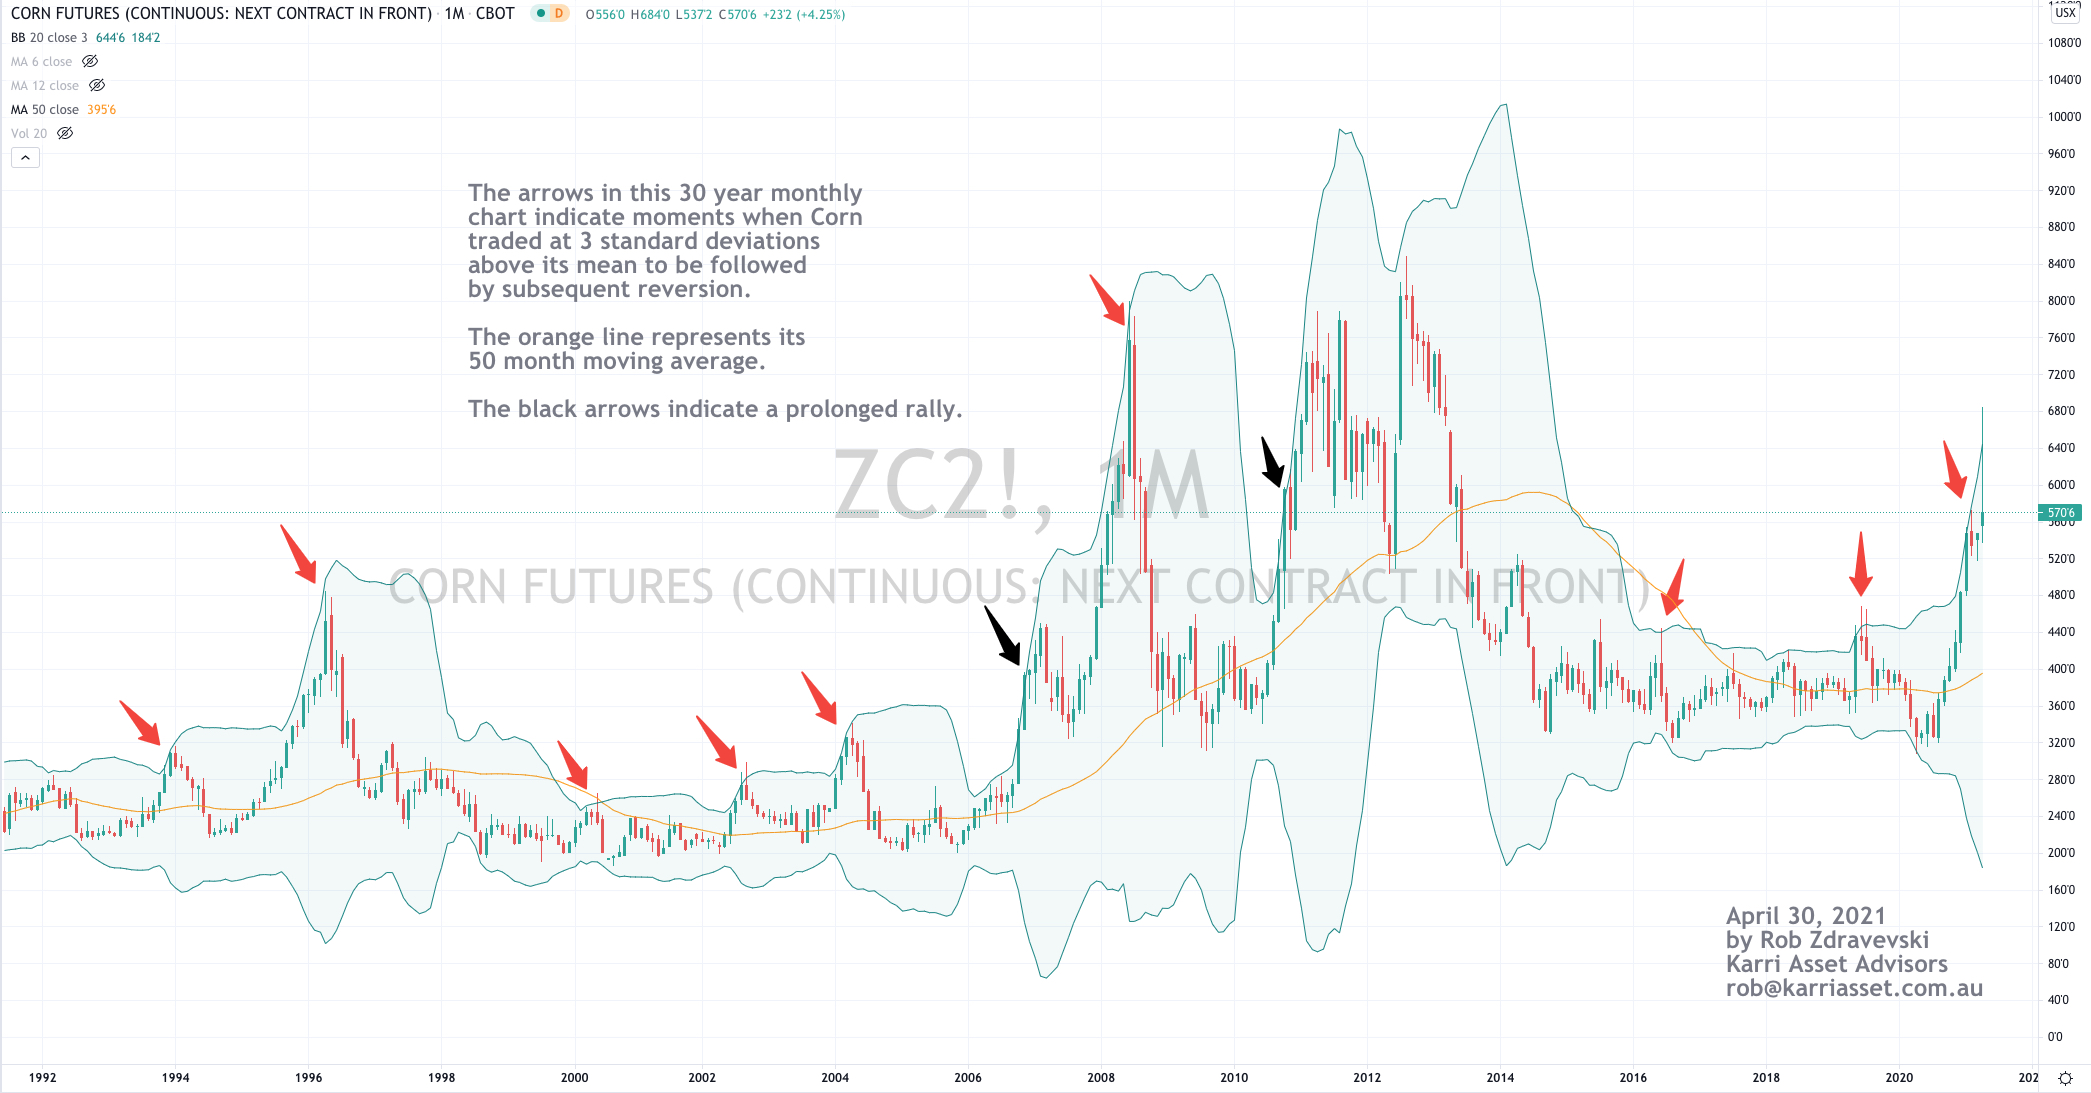
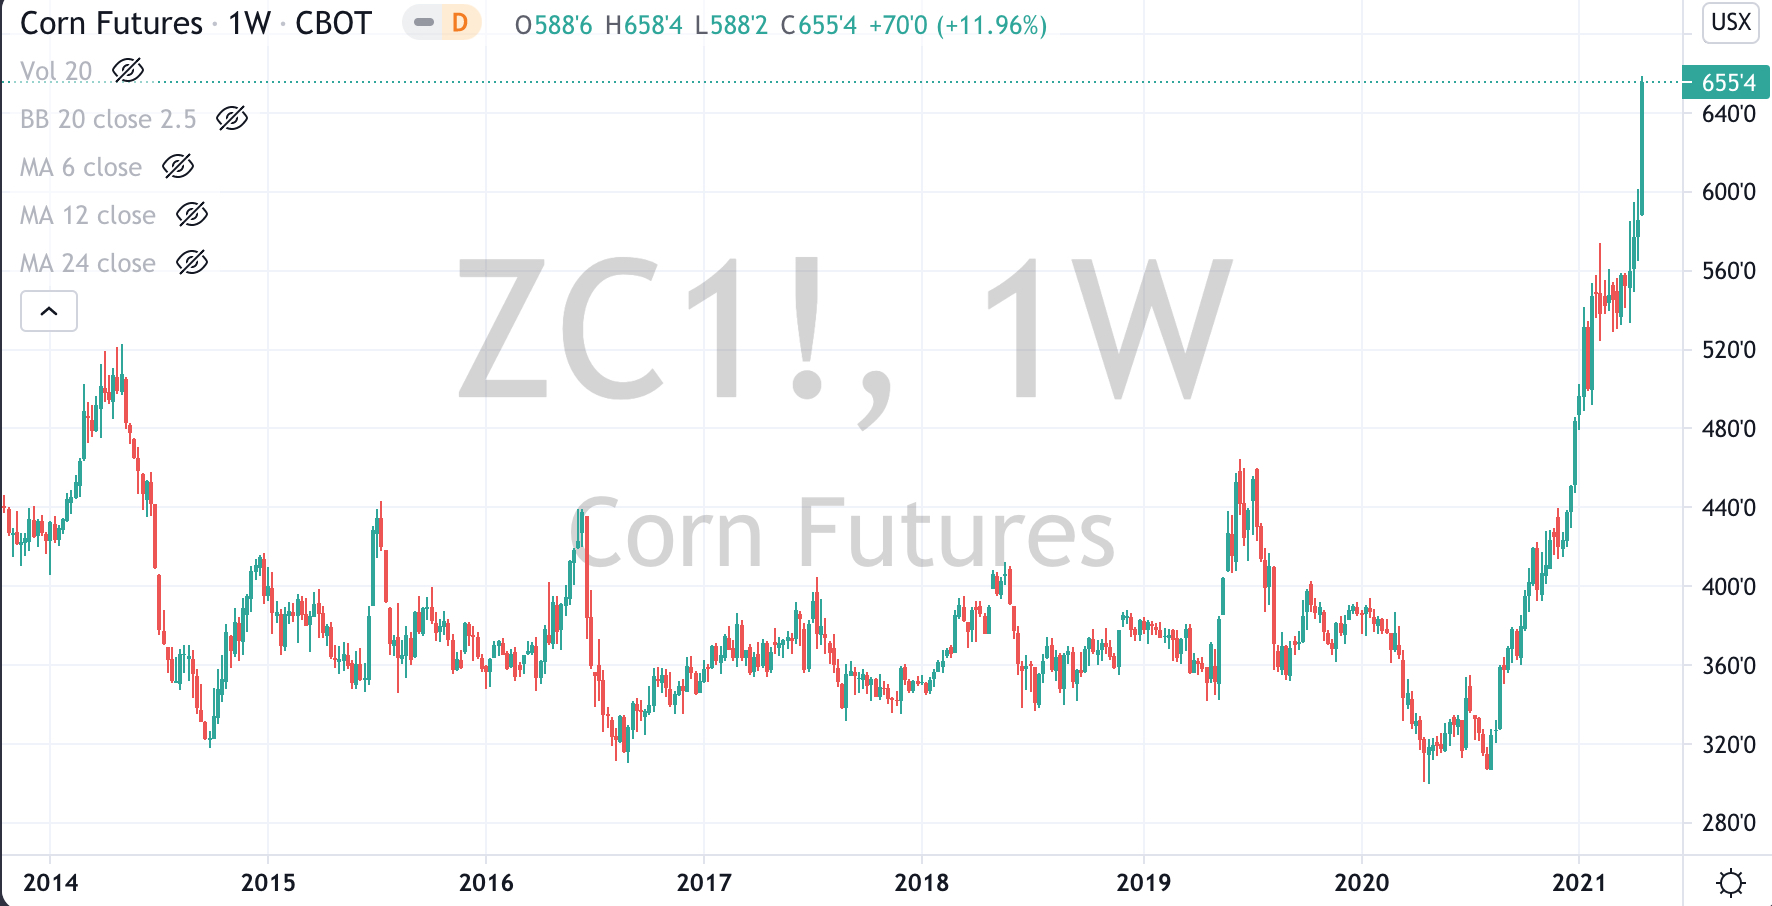
The arrows in the 30 year chart below (plotted on a monthly basis) shows Corn’s various moments when it has traded 3 standard deviations above its mean.
Such extremes are more interesting and mean reversion is more relevant when a commodity is seasonal and replenishes.
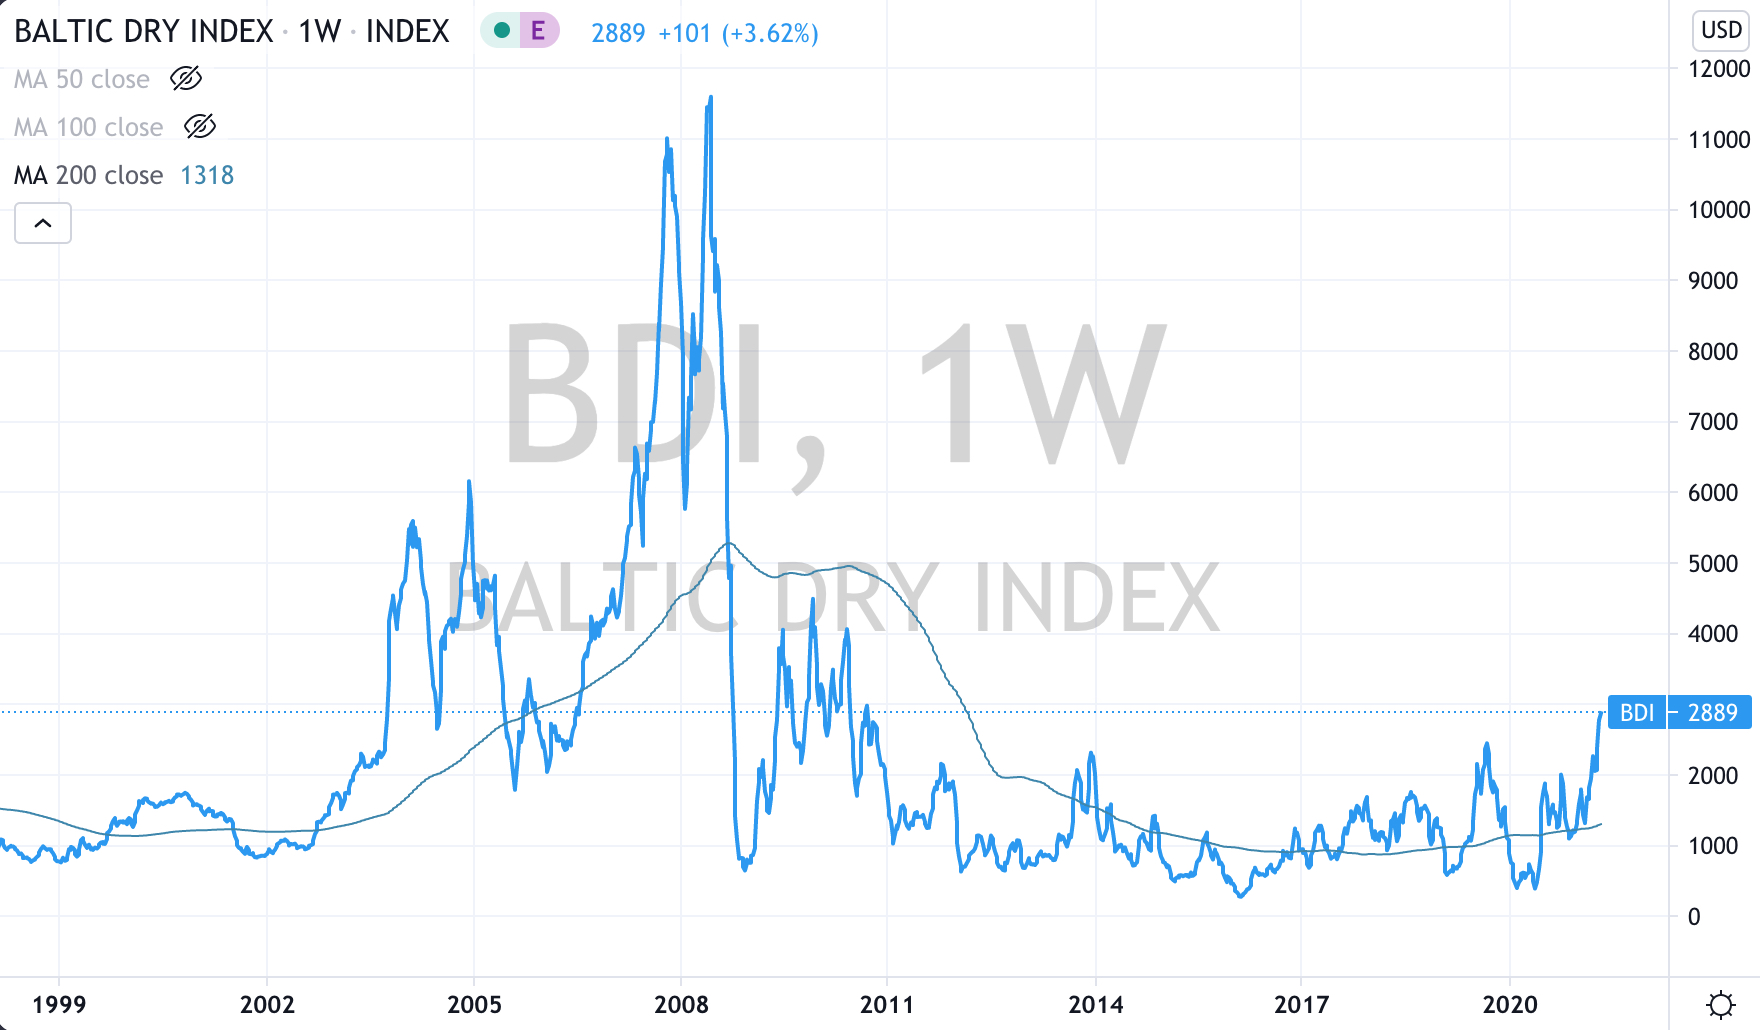
The daily cost of chartering a large ship has risen 6-fold over the past 12 months.
I wanted to highlight the quantum of the rise instead of the absolute price. This increase is surely contributing to the rise in global producer price indexes.
Over the same time, the price of Coal, Iron Ore, Corn, Soybeans & Wheat have also doubled. These commodities account for approx. 65% of the global dry bulk trade. Steel products, sugars and cement account for the other third.
While many will compare where the Baltic Dry Index has been historically, but for now it is Overbought and trading at an ‘extreme’ high on my various measures.
For now, I’ll ponder how the rising shipping costs will work themselves into the goods being currently delivered and if buyers are willing pay for the higher prices being passed on?
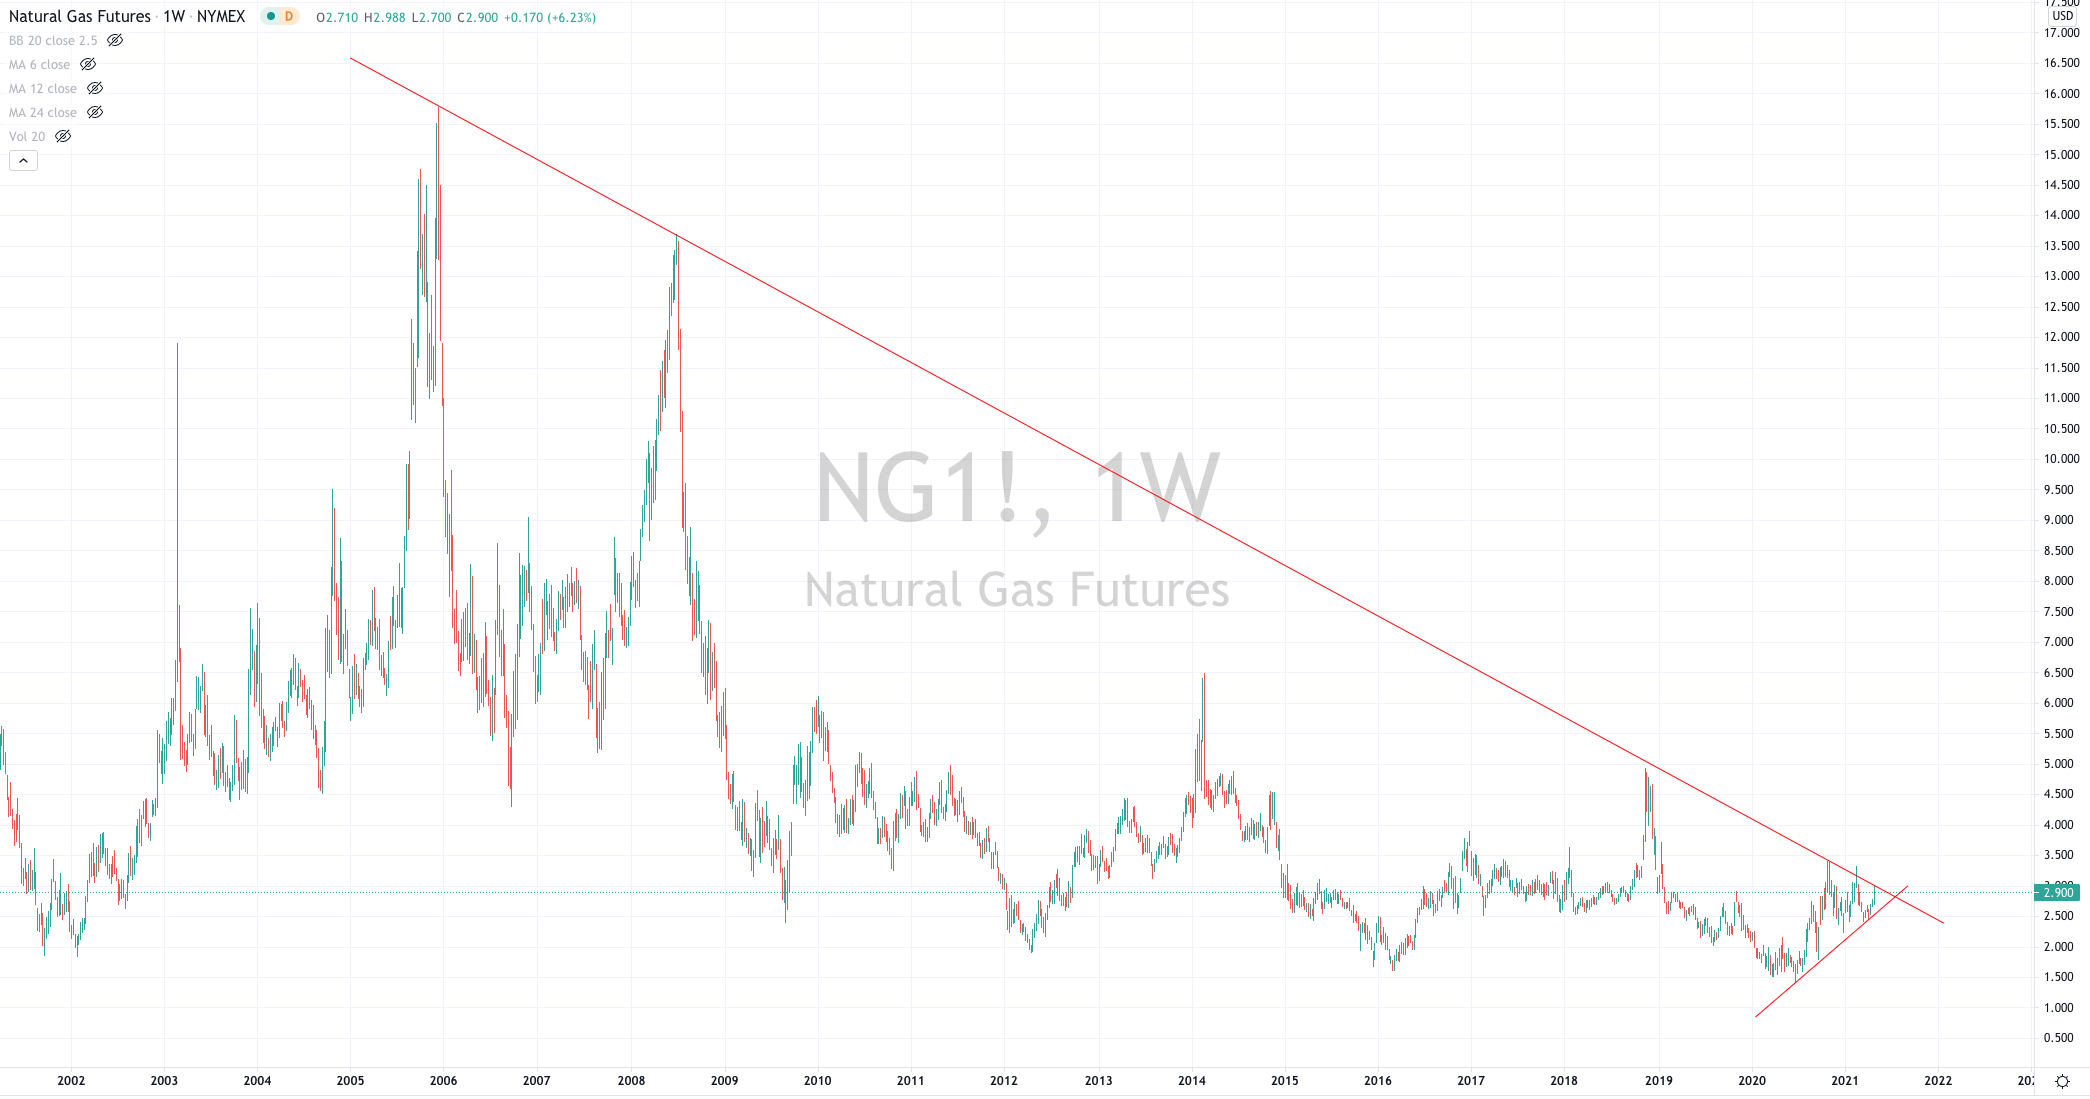
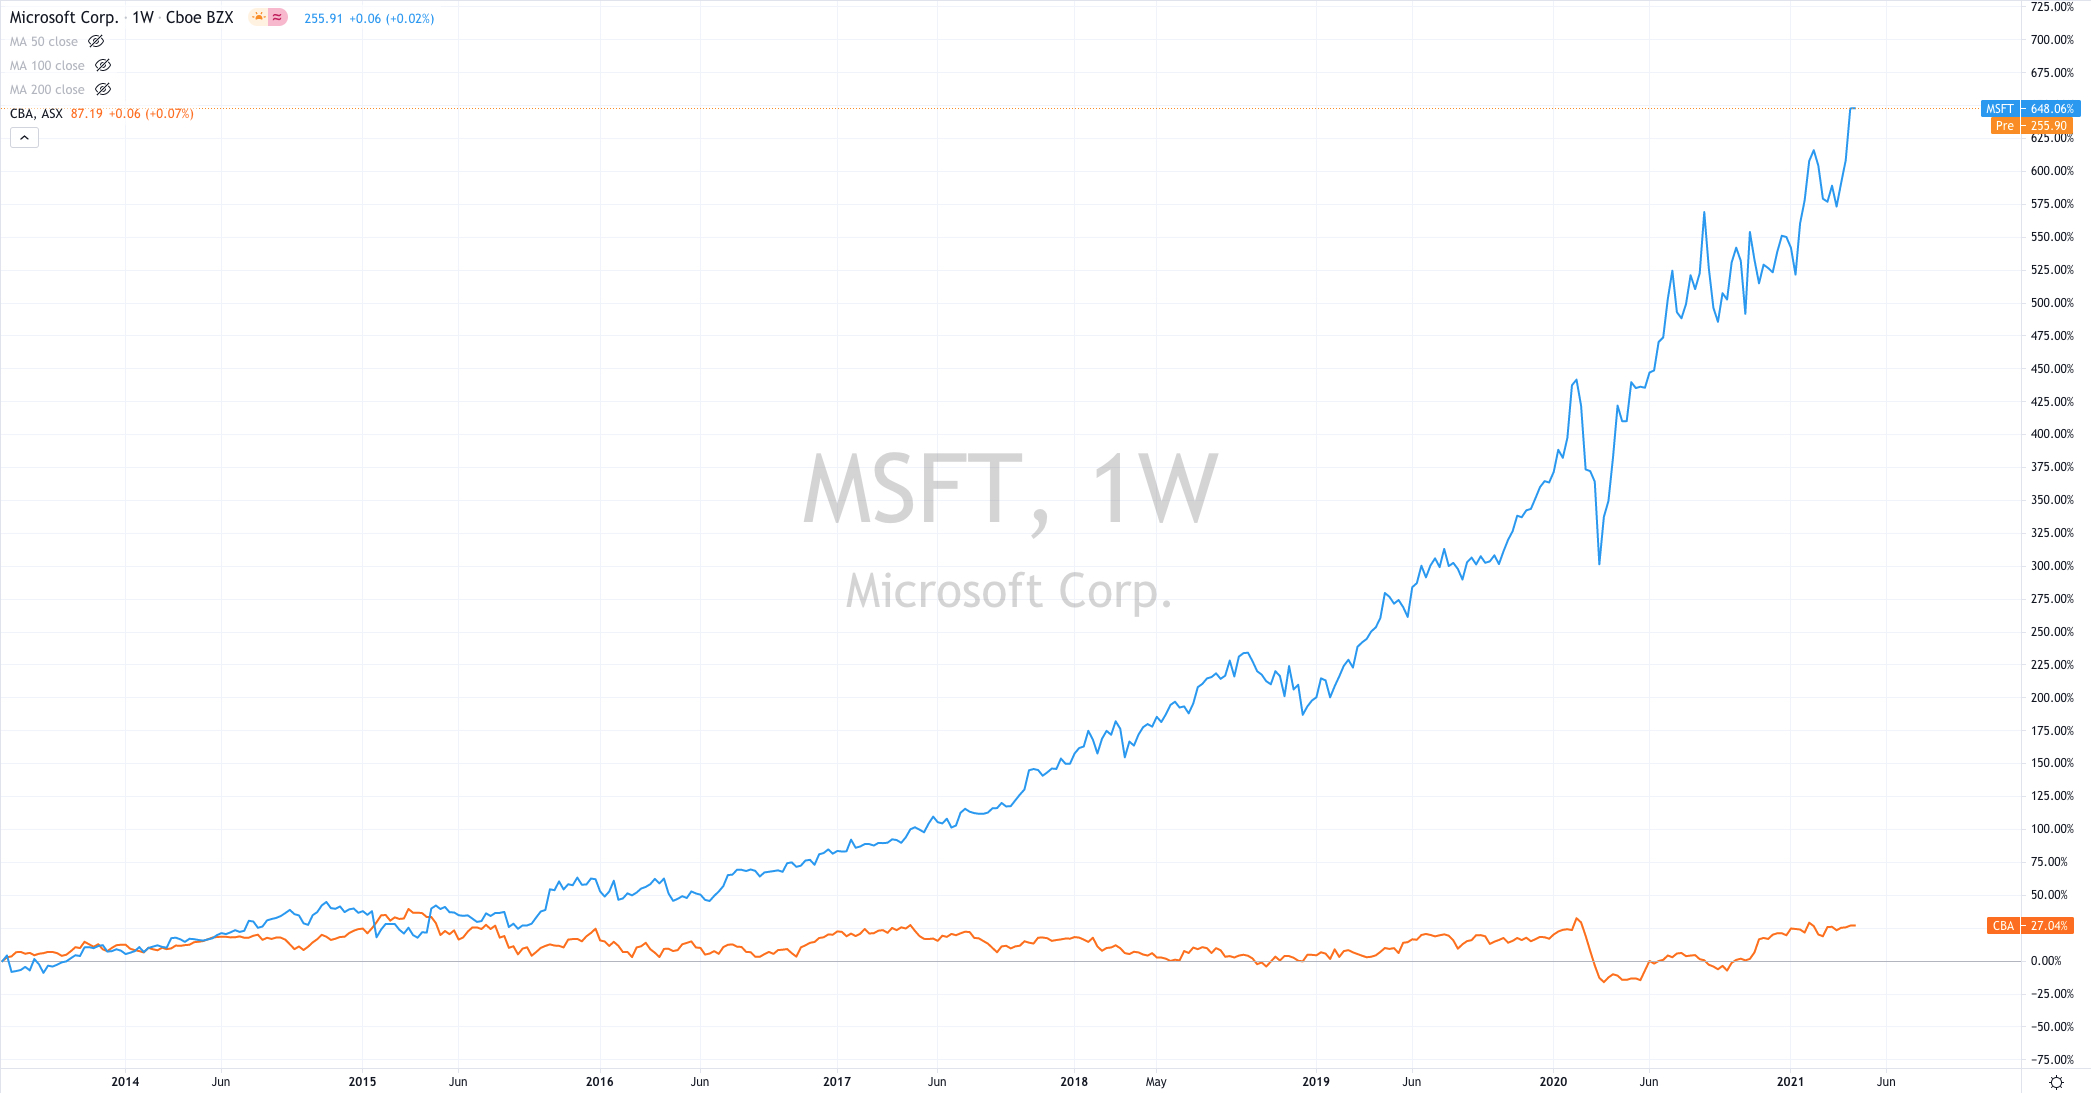
I am seeing similar chart patterns mimicked in many global Oil & Gas equities.
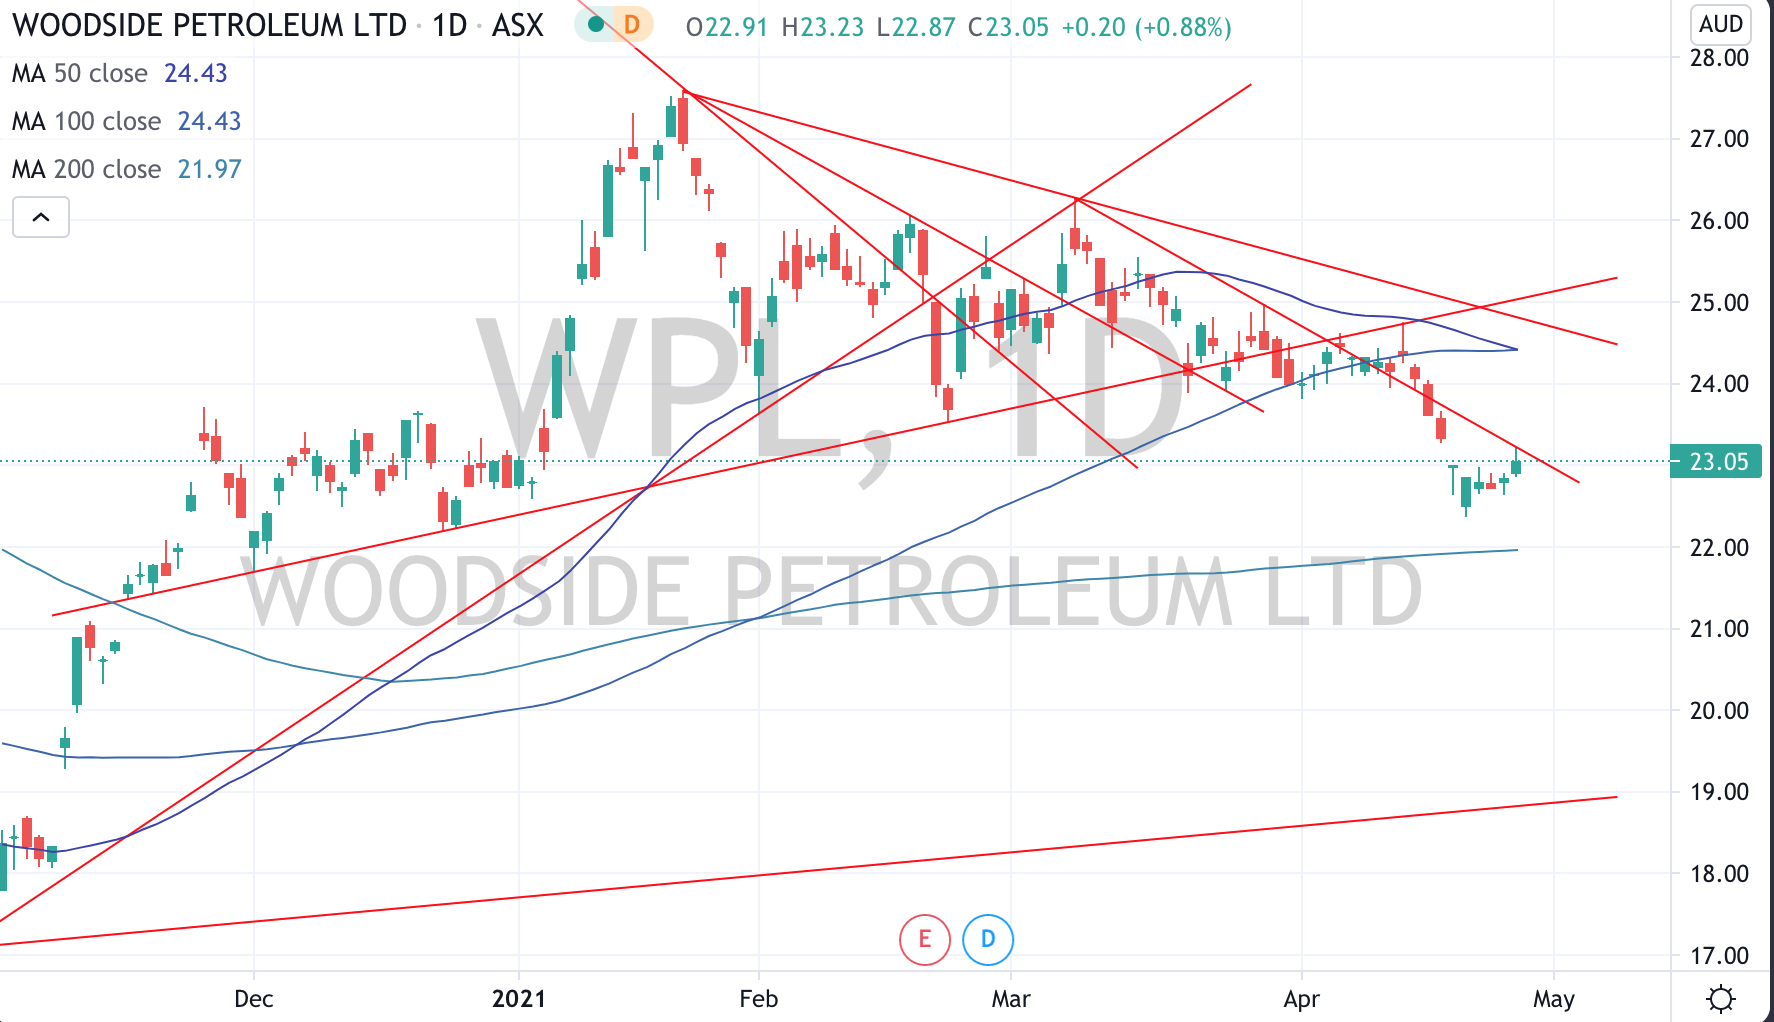
Below is some commentary around Woodside Energy’s (WPL.AX) price action.
WPL’s failure to hold $24 wasn’t good although holding a $22.30 support deemed to be important. Today, the stock is challenging a downward sloping resistance line and needs to break and close above $23.35 in order to increase probability of a visit back to $24 and above. Failing to break $23.35 means the 50 day moving average crosses below its 100 day moving average and likely heralds in a new short term bear trend with a break below $22 suggests a visit to $19.
This all coincides with the acute point where Brent Crude is trading. Brent is edging towards a new bullish move and needs to trade above $67.50 to add to this case however a break below $64.50 negates such a move.
The following assets (on a weekly timeframe) registered an Overbought reading or traded more than 2.5 standard deviations above its rolling mean.
Extremes “above” the Mean (at least 2.5 standard deviations)
Coffee
Wheat
Ripple (XRP)
ASX 200 Index
Overbought (RSI > 70)
Canadian 10 year bond yields (for 10th consecutive weeks)
The Commodities Indices (the CRB and Bloomberg’s)
Iron Ore (2 consecutive weeks)
Aluminium (for 9th consecutive weeks)
Copper (for 19th consecutive weeks)
Lean Hogs (for the 10th consecutive week and its highest price since September 2014)
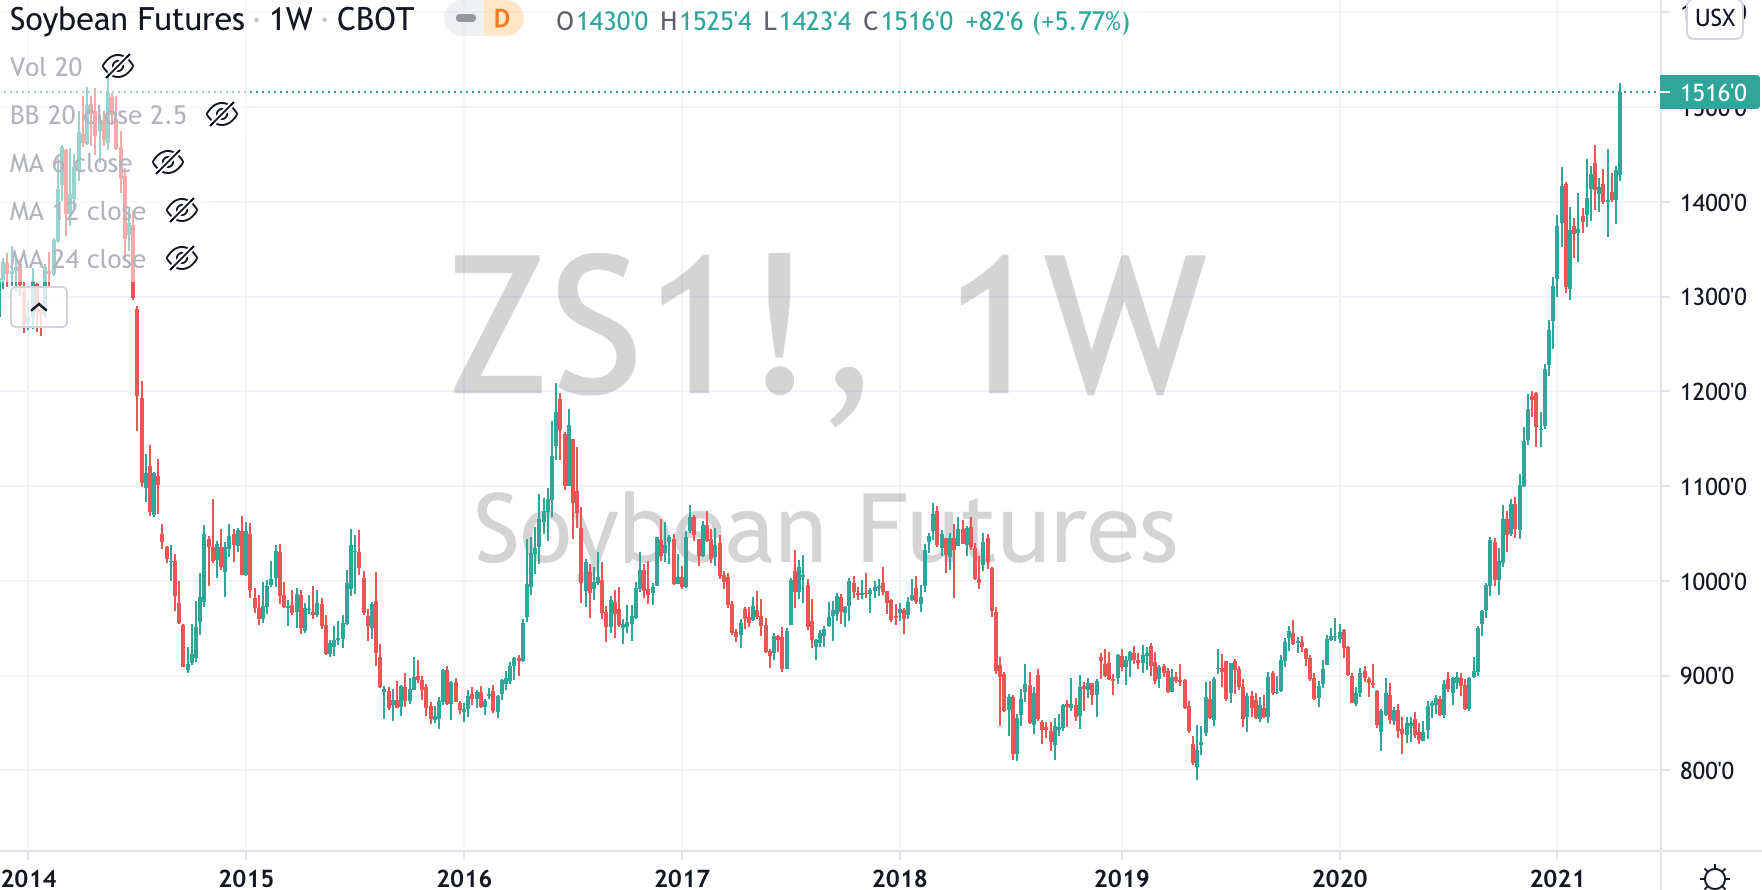
Soybeans (for the 7th consecutive week)
S&P 500 Index (for the 3rd consecutive week)
Dow Jones Industrial Average (for the 3rd consecutive week)
S&P Mid Cap 400 (7th consecutive week)
U.S. KBW Banking Index (8th consecutive week)
Nasdaq Transportation Index (7th consecutive week)
Dow Jones Transport Index (7th consecutive week)
Sweden’s OMX 30 Index (7th consecutive week)
South Korea’s KOSPI Index
Ethereum
The Quinella – Both Overbought and Traded at > 2.5 standard deviations above the weekly mean)
Corn (for the 20th consecutive week & trading 70% above its 200 Week Moving Average)
Lumber (having risen 31% in past 3 weeks)
Cryptocurrency Dogecoin
Assets (securities) within my immediate universe which touched the other side of the extreme, being Oversold (where the RSI is < 30) or were at least 2.5 standard deviations below its mean are;
Extremes “below” the Mean (at least 2.5 standard deviations)
Nil
Oversold (RSI < 30)
Nil
Notes & Ideas:
The list of ‘Over Bought’ extremes is shrinking as many of those extremes have eased off their highs and some are on their way to reverting back to their mean.
The most obvious trend amongst the rising price brigade are commodities from the ‘softs’ agricultural complex such Corn, Soybeans, Wheat, Coffee. Many advancing more than 5% for the week and exhibiting parabolic moves.
Once again, no currencies are Overbought this week. All those listed as ‘extremely’ overbought in the past few weeks have corrected and have since traded 2-3% lower.
Equally, extreme ‘high’s in global government bond have seen yields decline.
Overbought cryptocurrencies have eased lower from last week’s highs as have European equity indices……..
while the Dow Jones Industrials, the S&P 500 and the Mid-Cap 400 continue to register Overbought readings.
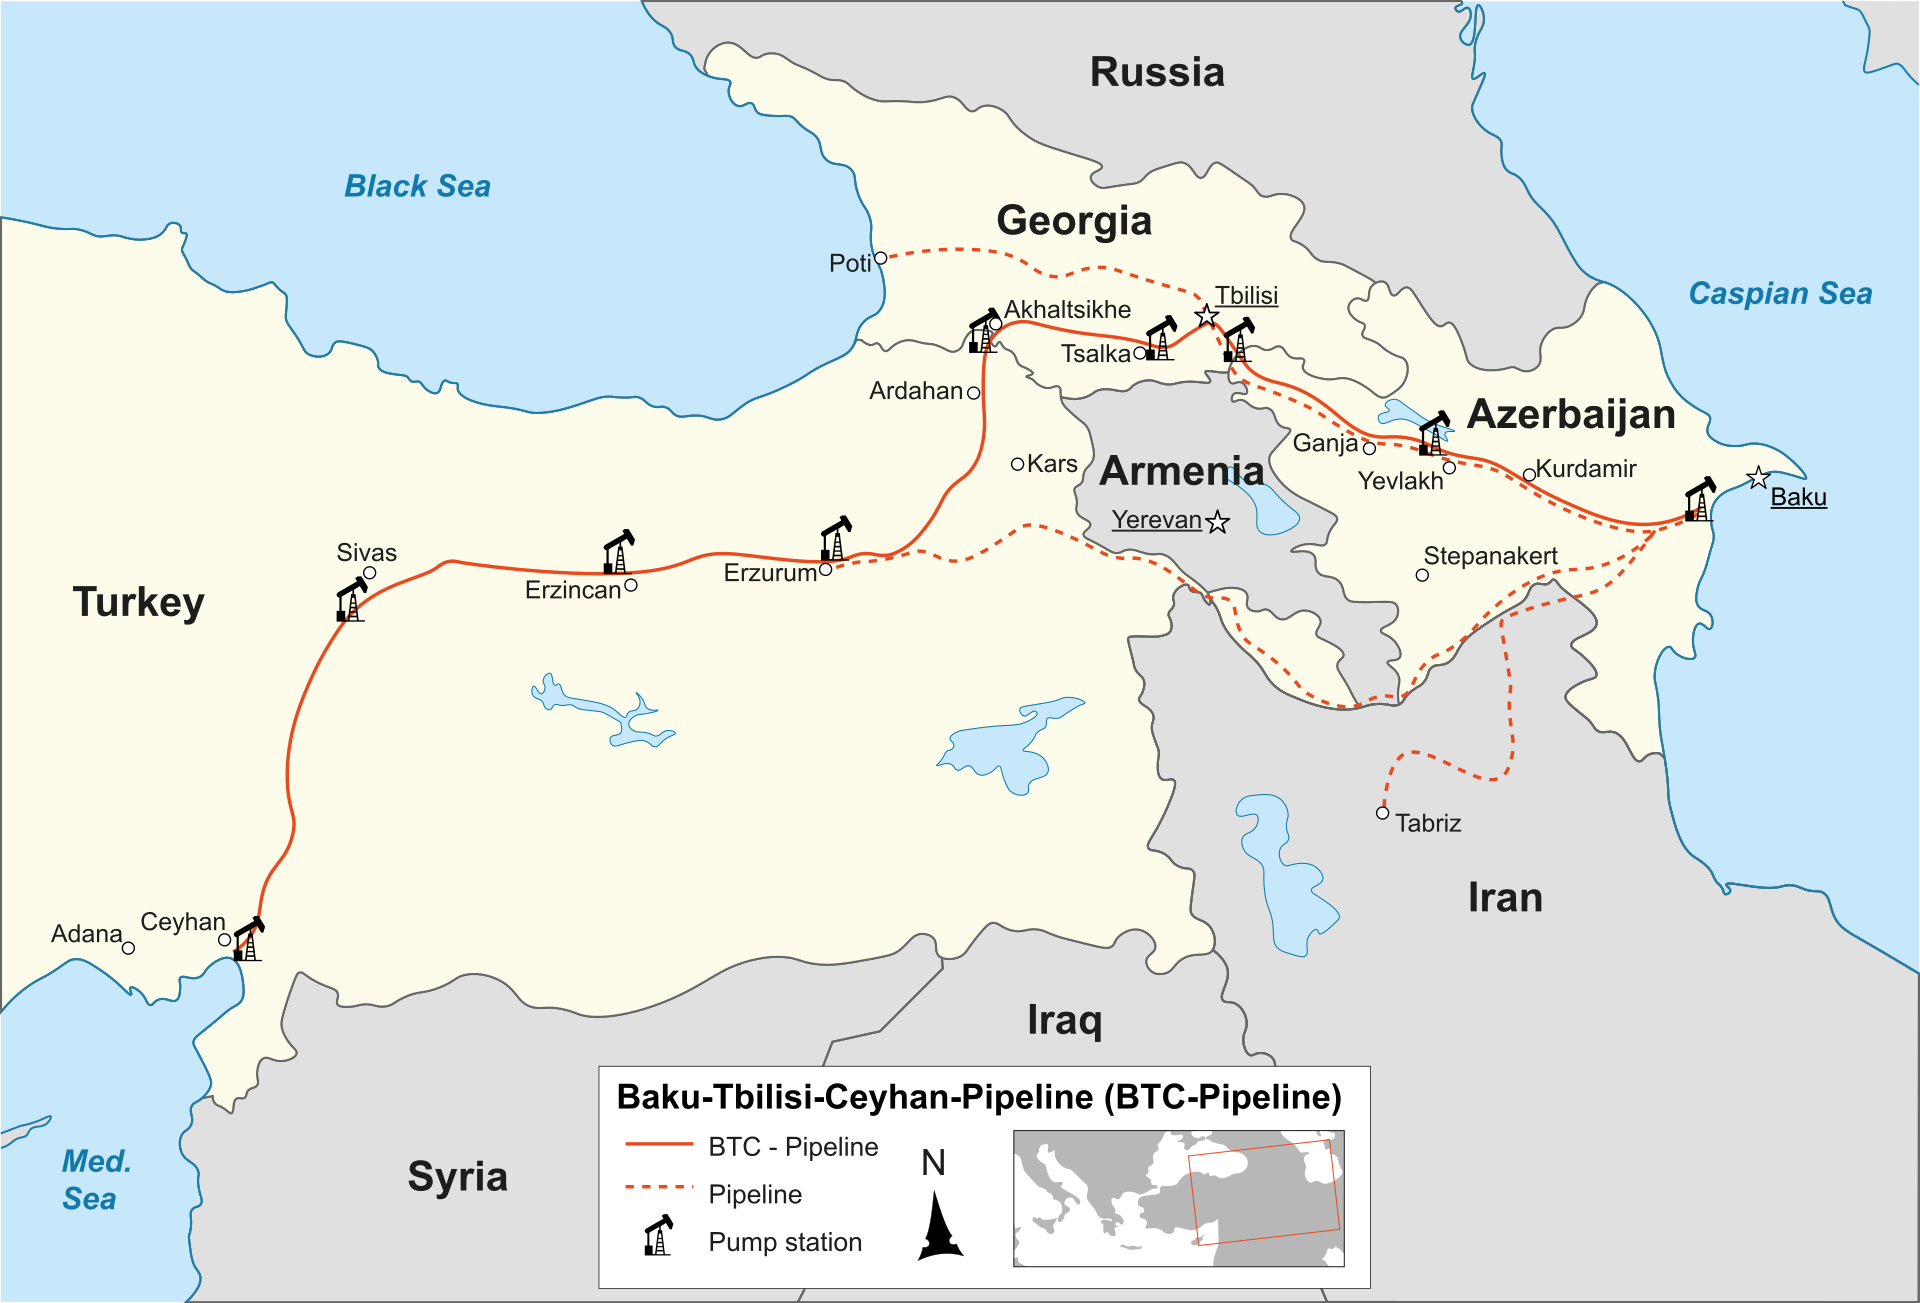
The geopolitical topic which I find most fascinating today involves Turkey.
A confluence of events, it political positioning and its strategic assets and alliances are worth noting.
President Erdogan fires the ‘central bank’;
President Biden labels Turkish actions in Armenia 1915 (a Christian country) as ‘genocide’;
Armenia remains a NATO ally yet has a Russian military base within it;
Turkey is friends with Russia (it likes its TurkStream pipeline);
Turkey and Russia have good economic relations;
Biden is pondering sanctions against Germany to hinder Russia’s Nord Stream 2 pipeline;
other assets such as the Baku–Tbilisi–Ceyhan pipeline conveniently bypass’ Armenia;
Turkey’s ejection from the F-35 Joint Strike Fighter program places pressure (spare parts) on maintaining their F-16 jets (the world’s 3rd largest fleet of that type);
Turkey and Pakistan relations are good and those with Iran are strong;
overnight Turkey launches new raids against militant Kurds in Northern Iraq;
while Turkey proceeds to build an alternative shipping route (the Istanbul Canal) to the Bosphorus,