Coming next: The great Corn unwind
May 6, 2021 Leave a comment
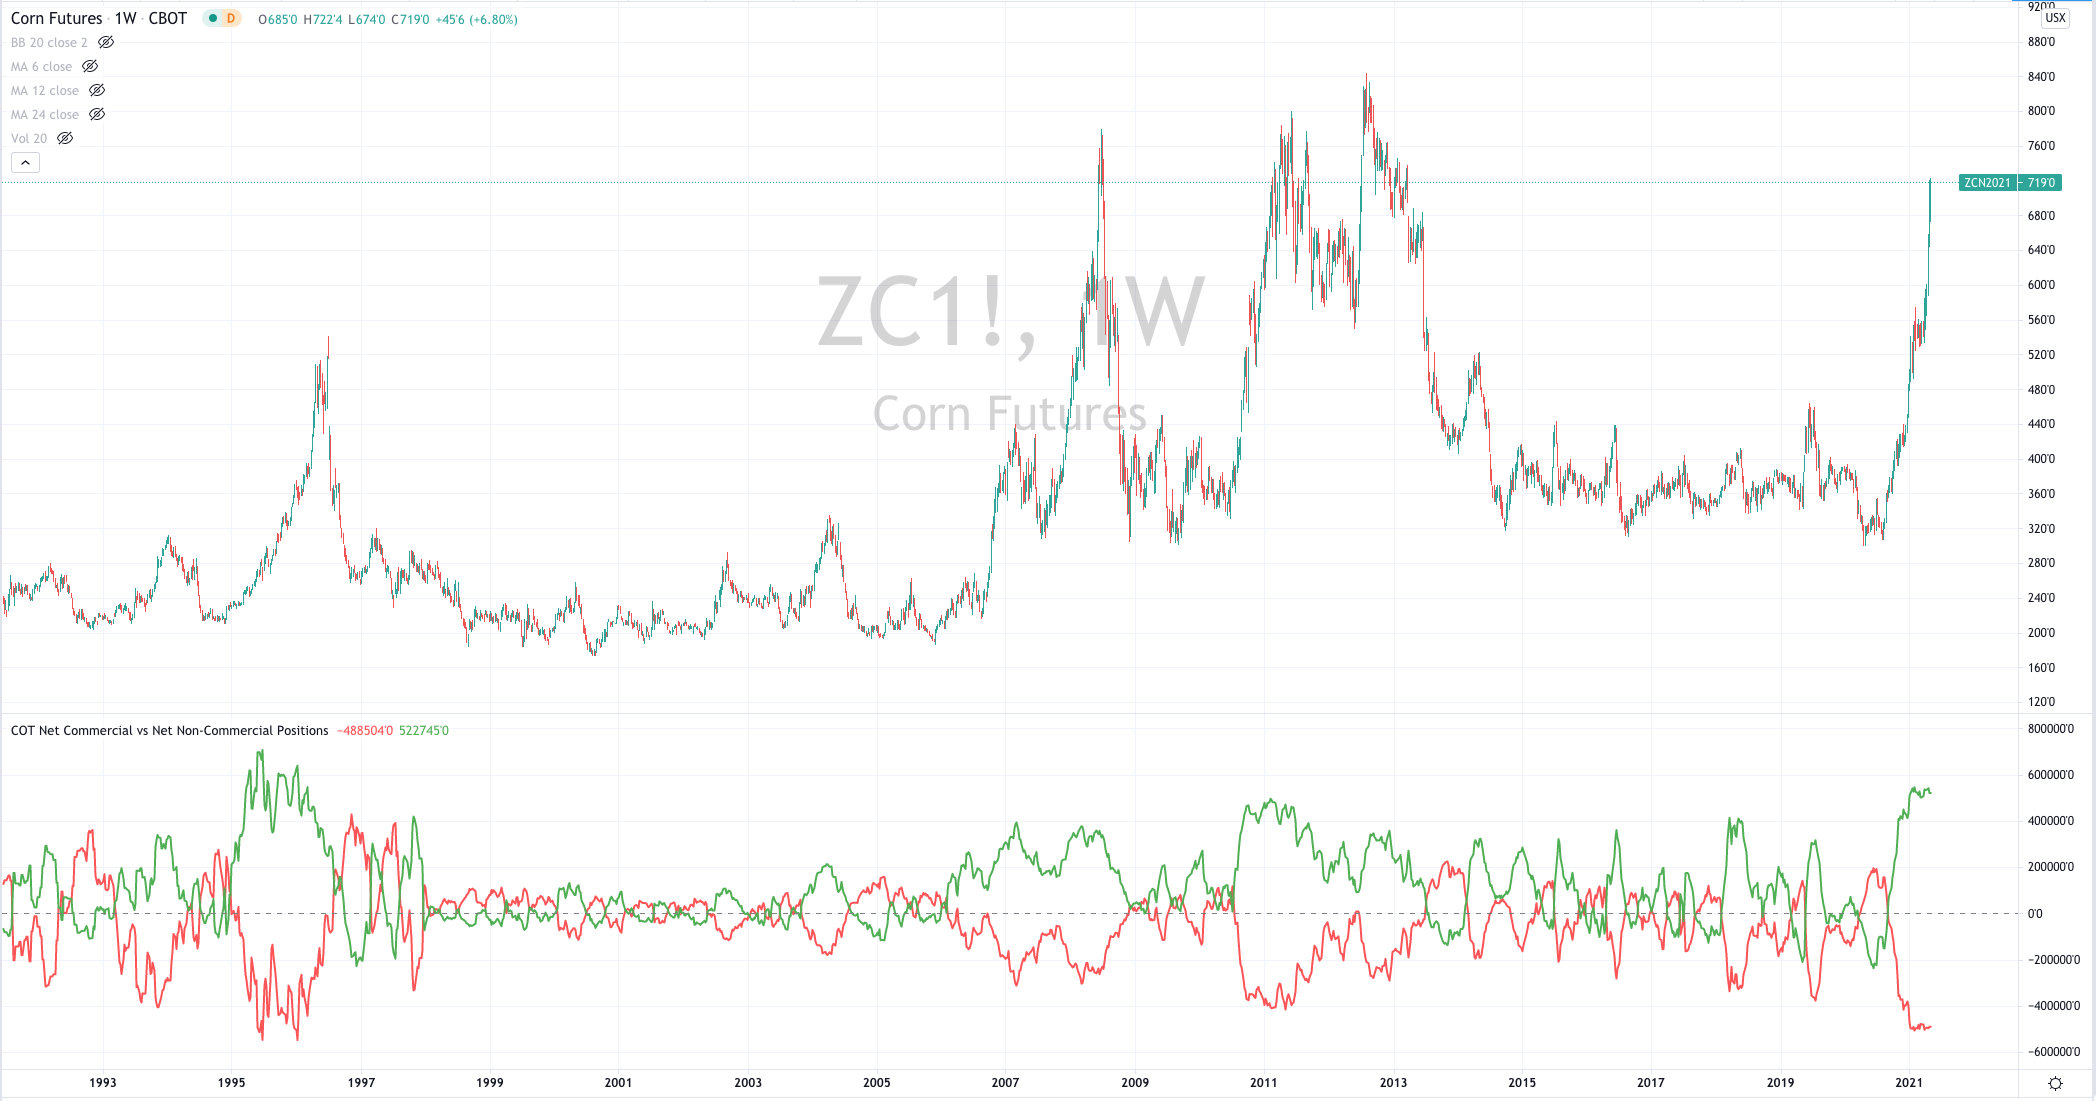
The green line in lower chart tells us that number of ‘long’ positions held by financial speculators in Corn futures is at its highest since 1996.
Watch the correlation when the green line is barreling towards above than average heights and that of the highs being seen in the corn price…..and then see what happens to the corn price when the ‘great unwind’ occurs.
Incidentally, the red line in the lower chart show that producers (growers) are immensely net short. Meaning they are taking these forward prices as future payment. Of course they should.
If you a commercial participant in the corn market, it’ll be wise to wait a little longer before buying your corn. History and logic tells me you’ll get lower prices.
And today, Bloomberg have published this story;
May 6, 2021
by Rob Zdravevski
rob@karriasset.com.au