Watch out for the rip

It’s Friday, which means the Thursday (U.S. time) edition of the American Association of Individual Investors (AAII) Survey has been released.

History of survey results link here

https://www.aaii.com/sentimentsurvey/sent_results

and the respondents are more bearish than last week’s result.

and the bullish/bearish spread is negative at (1.5%).

It’s the highest bearish reading since Nov 2, 2023, when the bullish/bearish spread was also negative.

The most recent moment that the bullish/bearish spread was negative was in the April 25, 2024 release.

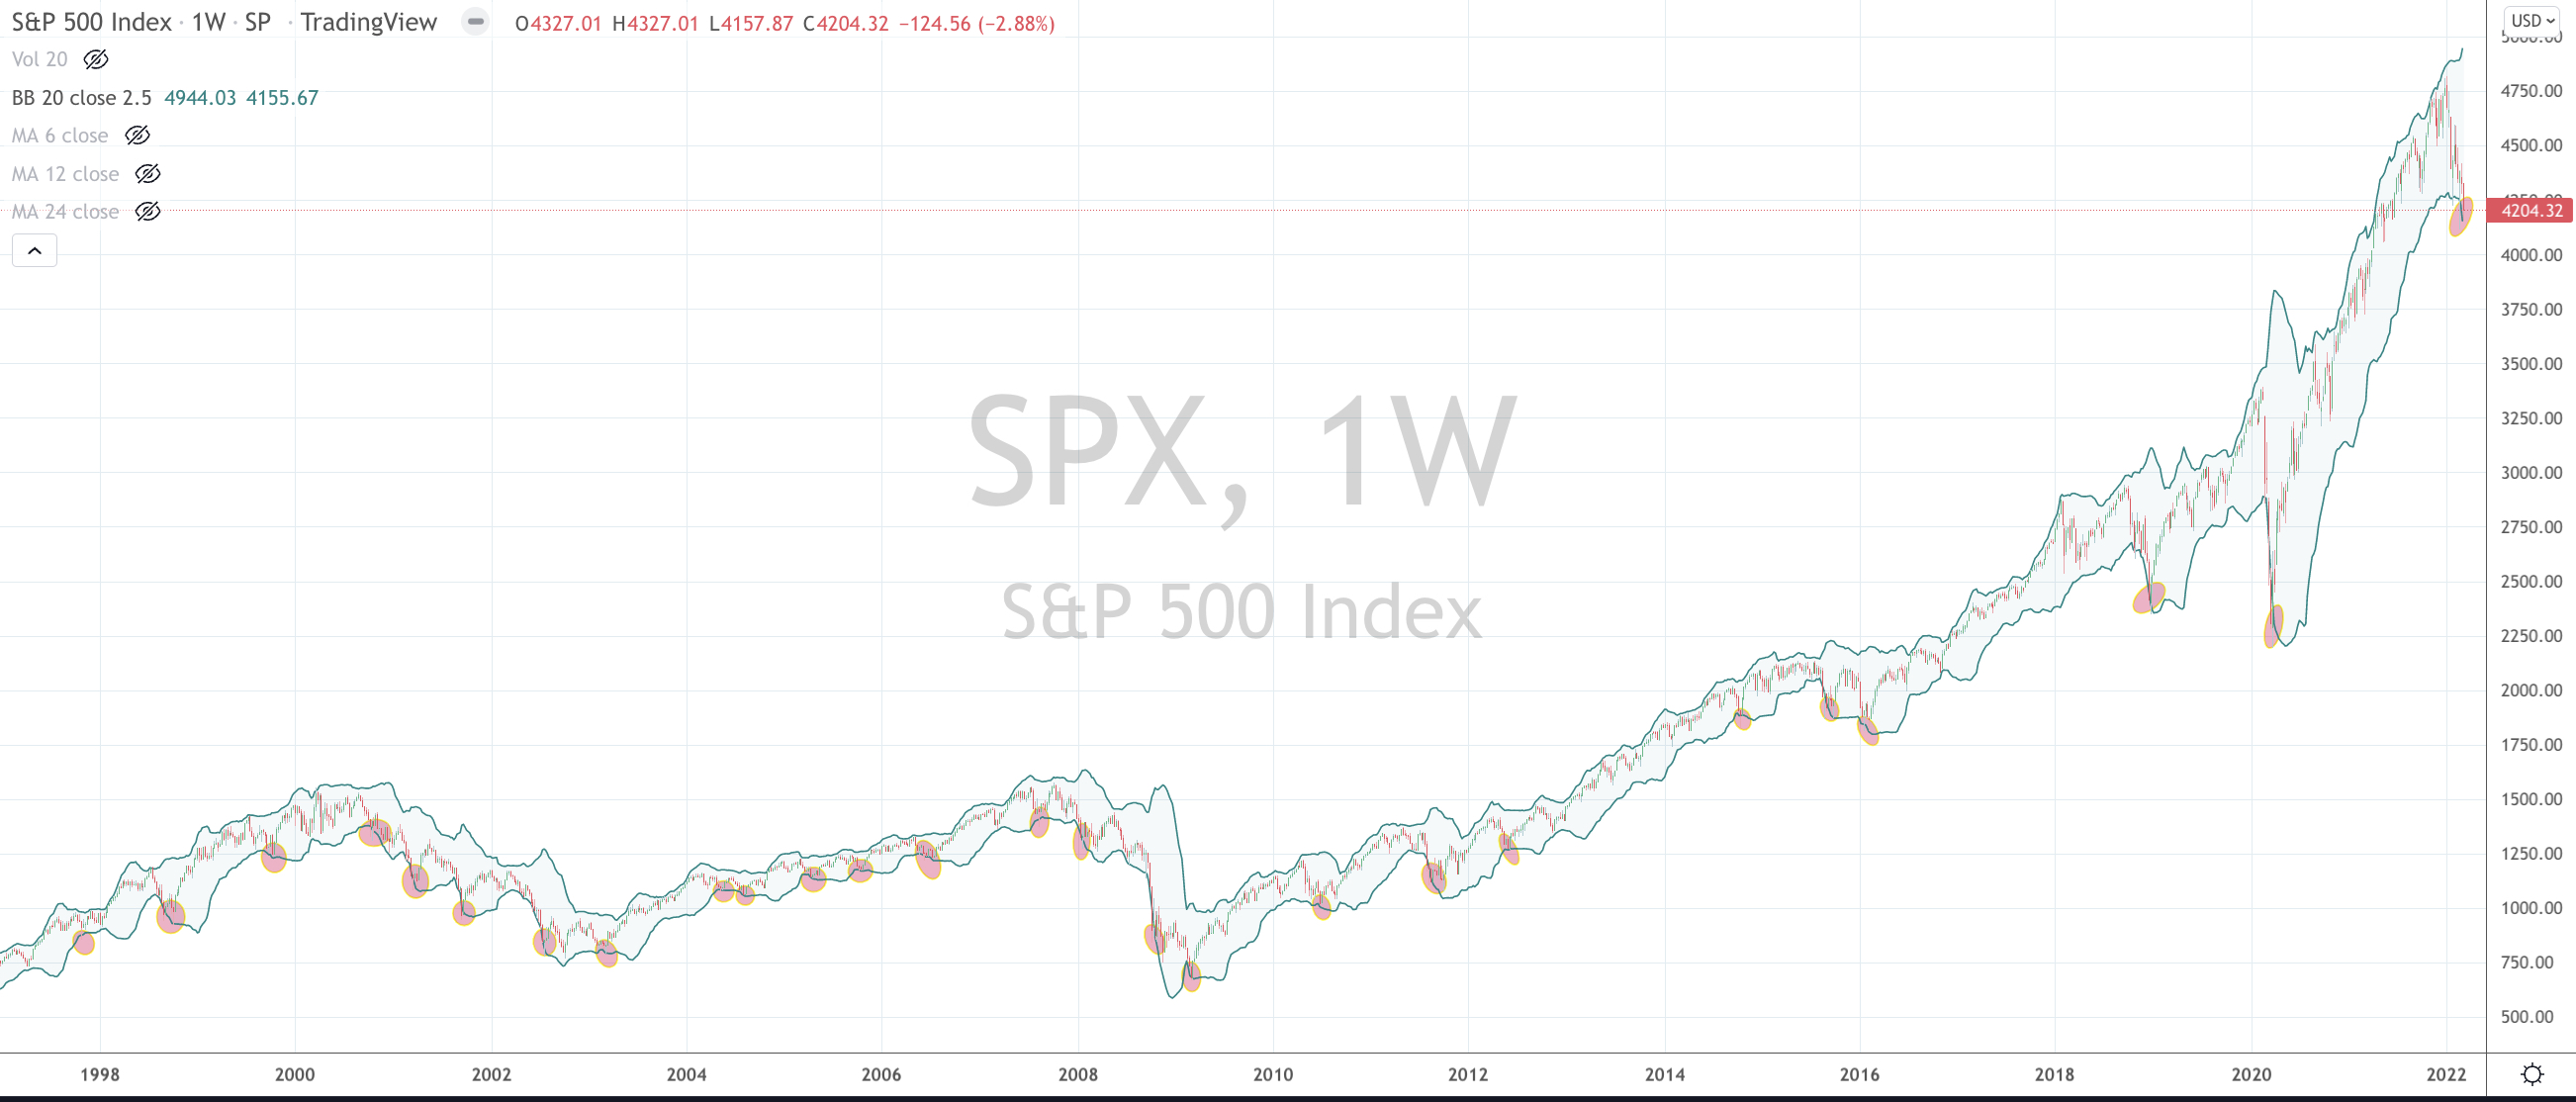
I have highlighted those 2 moments in the attached S&P 500 price chart.

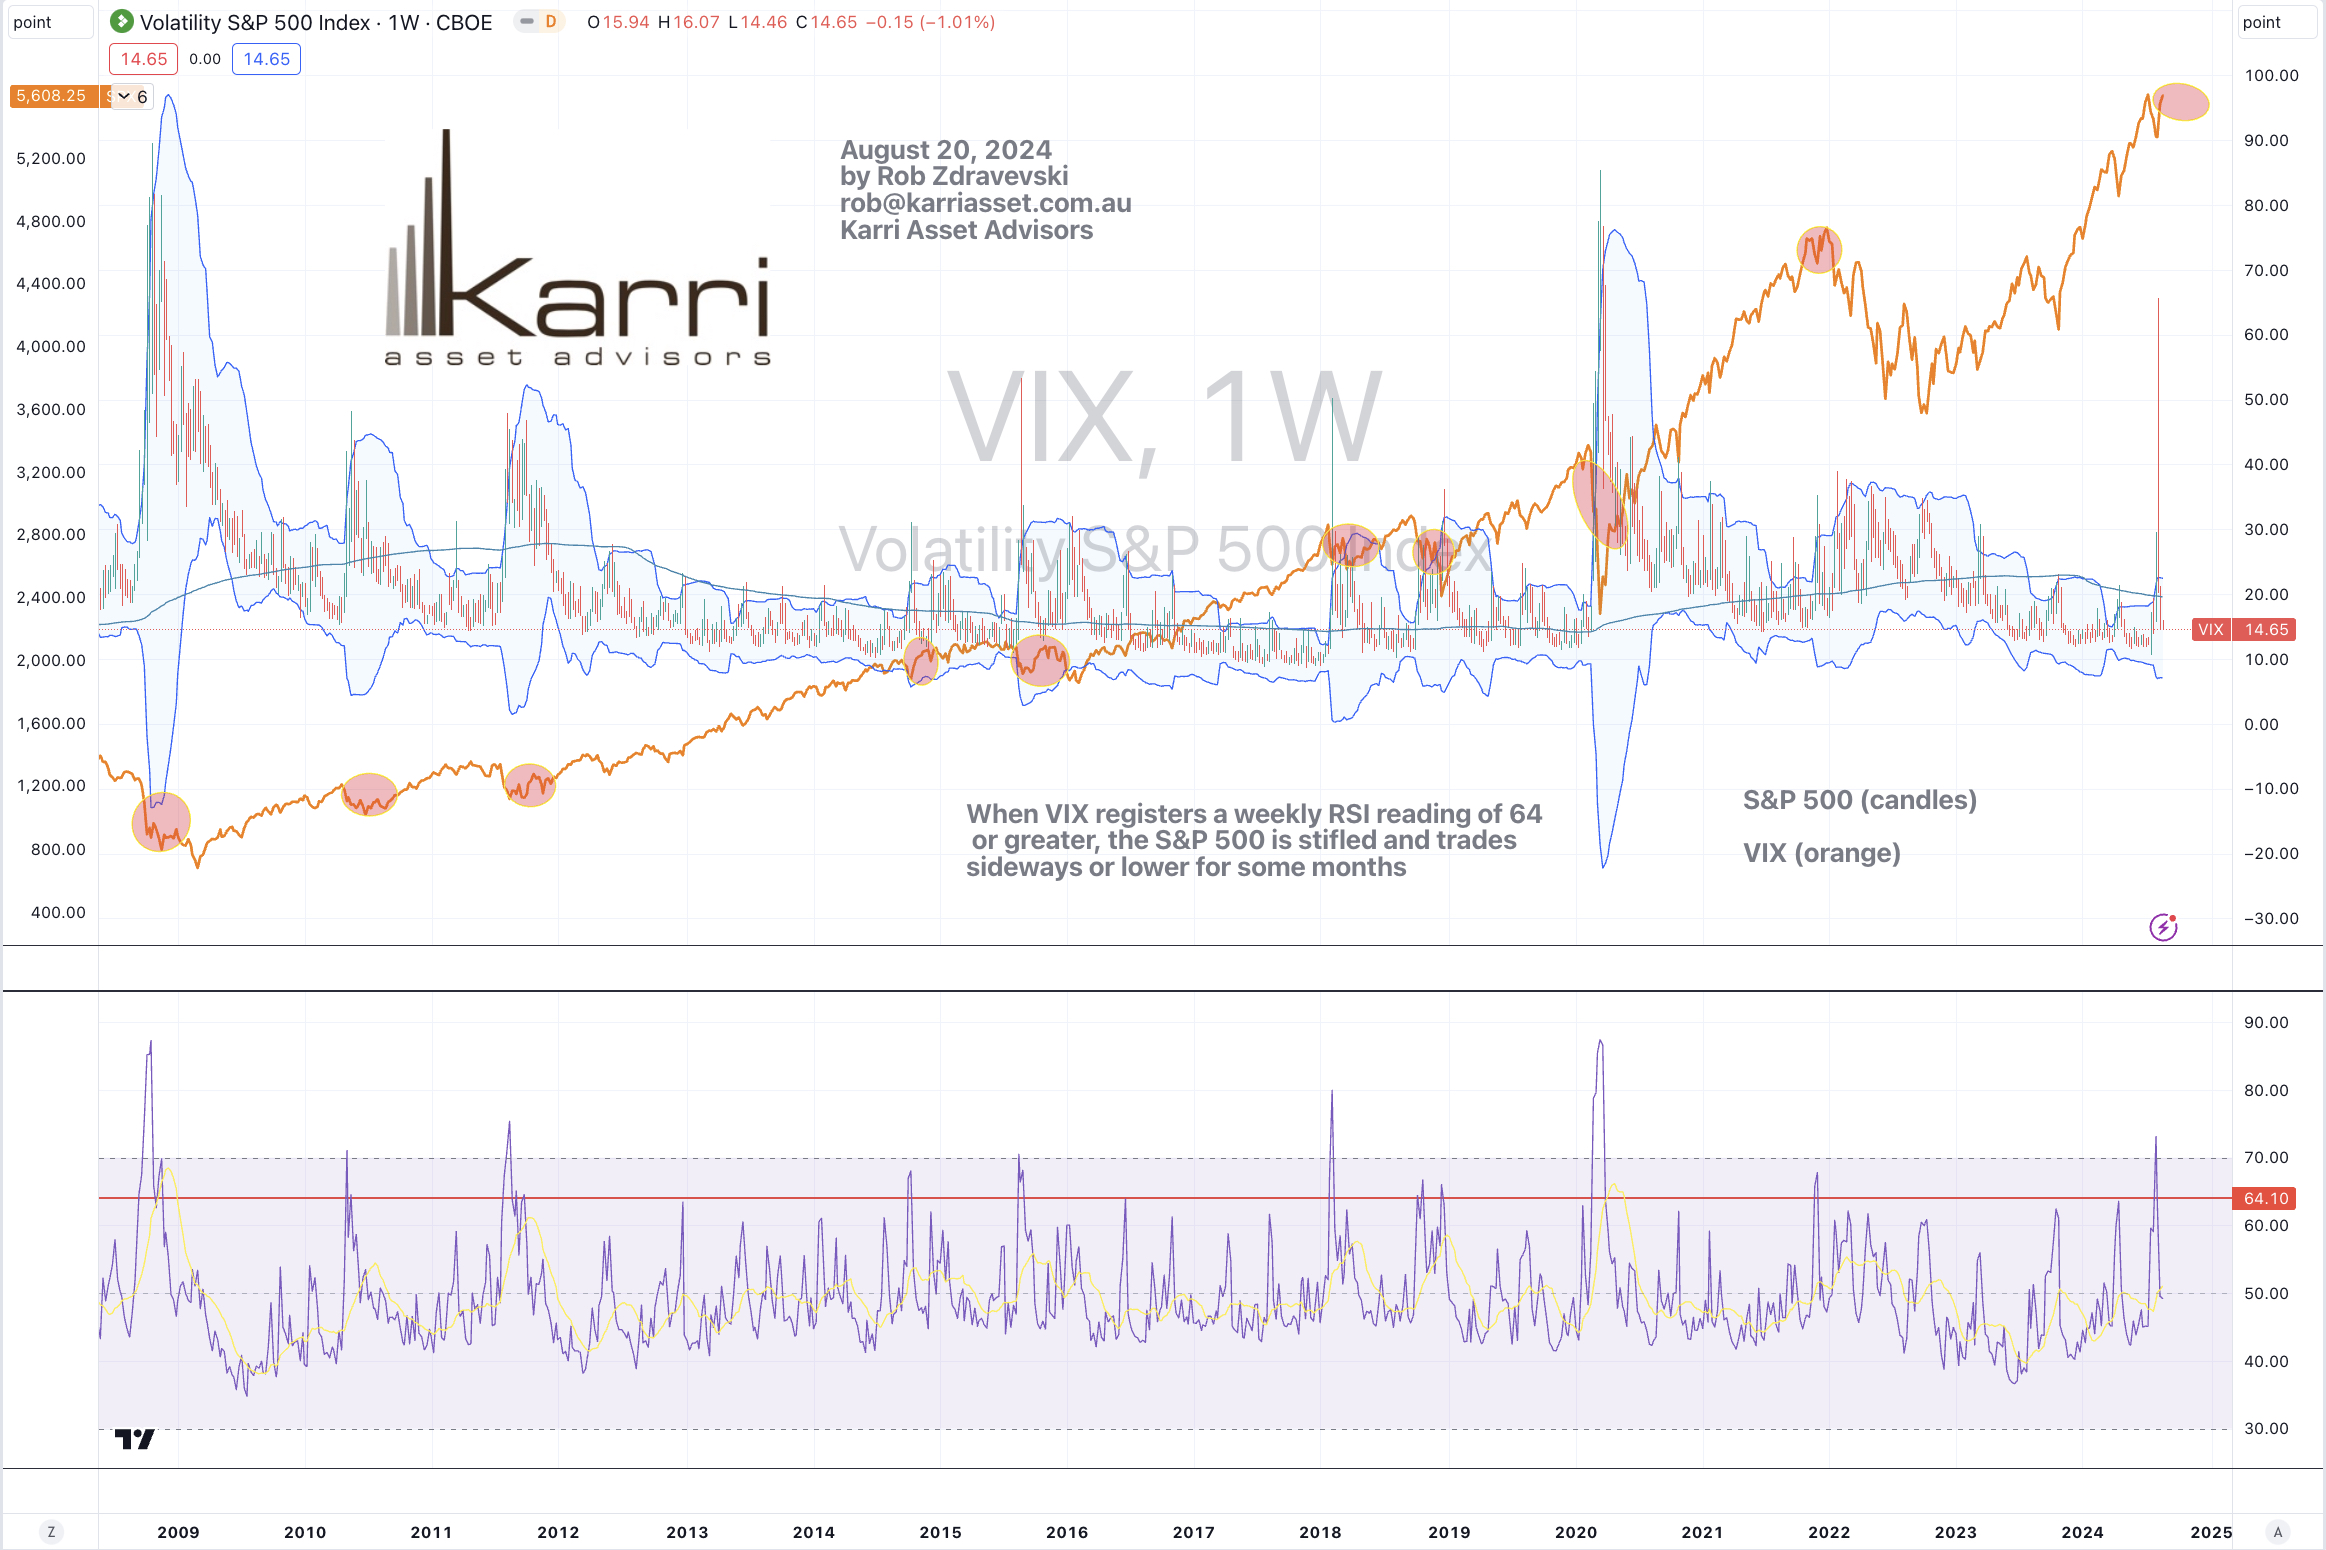
This is in keeping with my other commentary that while we are late in this particular equity ‘party’ and the VIX is subdued, it looks like equities will ‘rip’ higher.

Like any place where waves are prevalent, you need to watch out for the rips.

November 29, 2024

rob@karriasset.com.au

Screenshot
Screenshot

Low Bitcoin Volatility stifles equities

This study overlays Bitcoin volatility against the S&P 500 Index.

It is saying to me that when Bitcoin volatility is overbought, buy equities

And when #Bitcoin #Volatility (BVOL) is registering an RSI reading below 38, then it seems that equities are stifled, perhaps signalling a peak.

BVOL traded below 38 last week.

November 5, 2024

by Rob Zdravevski

Karri Asset Advisors

rob@karriasset.com.au

Screenshot

S&P 500 advance to dissipate

The S&P 500’s climb up the wall of worry is over.

My story link mentions the advance ends when the VIX registers a weekly reading of 64 or greater.

It did that last week.

The study below circles the S&P 500 when that weekly VIX vol64 occurs. It then trades sideways to lower, for many following months.

Not to worry, the ‘market’ will change its shape and weight will be re-distributed.

August 20, 2024

by Rob Zdravevski

rob@karriasset.com.au

Screenshot

It’s ‘risk on’ again, baby !

Last week’s palaver about unwinding Yen trades is old news.

The Yen has nearly swung to the other side of the pendulum.

The study below shows the 13 moments over the past 15 years when the AUD/JPY was trading (coinciding with a couple other metrics) at a weekly RSI reading of 36 or below.

I say ‘nearly swung’, for we are close but not there yet……for another such occurrence.

When they do occur, they bode well for listed equities risk appetite.

The Nasdaq 100 index appears within my study as a comparison.

August 12, 2024

by Rob Zdravevski

rob@karriasset.com.au

Screenshot

Japanese bond yields relationship with the S&P 500

My study of how extremes seen in Japanese government 10 year bond yields relate to opportune moments to buy or sell the S&P 500.

August 10, 2022
by Rob Zdravevski
rob@karriasset.com.au

Extreme observations in the S&P 500

Here is another one for the asset allocators……the S&P 500 is making its 26th visit down to a 2.5 standard deviation move within the past 35 years.

It’s been a handy long term buying moment.

p.s. Long-Term doesn’t equal 3 weeks.

Long-Term is the type of timeframe involved when you consider buying shares for a new born child and not telling them about it until they are allowed to legally buy alcohol.

Timing the entry points and wading in will be artistic part.

March 13, 2022

by Rob Zdravevski

rob@karriasset.com.au

Bitcoin and S&P 500 may swoon together

As a proxy and correlation for ‘risk-on’ and risk-off’ sentiment, Bitcoin is once again poised at a support level (~$38,000) worth watching.

And more so, as it remains in a medium term downtrend.

Failing to hold this near term support, Bitcoin should visit the $29,700 (+/- $250) area.

Such a 24% decline should coincide with my previous writings about a 20% decline in the S&P 500.

March 11, 2022
by Rob Zdravevski
rob@karriasset.com.au

The Copper/Gold Ratio says markets move higher

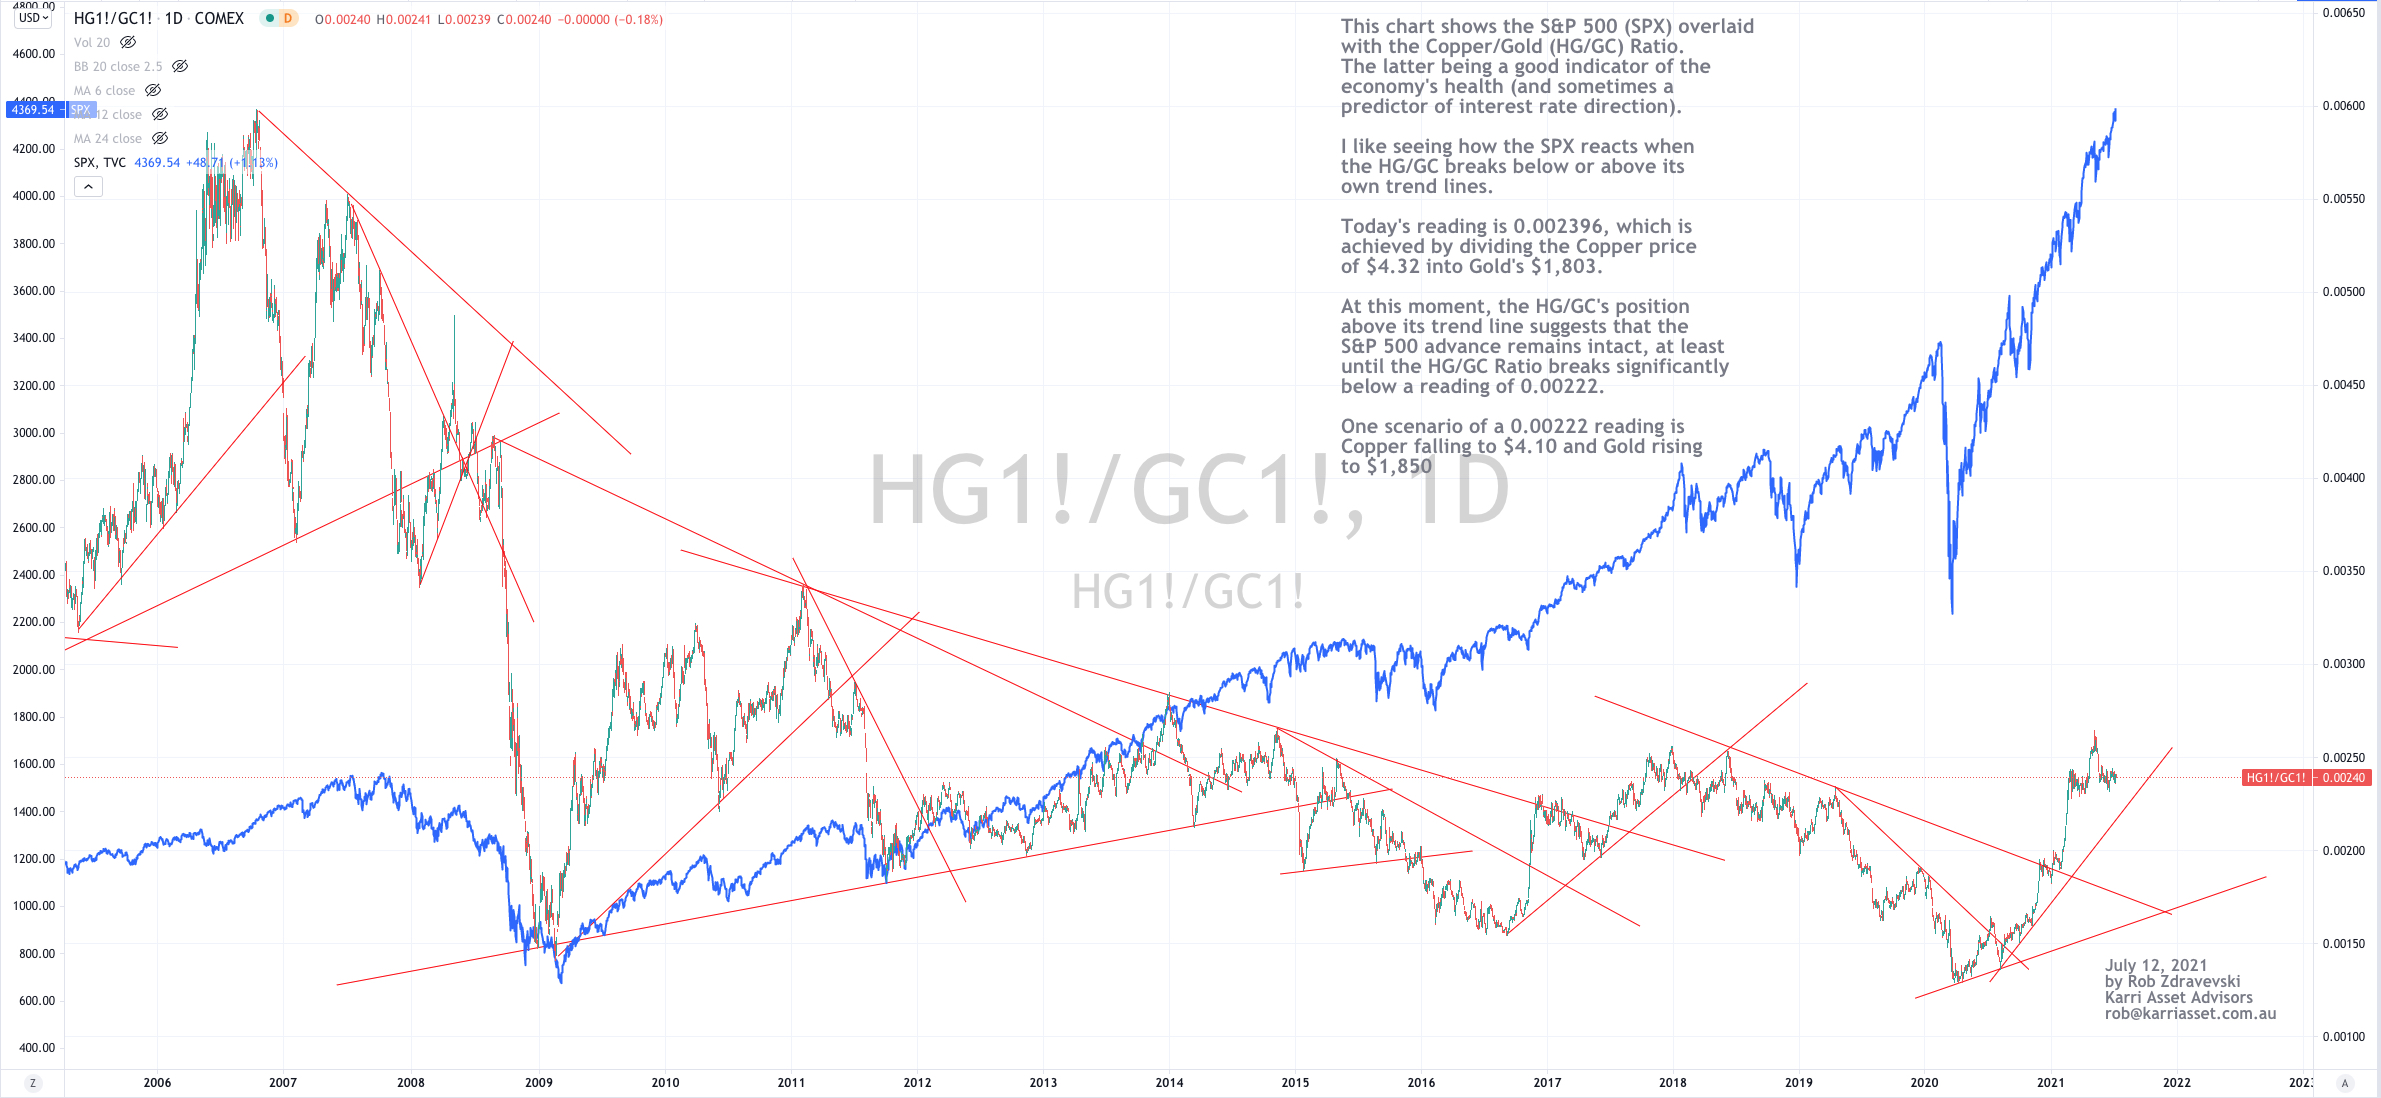
The chart below shows the S&P 500 (SPX) overlaid with the Copper/Gold (HG/GC) Ratio on a daily basis over the past 15 years.

The latter ratio is a good indicator of the economy’s health and sometimes a predictor of interest rate direction.

I find this chart helpful when pondering my asset allocation to equities and how much broader risk I am comfortable taking, especially at the later end of an advance, bull market or rally.

I like seeing how the SPX reacts when the HG/GC breaks above or below its trend lines.

Today’s reading of 0.002396 is calculated by dividing the Copper price of $4.32 into Gold’s $1,803.

At this moment, while the HG/GC’s is trading above its trend line (and a reading of 0.00222) it is suggesting that the S&P 500 advance remains intact……..

This seems quite perverse to many, as pundits reiterate their calls of an overvalued, ‘bubble-esque’ equities market.

In some recent posts I challenge the norm and perhaps the consensus call for a notable decline.

The S&P 500 can continue trading at the historical higher end of its historical stretch above its 200 Week Moving Average, just like the late 1990’s.

https://www.linkedin.com/posts/robzdravevski_the-sp-500-is-trudging-higher-and-has-registered-activity-6817722567969927168-bcxo

and the way the S&P 500 relates to the U.S. 10 year bond yield or more pointedly, the spread between the 10 year and 2 year yield is another important indicator to watch.

https://www.linkedin.com/posts/robzdravevski_its-an-interesting-market-day-developing-activity-6818881106222444545-Wh-o

Investing is a highly nuanced past time or business.

Often markets move to where they can do the most damage….and going up can cause as much damage as going down, in circumstances such as ‘missing out’ or underperforming other fund managers if you’ve been holding a lot of cash.

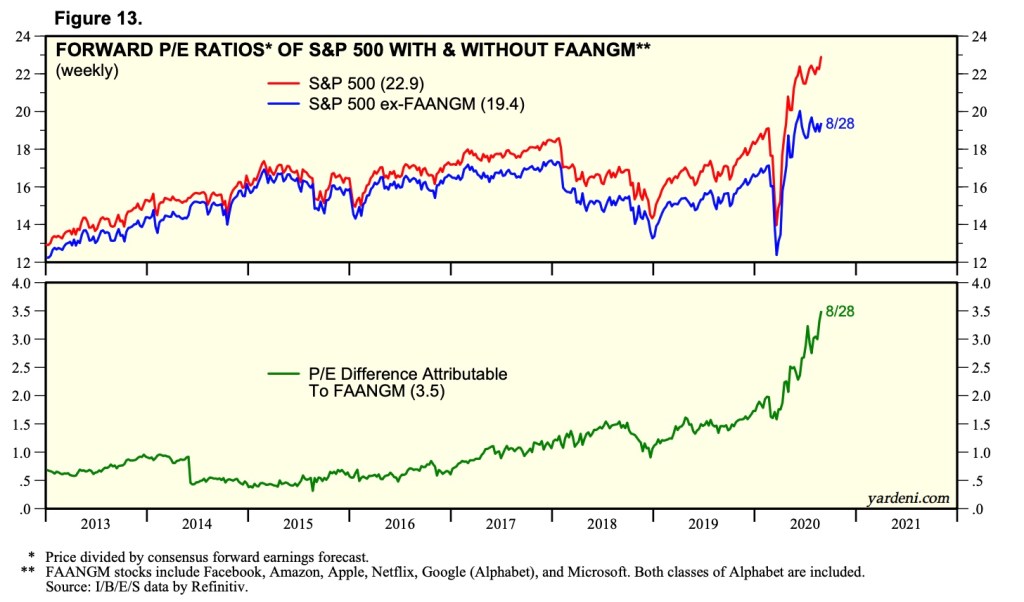
P/E ratios are not the only thing to look at.

One scenario of a 0.00222 reading is Copper falling to $4.10 and Gold rising to $1,850. Just something to play around with.

July 12, 2021

by Rob Zdravevski

rob@karriasset.com.au

An Even More Fertile Habitat

2 months ago, in the link below I wrote about equities being a fertile investing habitat.

I’d even say, there is no alternative (TINA), but that’s just a headline grab.

I mainly discussed the relative valuation and importantly the Earnings Yield of the S&P 500 versus the 10 year bond.

n.b. when P/E’s are 20, 30 and 40, absolutely cheap is difficult to find, although us stockpickers will continue to search.

https://robzdravevski.com/2020/07/15/equities-the-fertile-habitat/

Next year’s consensus P/E for the S&P 500 is 23 but on this occasion I wanted to extract the EPS estimates of the “inflated” FANNGM stocks.

These 6 stocks now make up 49% of the Nasdaq 100’s market cap and 26% of the S&P 500.

I found this work below which puts the S&P 500 P/E ex-FAANGM on 19.4.

This means the S&P 500’s Earnings Yield is 5.15% or 7.3 times more than the 10 year bond yield.

Re-iterating & re-phrasing comments from the linked story above…this multiple has NOT been seen since World War 2.

So, what’s the trade?

Perhaps…..Long selected portfolio stock ideas (or Russell 600 Small Cap) and Short Nasdaq 100 to hedge out the “overvalued” market risk?

I’ll get back to you.

source: https://www.yardeni.com/pub/faangms.pdfhttps://www.yardeni.com/pub/faangms.pdf

September 8, 2020
by Rob Zdravevski
rob@karriasset.com.au