The Copper/Gold Ratio says markets move higher
July 12, 2021 Leave a comment
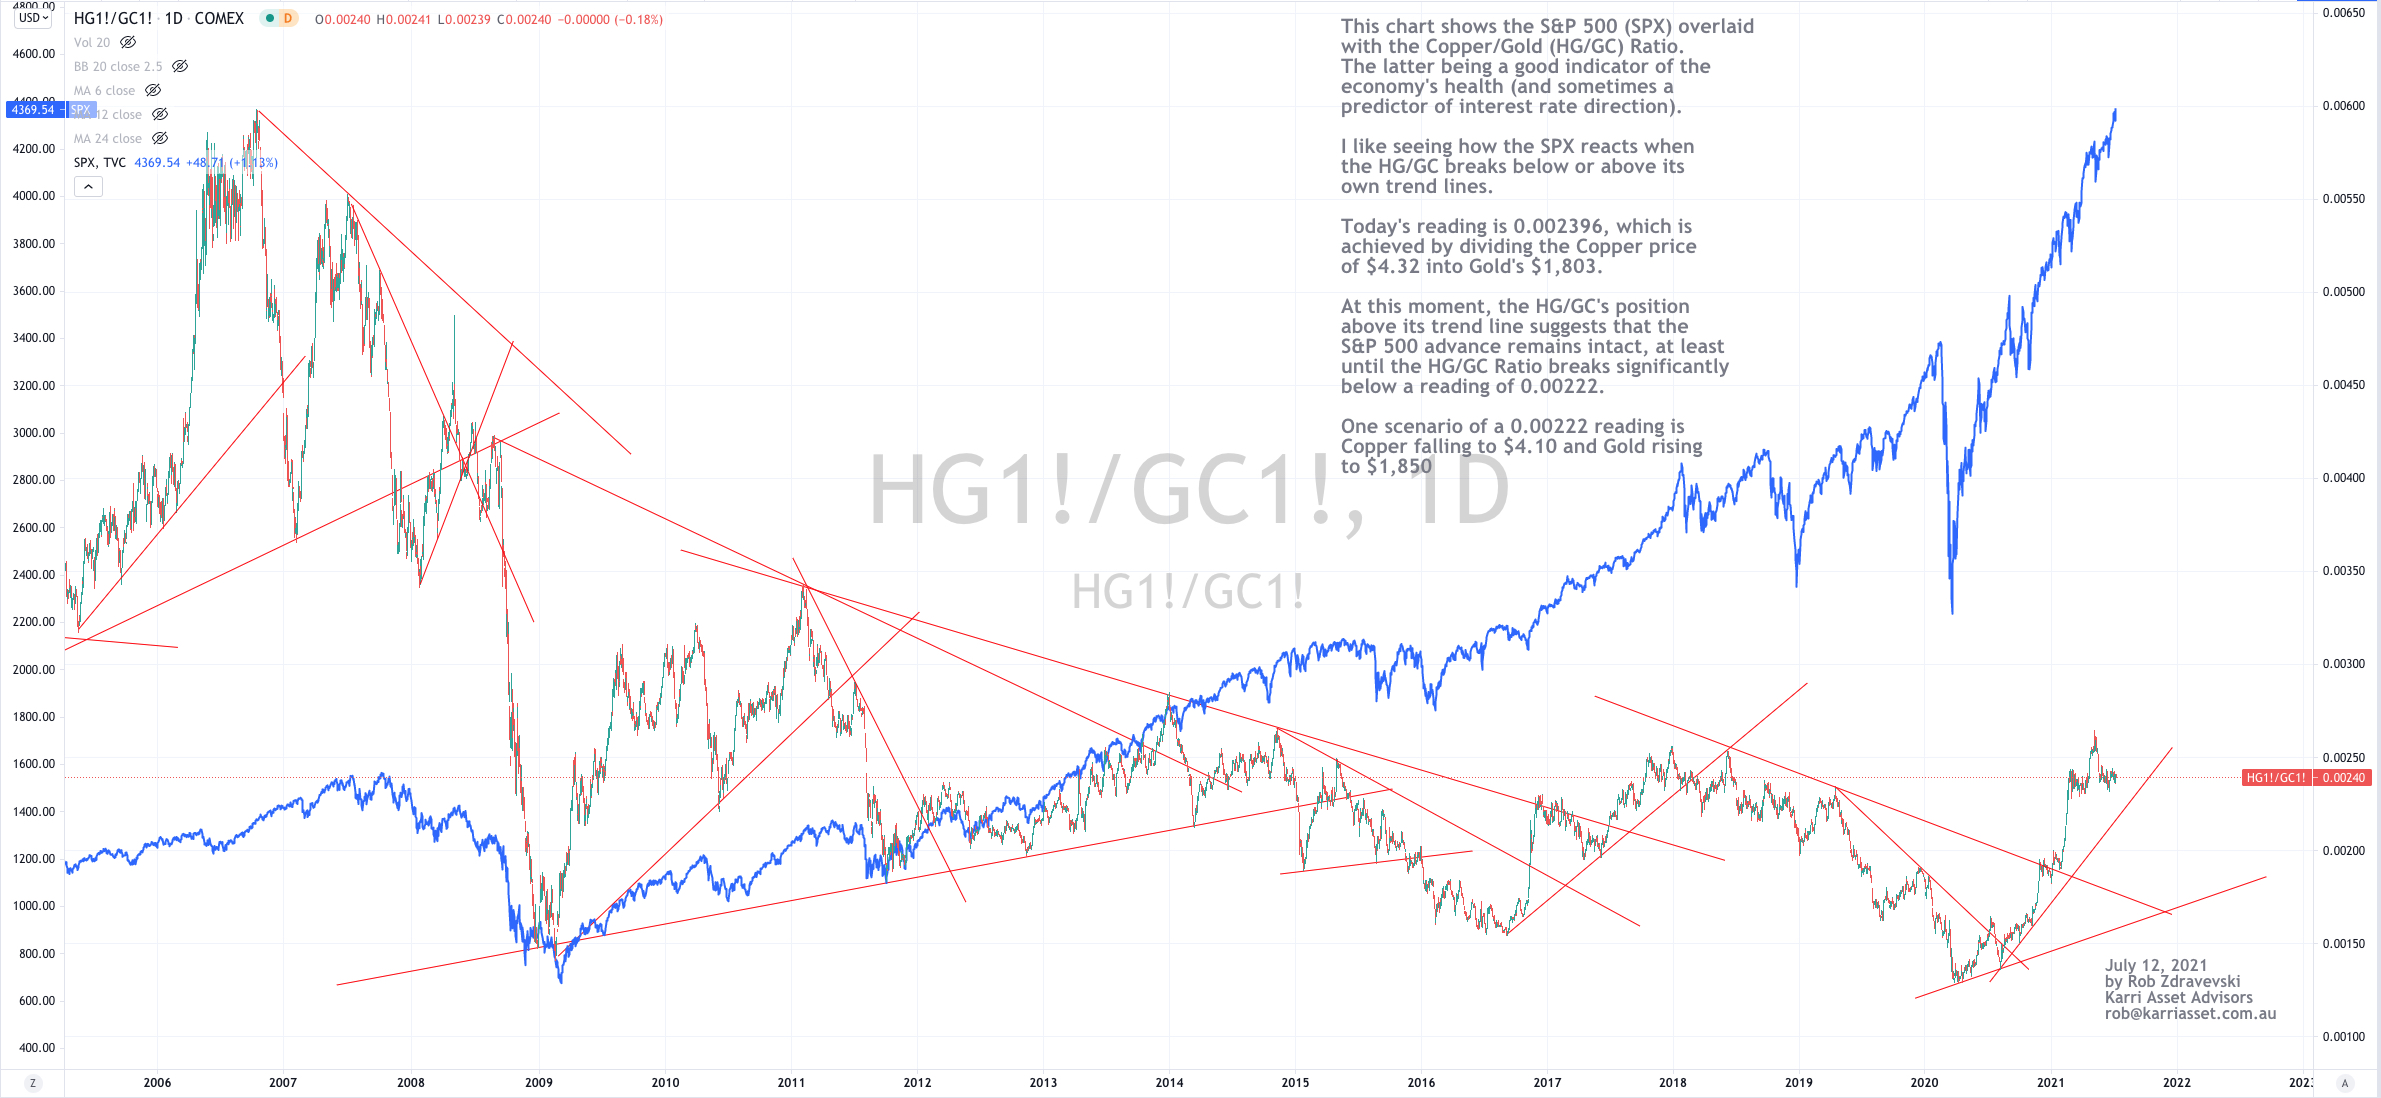
The chart below shows the S&P 500 (SPX) overlaid with the Copper/Gold (HG/GC) Ratio on a daily basis over the past 15 years.
The latter ratio is a good indicator of the economy’s health and sometimes a predictor of interest rate direction.
I find this chart helpful when pondering my asset allocation to equities and how much broader risk I am comfortable taking, especially at the later end of an advance, bull market or rally.
I like seeing how the SPX reacts when the HG/GC breaks above or below its trend lines.
Today’s reading of 0.002396 is calculated by dividing the Copper price of $4.32 into Gold’s $1,803.
At this moment, while the HG/GC’s is trading above its trend line (and a reading of 0.00222) it is suggesting that the S&P 500 advance remains intact……..
This seems quite perverse to many, as pundits reiterate their calls of an overvalued, ‘bubble-esque’ equities market.
In some recent posts I challenge the norm and perhaps the consensus call for a notable decline.
The S&P 500 can continue trading at the historical higher end of its historical stretch above its 200 Week Moving Average, just like the late 1990’s.
and the way the S&P 500 relates to the U.S. 10 year bond yield or more pointedly, the spread between the 10 year and 2 year yield is another important indicator to watch.
Investing is a highly nuanced past time or business.
Often markets move to where they can do the most damage….and going up can cause as much damage as going down, in circumstances such as ‘missing out’ or underperforming other fund managers if you’ve been holding a lot of cash.
P/E ratios are not the only thing to look at.
One scenario of a 0.00222 reading is Copper falling to $4.10 and Gold rising to $1,850. Just something to play around with.
July 12, 2021
by Rob Zdravevski
rob@karriasset.com.au