Bitcoin doesn’t march to its own drum
June 12, 2025 Leave a comment
Ya know that Bitcoin’s USD price is close correlated to the S&P 500 Index….
and when it’s not, often the SPX rises against BTC’s decline.
June 12, 2025
rob@karriasset.com.au

Trying to hear what's not being said
June 12, 2025 Leave a comment
Ya know that Bitcoin’s USD price is close correlated to the S&P 500 Index….
and when it’s not, often the SPX rises against BTC’s decline.
June 12, 2025
rob@karriasset.com.au
November 29, 2024 Leave a comment
It’s Friday, which means the Thursday (U.S. time) edition of the American Association of Individual Investors (AAII) Survey has been released.
History of survey results link here
https://www.aaii.com/sentimentsurvey/sent_results
and the respondents are more bearish than last week’s result.
and the bullish/bearish spread is negative at (1.5%).
It’s the highest bearish reading since Nov 2, 2023, when the bullish/bearish spread was also negative.
The most recent moment that the bullish/bearish spread was negative was in the April 25, 2024 release.
I have highlighted those 2 moments in the attached S&P 500 price chart.
This is in keeping with my other commentary that while we are late in this particular equity ‘party’ and the VIX is subdued, it looks like equities will ‘rip’ higher.
Like any place where waves are prevalent, you need to watch out for the rips.
November 29, 2024
rob@karriasset.com.au


October 26, 2024 Leave a comment
My World Series almanac fun fact:
It has been 36 years since the Los Angeles #Dodgers had a 2nd baseman playing in the World Series whose last name contained only 3 letters and they both ended in ‘X’. Incidentally, both of their first names have 5 letters.
Over the next month (October 20 – November 16, 1988), the S&P 500 fell 7%, to a low of 263 points.
2 weeks after the 1988 World Series concluded, a Republican candidate was elected President.
The S&P 500 never breached that low again,
And the Dodgers won.
Put that in your pipe and smoke it !
#baseball
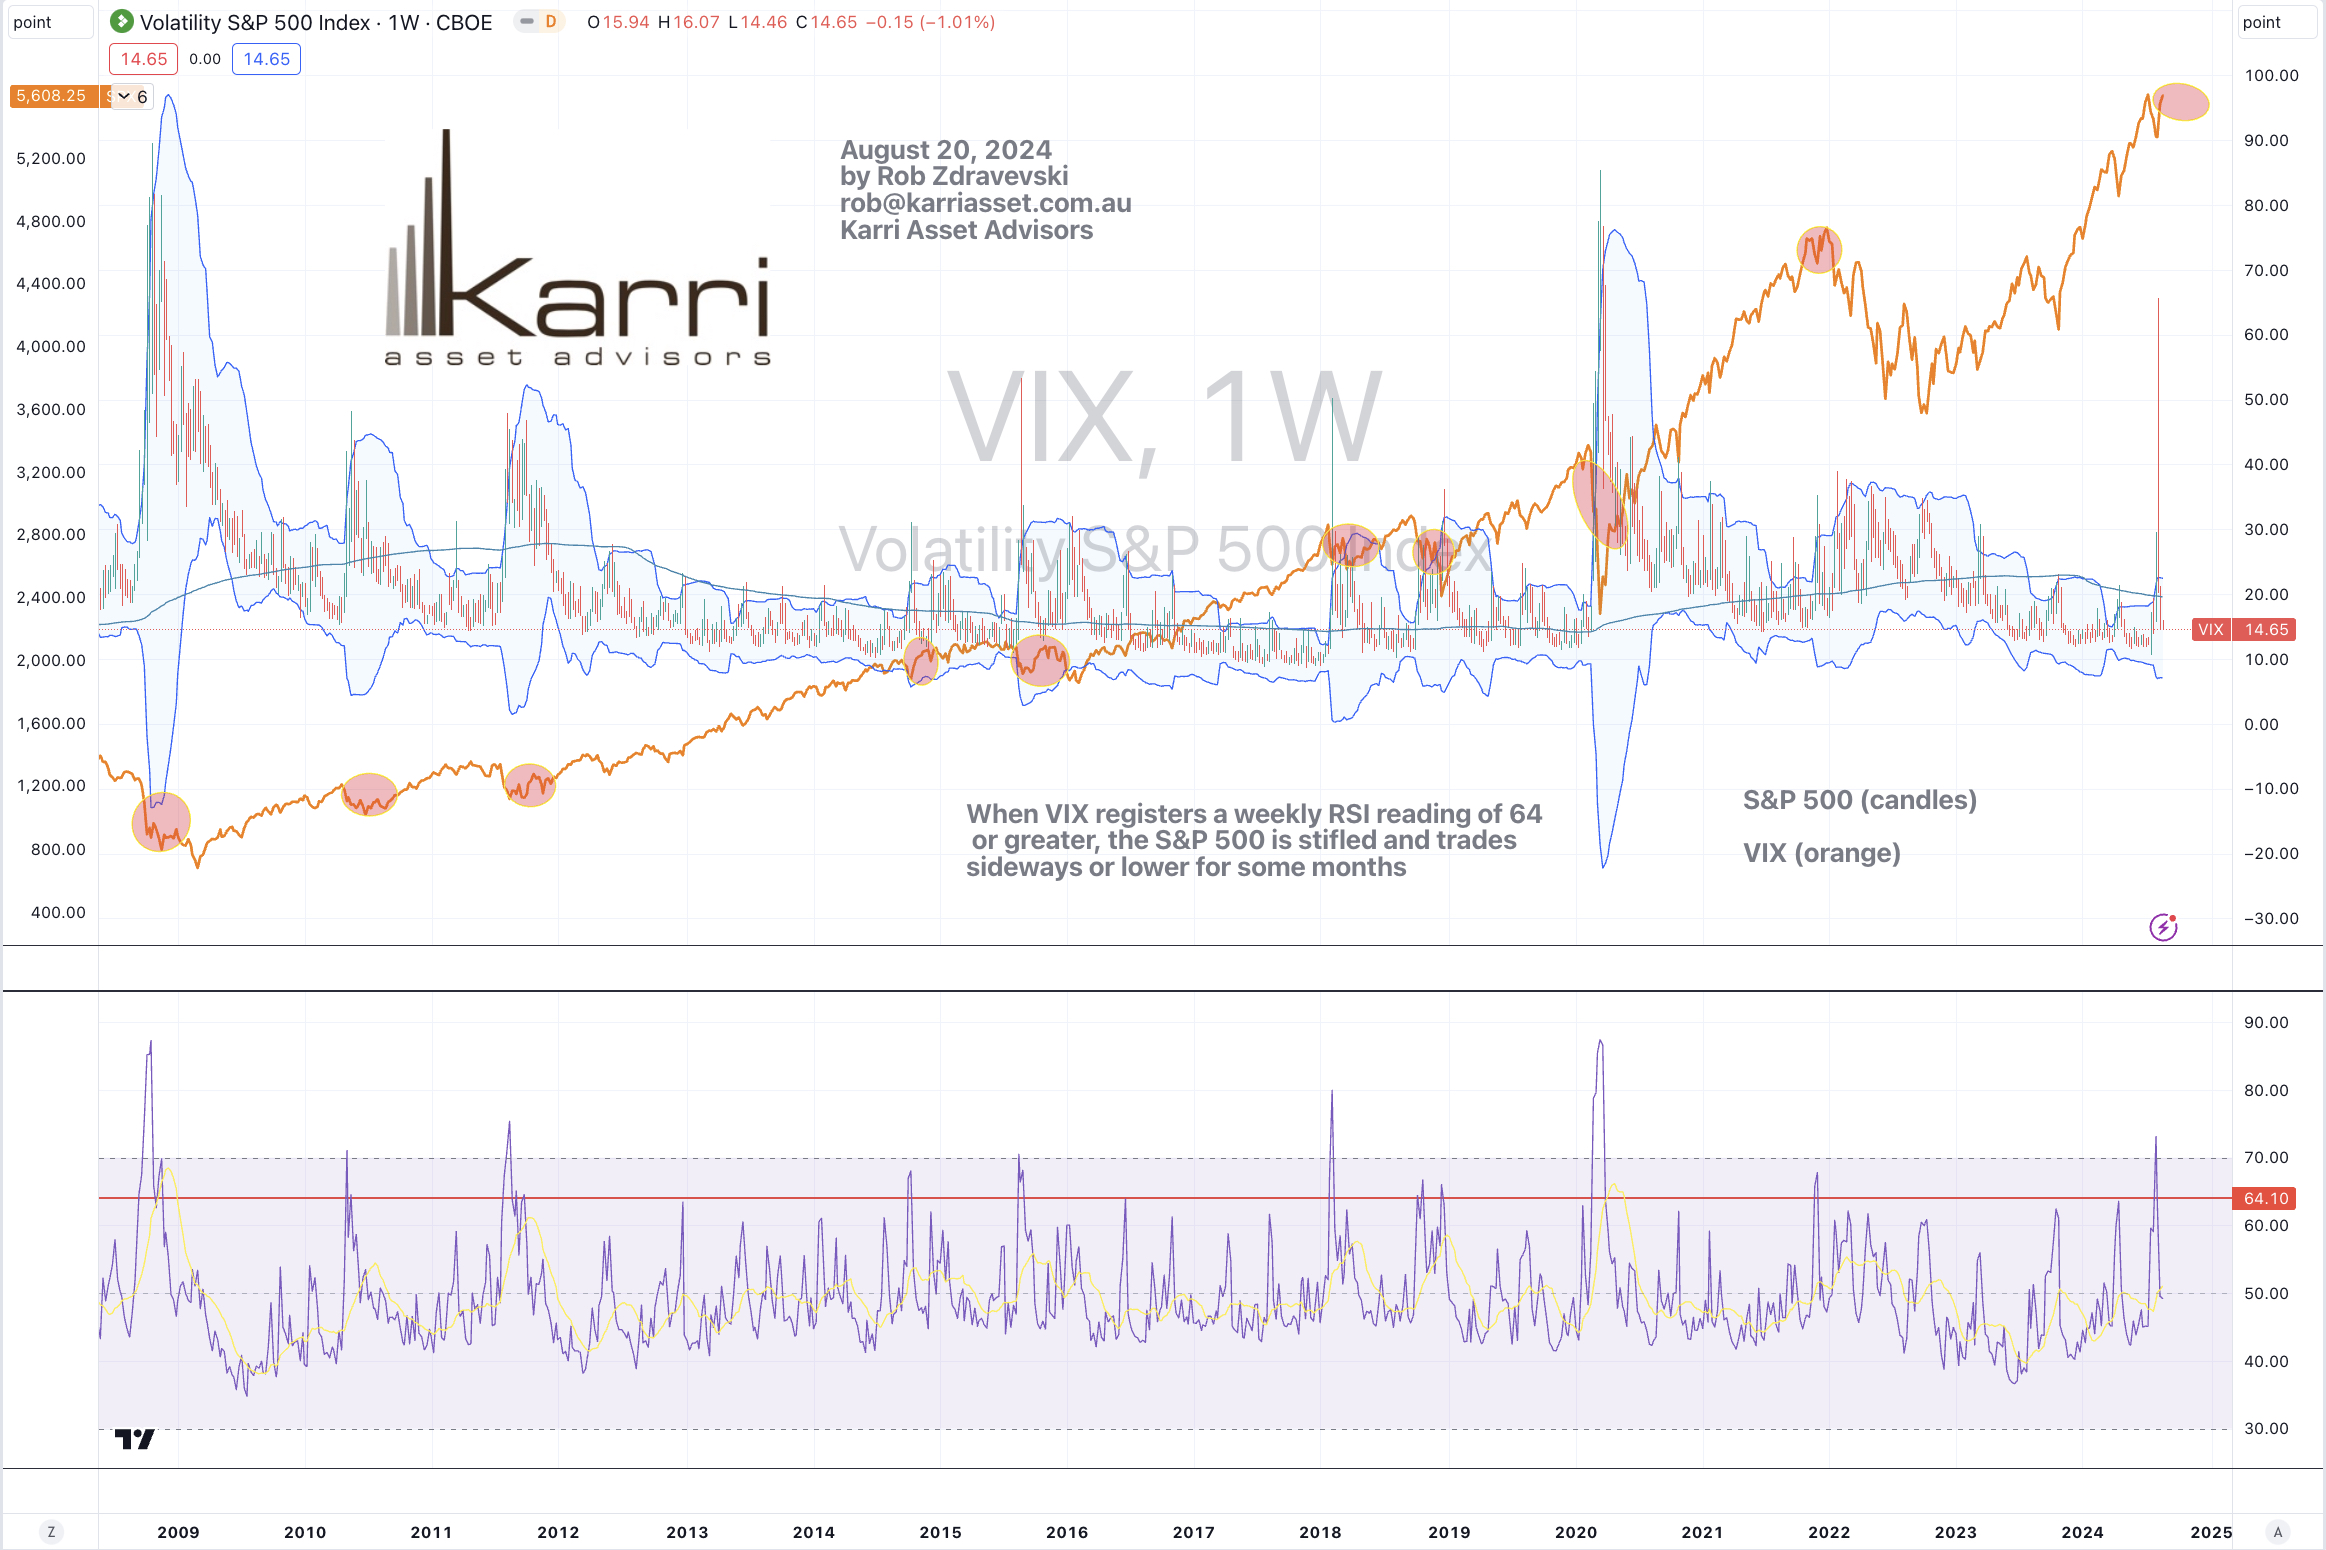
August 20, 2024 Leave a comment
The S&P 500’s climb up the wall of worry is over.
My story link mentions the advance ends when the VIX registers a weekly reading of 64 or greater.
It did that last week.
The study below circles the S&P 500 when that weekly VIX vol64 occurs. It then trades sideways to lower, for many following months.
Not to worry, the ‘market’ will change its shape and weight will be re-distributed.
August 20, 2024
by Rob Zdravevski
rob@karriasset.com.au
August 12, 2024 Leave a comment
Last week’s palaver about unwinding Yen trades is old news.
The Yen has nearly swung to the other side of the pendulum.
The study below shows the 13 moments over the past 15 years when the AUD/JPY was trading (coinciding with a couple other metrics) at a weekly RSI reading of 36 or below.
I say ‘nearly swung’, for we are close but not there yet……for another such occurrence.
When they do occur, they bode well for listed equities risk appetite.
The Nasdaq 100 index appears within my study as a comparison.
August 12, 2024
by Rob Zdravevski
rob@karriasset.com.au

August 12, 2024 Leave a comment
To support a case for a tactical bounce in the equity markets,
I have used red to highlight the data when the AAII investor sentiment survey has had the narrowest spread between bullish and bearish respondents,

And I have circled those corresponding moment in the accompanying S&P 500 chart.

So that all looks lovely when many of the bulls disappear.
Although, ‘bounces’, by nature are short-term.
For the strategic equity allocators, this note supported the ‘grind’ higher for the S&P 500
But that was back then and we are now deeper into this grind.
My final line in that note said, “It’s not the safest of markets”.
August 12, 2024
by Rob Zdravevski
rob@karriasset.com.au
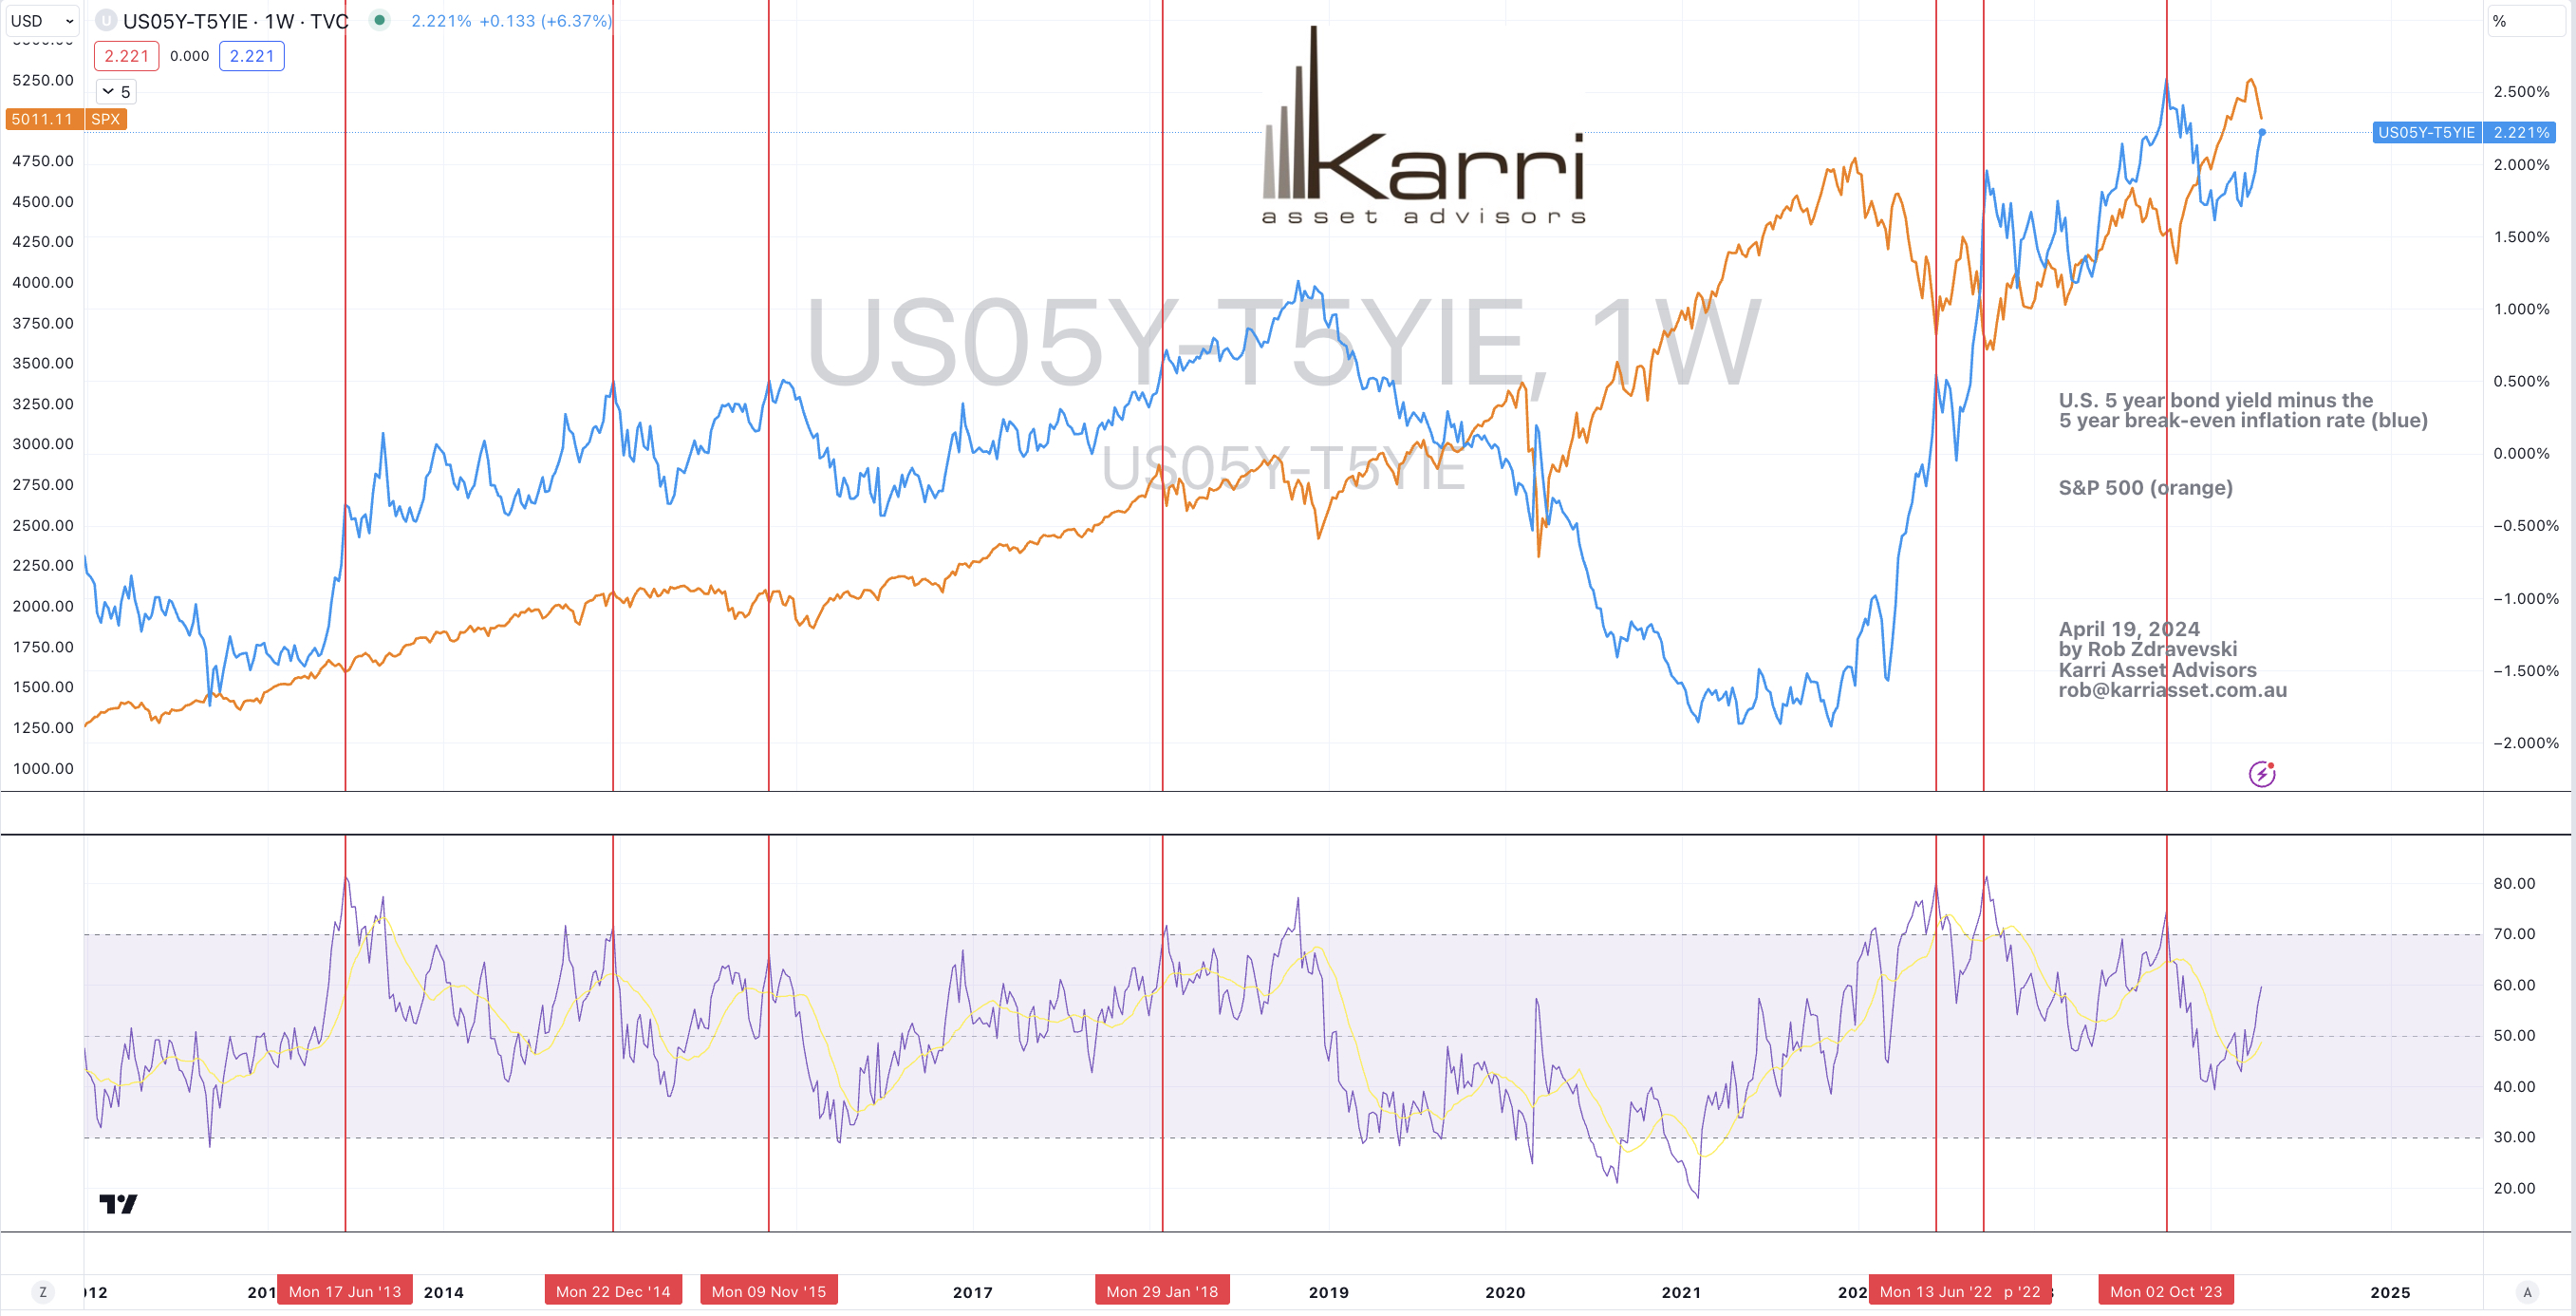
April 19, 2024 Leave a comment
Here’s one for boffins;
My study of the U.S. 5 year government bond yields minus the 5 year breakeven inflation rate is close to hitting a combination of metrics which increases probability that the S&P 500 commences a new or extends an existing rally.
The red vertical lines denote previous such moments.
April 19, 2024
by Rob Zdravevski
rob@karriasset.com.au
November 29, 2023 Leave a comment
The attached study was first published in June 2023.
It highlighted the moment when the VIX registered a certain RSI level in late November 2022.
12 months on, the S&P 500 has climbed 15% up the wall of worry that I allude to in the graphic below.
Recently, the VIX weekly RSI did not trade above 64 and it’s approaching 38 again.
The actual VIX Index is now at its lowest point since mid-January 2020.
The is little volatility present.
Others may suggest complacency and imply the buying of insurance is cheaper…..my work suggests that there is life in this S&P 500 advance,
but in the short-term, it’ll be in timing when to add or allocate.
November 29, 2023
by Rob Zdravevski
rob@karriasset.com.au

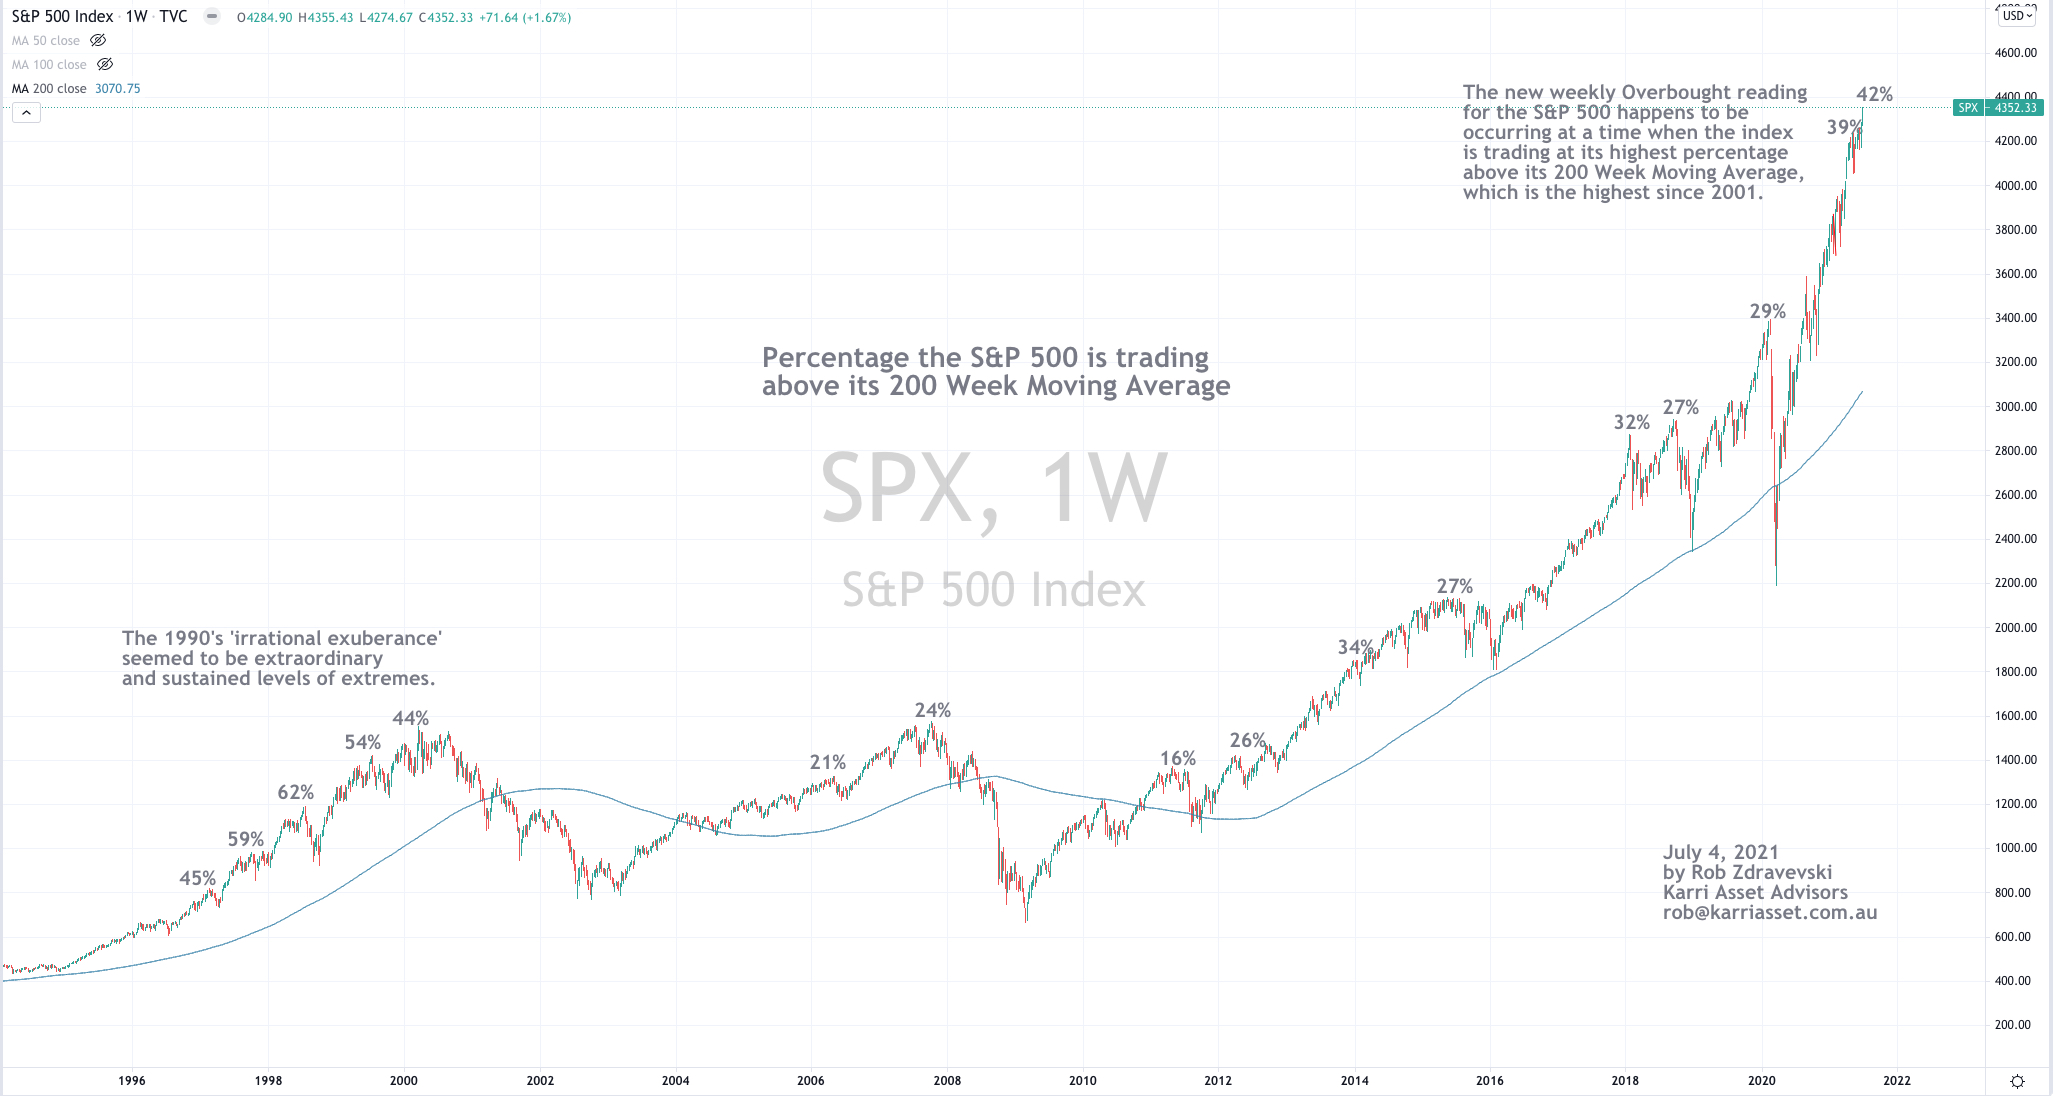
July 5, 2021 Leave a comment
The S&P 500 is trudging higher and has registered a new Weekly Overbought reading.
This Overbought moment is also occurring with some coincidence of it also trading at its highest percentage above the 200 Week Moving Average (WMA).
This is long-term stuff.
These levels were last seen in 2007 and 2001.
It seems logical for the S&P 500 to mean revert over the coming 2 years but keep in mind the mean will continue to roll higher, perhaps to 3,500 in mid-2022.
So, if the S&P 500 ‘rolls over’ and meanders from current levels back to the 200 WMA, it’ll result in a 20% decline and only mean we are back to the same levels seen in November 2020 (for context, that’s 8 months ago)
This is why I think index based/ETF type (overly diversified) investing will provide poor results over the coming 2 years and the ‘age of the stock picker’ is already upon us.
Although (and perhaps confusingly), if you reference this link, the broader market also has every reason to carry on higher, much like the late 1990’s and perhaps more so when coupled with today’s liquidity and with a risk-free rate (the 10 year bond yield) which is now averaging ~ 1.8% as opposed to the 5.5% in the late 1990’s…..all, until the 10 year minus 2 year yield spread moves above 2%.
July 5, 2021
by Rob Zdravevski
rob@karriasset.com.au
March 21, 2021 Leave a comment
The latest chatter about the steepening of the yield curve between the yield of the US Government 10 year bond (minus) and the 2 year bond is no big deal.
That differential (“the spread”) is currently at 1.56%,
(that’s how much the 10 year bond is yielding above the 2 year bond and it is represented in a plotted graph, we call the yield curve)
Yes, it’s the widest spread since September 2015, but it’s not extraordinary.
It has been twice that amount (3%) on several occasions over the past 30 years. (see chart below)

There is some exaggeration about how steep the curve is…it actually isn’t.
Don’t worry too much about that yield curve at the moment.
My story is about when the spread actually touched Zero (which is when the 10 year bond was offering the same yield as the 2 year bond) and not so much the actual spread nor the yield of the 10 year bond.
And then I have added comments to what happened to the equities market afterwards.
Example #1
In April 1998 the spread touched Zero,
but the S&P 500 continued to rise until the S&P 500 peaked in March 2000; some 21 months later.
A year earlier, in April 1997, the 10 Year Bond (“the 10’s) was yielding 7%.
By April 1998 it had fallen to 5.6% (when the spread was Zero)…..
the yield would decline a little more, down to 4.4%.
By March 2000, it had climbed back to 6.66% to coincide with a peak in equities market.
Example #2
In January 2006, the spread was at Zero again, but stocks rallied for a further 17 months until the S&P 500 peaked in October 2007.
From that moment in January 2006, the 10’s rose from 4.3% to 5.3% on a couple occasions, reaching that same 5.3% peak in July 2007, just as economies were about to experience the ‘Global Financial Crisis’.
For a period of 6 weeks, the 5.3% yield did break above the downward sloping trend line (see the chart below) but the precedent of a Zero spread being registered 17 months earlier held sway.

Example #3
By December 2008, 10’s had fallen to 2% (although the spread didn’t flirt with Zero, it never went below 1.2%).
From this ebb, the yield doubled to 4% over the next 18 months (April 2010).
The stockmarket fell 20% over the next few months.
Example #4
Through stages of the GFC recovery, 10’s were back to 1.4% in July 2012.
Within the next 18 months (by December 2013), the 10’s doubled to 3%
The stockmarket rally was stifled and went sideways for 5 months.
Even though rates doubled, equities remained in a bull market because we never saw a Zero spread registered.
Equities resumed their rally as 10’s commenced a new decline in yields from 3% down to 1.7% over the next 14 months, being until January 2015.
Note: The United States Federal Reserve kept the Fed Funds Rate at Zero between 2008 and 2015.
Example #5 (the anomaly)
By July 2016, 10’s eased a little more to 1.35%. From there, they nearly doubled again (to 2.6%) within 5 months and then touched 3.2% by November 2018.
Although rates nearly trebled…..they never registered a Zero spread reading. Furthermore, the anomaly is that the 10’s yield broke above the sloping downtrend resistance line (see chart below), which gave the S&P 500 ‘carte blanche’ to rally….all until the 10’s yield crossed back beneath that (now and new) support line in the month of August 2019.
Example #6
In the next month, September 2019, saw another Zero spread registered.
While absorbing an abrupt correction, the S&P 500 has soared and continually set new all-time highs, 18 months hence.
Today, the 10’s have Quadrupled from their 0.40% March 2020 low, to its current 1.72%.
Uncannily, we are 18 months further along since the spread touched Zero and we have seen an equity market participate in extraordinary gains…….
I will re-iterate…….the interest cost of government debt has Quadrupled within 12 months.
That matters to investors and to the government servicing the interest payments.
But we are at a moment, similar to the anomaly explained in Example #5.
Forget the ’spread’ and steepening yield curve, but let’s say the 10 year bond yield reaches 2% and decisively breaks above that sloping downward line, then it’s plausible that the S&P 500 rallies for a further 18 months.
This bullish scenario may represent the ‘last leg’ in the 11 year bull run which commenced at the March 2009 low.
Although, greater probability suggests (coinciding with fundamental valuations and various sentiment and anecdotal indicators) that the quantum of quadrupling interest rates will prove a greater weight on equities plight for further gains.
This is the measured reason why I have shifted client equity portfolios to 35% cash position and hedged portfolios with put options. This was mentioned in my January 2021 newsletter.
March 21, 2021
by Rob Zdravevski
rob@karriasset.com
