Currencies tell the truth

Worried? Risk averse?

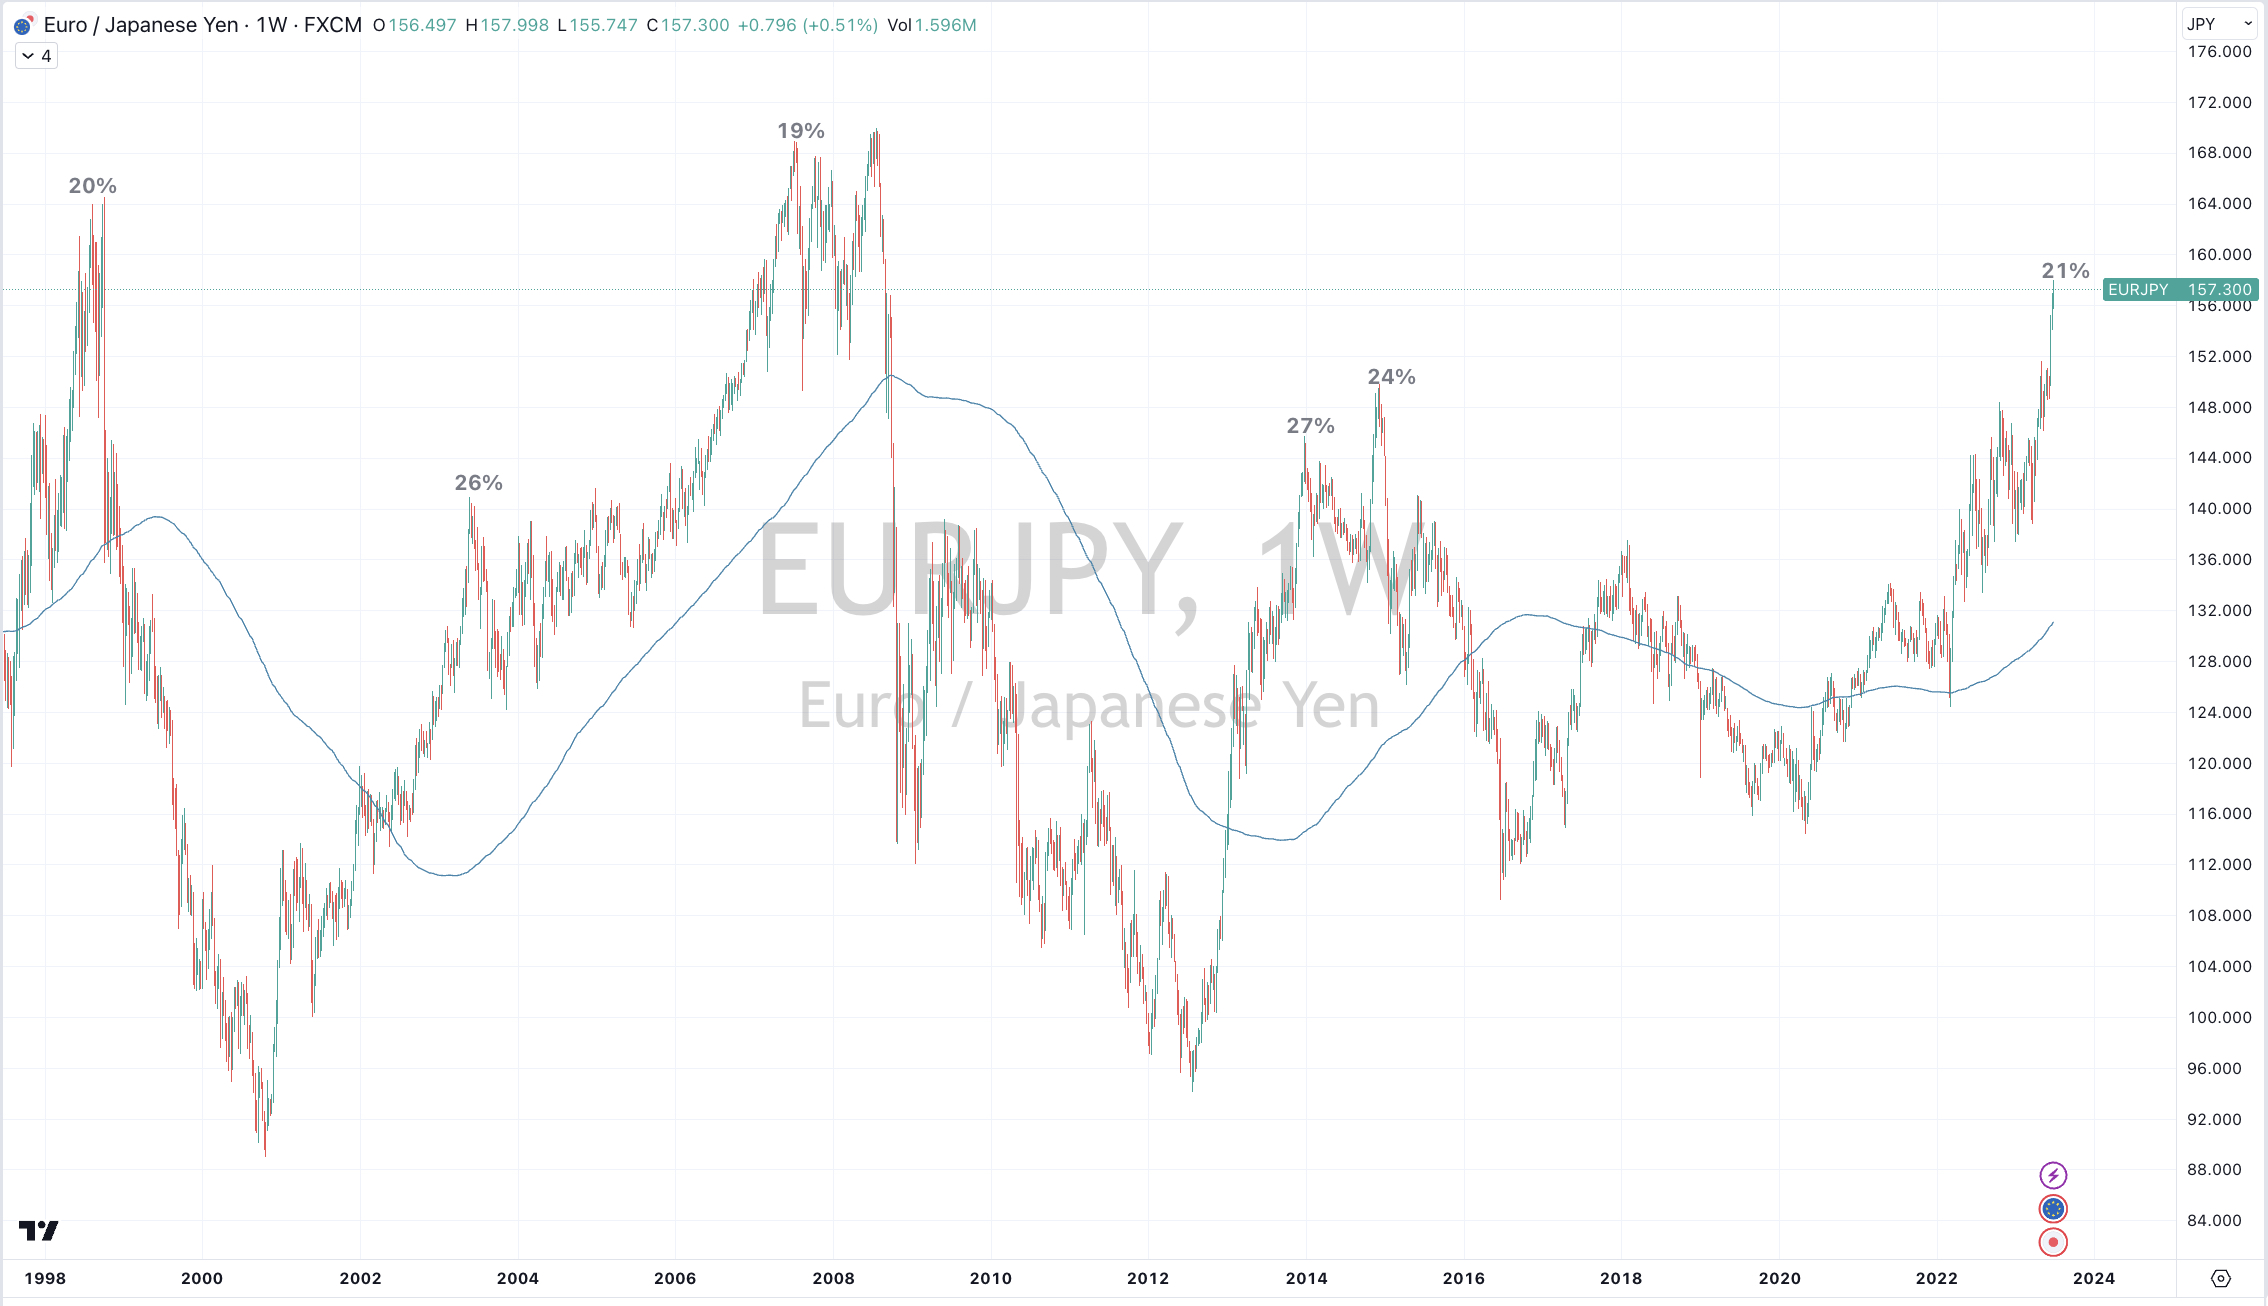
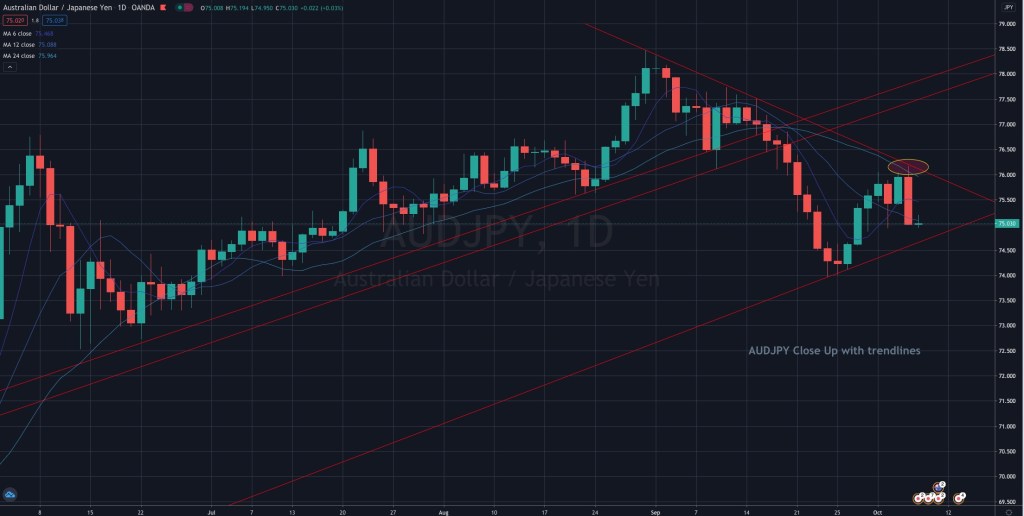
That’s when investors huddle in the Swiss Franc or the Japanese Yen…..inversely they dispose of their Australian Dollars.

We are approaching the 7th time (in the past 30 years) that such defensive huddling and perhaps maximum risk aversion has occurred.

The attached monthly study shows that when the CHF/AUD simultaneously registers a monthly overbought reading, trades at 2.5 standard deviations above its rolling average and at a notable percentage above its 50 month moving average…….

you don’t throw away your equities, in a wholesale manner.

In fact, consider the antithesis.

August 5, 2024

by Rob Zdravevski

rob@karriasset.com.au

Screenshot

Yen rises 11% against the Aussie

The only thing you are forced to decide is to choose a #currency.

This is applicable when making, settling or holding an investment.

Holding cash is also an investment and many of the ‘truly’ global investors also ponder which (mix of) currency to hold their cash in.

Recently, I have highlighting the extreme weakness at which the #Japanese Yen has been trading at and more specifically, the Australian Dollar’s strength again the Yen (which is a good indicator of investors risk appetite).

Prompts to buy the Yen appeared in my weekly macro extremes publication and in this recent “Bigger Calls” newsletter.

https://mailchi.mp/karriasset/the-bigger-calls-q3-2024

If I chose the worst entry point (over the past 5-7 weeks) to have bought #Yen and sold #AUD, the current return would resemble at least 8% over the past 3 weeks or perhaps 11% if your timing was impeccable.

I think that is a bit more than interest earned in an Australian term deposit?

As a standalone #FX trade with the AUD/JPY trading at 95.40, it is now in the category of “good enough”.

August 4, 2024

by Rob Zdravevski

rob@karriasset.com.au

Screenshot

Selling Euro / Buying Yen

I think that the ‘fat part’ of the Euro advance against the Yen has been seen.

Today’s price is 157.26

Not to be relied on in isolation but this study below shows the percentages which EUR/JPY is trading above its 200 week moving average……and when combined some other studies, it increases the probability of my belief.

Beyond your standard FX trade (currency conversion) this also means European customers and buyers of Japanese parts, components and product should order and pay for their Japanese products ‘tout suite’.

They should be at their cheapest prices seen in the past 3 years, even when considering Japan’s inflation rate of a ‘mere’ 3.2%.

June 30, 2023

by Rob Zdravevski

Karri Asset Advisors

rob@karriaseet.com.au

A weak Yen queues continued equity strength

When the JPY/AUD is oversold, it bodes well for continuing an equities advance.

Inversely, equities are stifled when JPY/AUD is overbought.

June 16, 2023
by Rob Zdravevski
rob@karriasset.com.au

Re-visiting the weakness in Yen

This chart shows the percentage that the USD/JPY is trading above its 200 week moving average.

The extension that we are seeing currently is quite a rare moment.

Many of the previous percentage peaks coincided with the currency cross simultaneously touching 2.5 standard deviations above its rolling weekly mean and it registered a weekly Overbought reading.

October 22, 2022

by Rob Zdravevski

Karri Asset Advisors

rob@karriasset.com.au 

AUD high against Yen, Euro and Sterling

It is an appropriate and strategic moment for Australian Dollar importers and/or speculators to sell (a tranche of their intended or required) AUD and use it to either buy Euro (EUR), British Pounds (GBP) or Japanese Yen (JPY).

The (multi-timeframe) bullish trend for the AUD (against these currencies) remains intact as they register 5-7 year highs against these crosses.

It’s more perverse that the AUD is weak against the USD….and whilst it finds a floor, a rise in the AUD/USD (DXY is Overbought) will aide a few more percentages for an additional tranche of buying more EUR, GBP or JPY.

September 12, 2022

by Rob Zdravevski

rob@karriasset.com.au

Watching the AUDJPY

The AUDJPY….

I’m watching an acute short-term moment on this quite reliable indicator of “risk” or at least market direction and sentiment.

The chart below shows today’s early action of the AUDJPY peppering that descending trend line. Tie that into yesterdays post (link below) and you can watch how other assets react.


https://robzdravevski.com/2020/10/05/short-term-aud-fx-range/

October 6, 2020
by Rob Zdravevski
rob@karriasset.com.au

Market Quips & Synopsis – Sept 18, 2020

Market Quips & Synopsis Some brief points about selected markets or assets and look for the links within for added musings.

About current markets, I’ll open up by saying..

I notice there is dangerous trading going on, market capitalisations in some companies are extraordinary.
For example, how does $1 billion market cap on revenues of $20,000 sound?

ASX scuttlebutt says, “shorts” are trying to pressure companies into raising capital, some are seeing increased stock “promotion” activity and there are many people in the market “that don’t know what they’re doing or shouldn’t be there”.

I see the AUD and XAU (Gold) in a holding pattern, (see the AUD chart below);
they need to hold 0.7240 and $1,902 respectively,
breaks above 0.7355 & $1,978 should see a new lurch higher

Also watching AUDJPY closely, need to hold 76.00 to confirm “more risk-off”,
A move above 0.7730 suggests “risk-on” and higher equity indices

Another indictor to assess the steam in a S&P 500 decline is whether Japanese 10 Year Bonds (JGB”s) trade below 0.00%.

The S&P 500 is down 6% from recent highs,
Indicators are not clear in calling a new downward trend, however I think 3,272 is the target (a further 2.5% lower).

The Nasdaq 100 has now fallen 11% since its September 2nd high.
Looking for it to ease a further 2.4% to 10,814 before determining the strength of the decline.
The decline wasn’t a surprise, as written by me on August 29 and September 3rd  

Global portfolios have a 3% short position in either (or both) the Nasdaq 100 or the SOX index

My ASX 200 target is 5,803, which is 1.2% below the price as I write.

I’m pleased with calling Oil down from $44 to $39.30. Brent held $39.30 for the past week, 
has since rallied 10% in past 4 days….quick rallies are not always a preferred scenario

VIX remains relatively high at a reading of 26, the call option phenomenon has influenced this increase

The De-Equitisation story combined with rising money supply & low interest rates leads to my thesis that higher equities is the dominant and over-arching long term theme.

While we accept near-term rates will stay Lower for a while,
I think the long end of interest rate curve will rise.

AAII Survey exhibiting narrowest bull/bear spread since June 11, which is when S&P 500 had a 8.2% decline.
Since March 5th, more retail investors have remained bearish (than bullish). This survey remains a reasonable contrarian indicator as markets bottommed on March 26th and never looked back.

Oil Rig count showing no meaningful change of increase, see attached, number of rigs in operation has halved

I remain long term bullish on the Oil price and continue to accumulate positions (proxies) to benefit from this opinion.
Incidentally, I have a view there is a coming crisis in energy prices which will stoke inflation (albeit it may be 18 months away) 

In another edition, I’ll expand on various investing themes and I hope to soon publish my bullish thinking about Platinum on my Linkedin page.

That’s all for now…

warm regards,
Rob