JGB’s leading the way
September 10, 2020 Leave a comment
Yield in Japanese Government 10 year Bonds (JGB) are moving lower today, falling from 0.03% to 0.022%.
This is a big move!
What’s more significant is they look set to move below 0.00% and into a negative yield as a new “short-term” downtrend seems to be developing.
A little correlation to watch is what looks like a leading indicator.
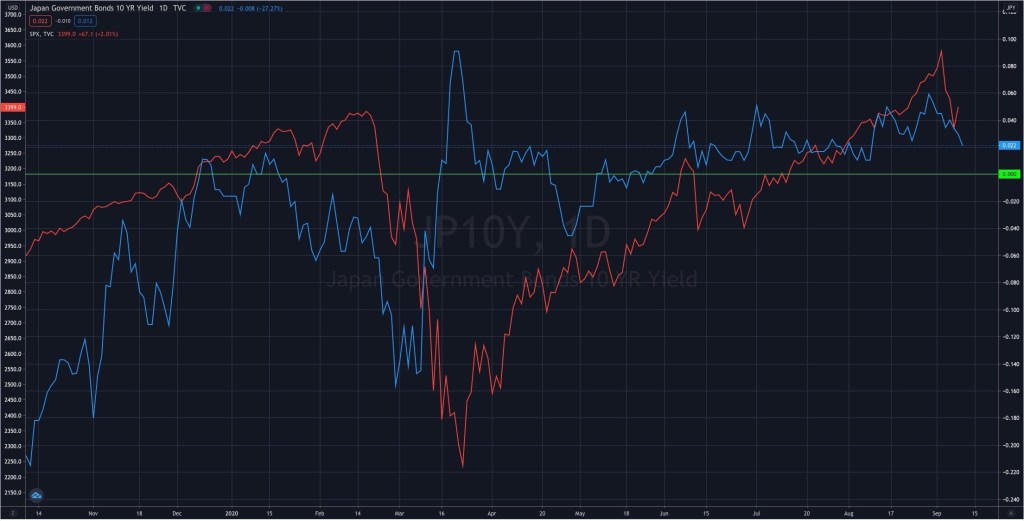
The JGB’s are preceding a move in the S&P 500 AND a most notable historical observation was the JGB downtrend which started in mid-January 2020 signalling an early peak in the S&P 500.
The downward pressure on the S&P 500 seems to have increased especially when the JGB yield went negative.
For now, let’s watch it if it moves below zero again.
In the chart below, the blue line is the JGB yield (right hand margin) and S&P 500 appears (legend in the left hand margin) in red. The green horizontal line is the 0.00% interest rate mark.
September 10, 2020
by Rob Zdravevski
rob@karriasset.com.au