You won’t lose your job hedging at these levels
September 28, 2020 Leave a comment
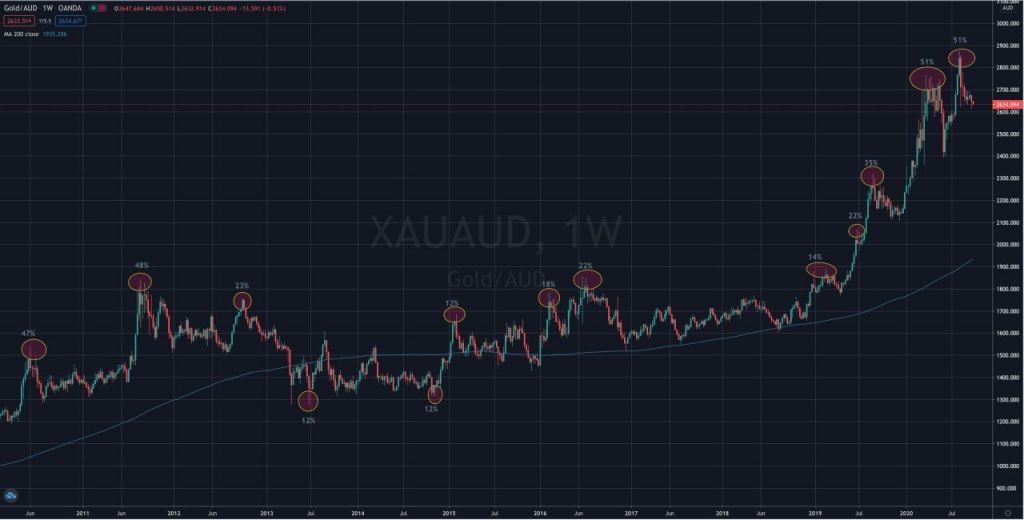
When the price of Gold in Australian Dollars trades at 50% above its weekly 200 moving average……it may be time for Aussie gold producers to hedge.
Similar to my previous work on the USD price,
https://lnkd.in/gK9hj-P
…..the chart below shows the various percentages that the XAUAUD price is relative to its 200 dma.
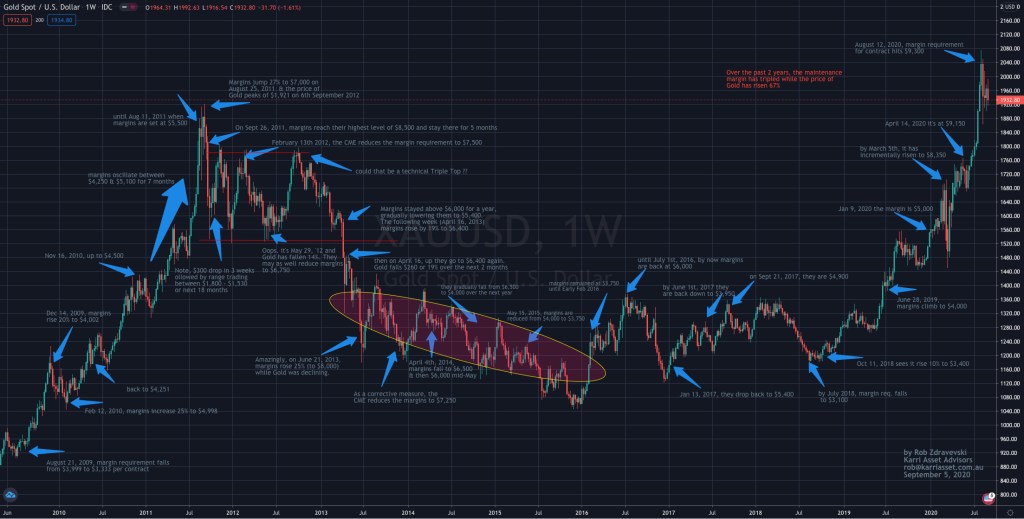
If you combine the recent surge in the gold price with the historic peaks of the CME gold futures margin requirements, a long term overbought reading in the AUDUSD and my other extremes seen in Gold……
you’re unlikely to lose your job, hedging your gold resource and reserves at these prices.
Incidentally, when the CME hiked margins requirements on August 11th, 2020, the AUD gold price fell and closed at A$2,676.
Today, it’s trading at A$2,636. Much of a muchness, although mean reversion and probability can be unpleasant.
September 28, 2020
by Rob Zdravevski
rob@karriasset.com.au


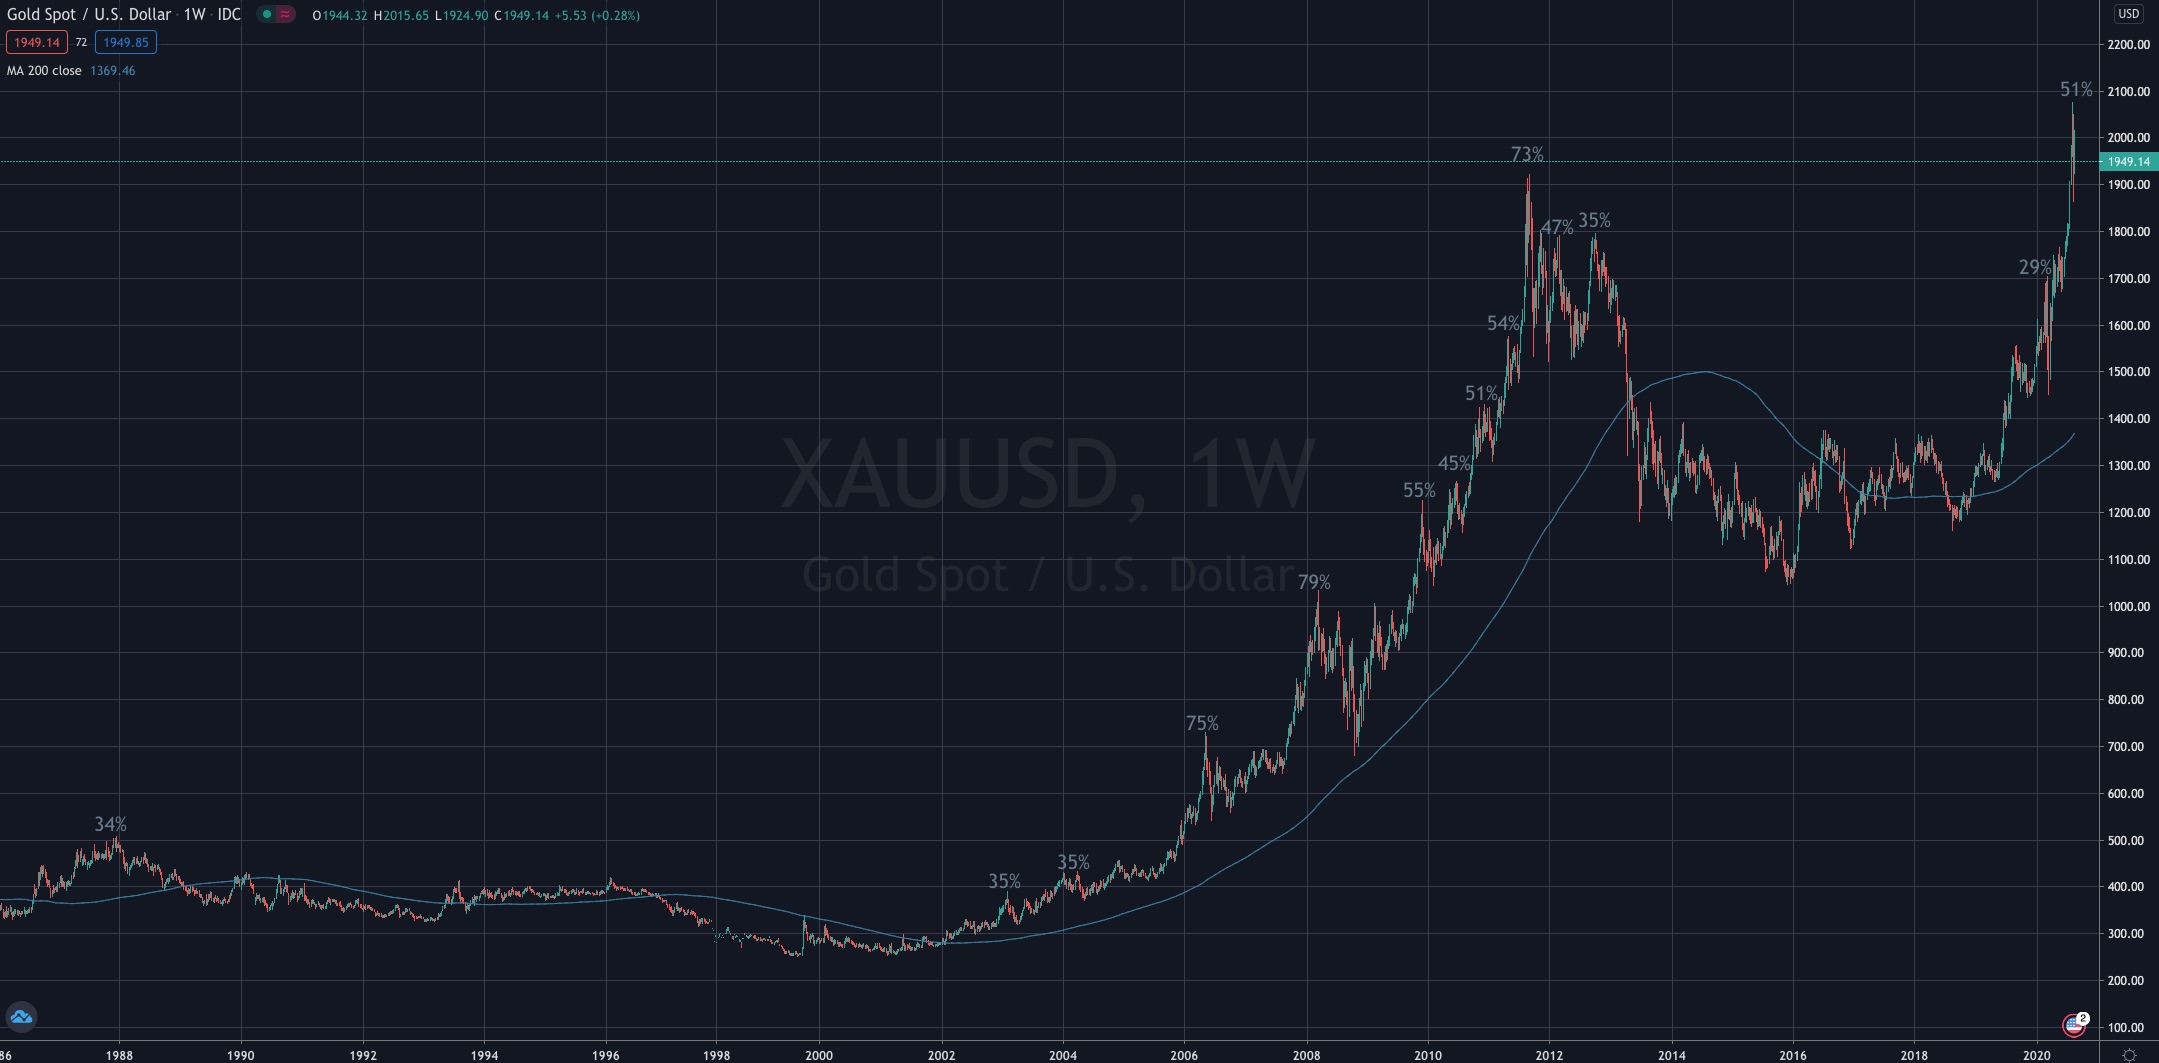


Below is a “weekly” 35 year chart of Gold and its rolling 200 day moving average.
At selected peaks, I have added the percentage that the Gold price was trading above its “weekly” 200 day moving average.
Incidentally, each move where percentages are listed coincided with a 3 standard deviation above its mean.
Today it makes for a marginal “even money” bet.
Let’s say that Gold extends itself to 80% above the 200 dma, thus taking it to $2,466 OR it decides to move lower to visit the “weekly” 200 dma of $1,370…..
So from today’s price, it’s either $530 per ounce upwards or $570 per to the downside.
Mean reversion does have its own gravitational pull.
August 20, 2020
by Rob Zdravevski
rob@karriasset.com.au