Gold and percentage extremes above its 200 day moving average
August 20, 2020 Leave a comment
Trying to hear what's not being said
About Rob Zdravevski
Global Investment Advisor & Portfolio Manager
Australian based, Global Work
rob@karriasset.com.au

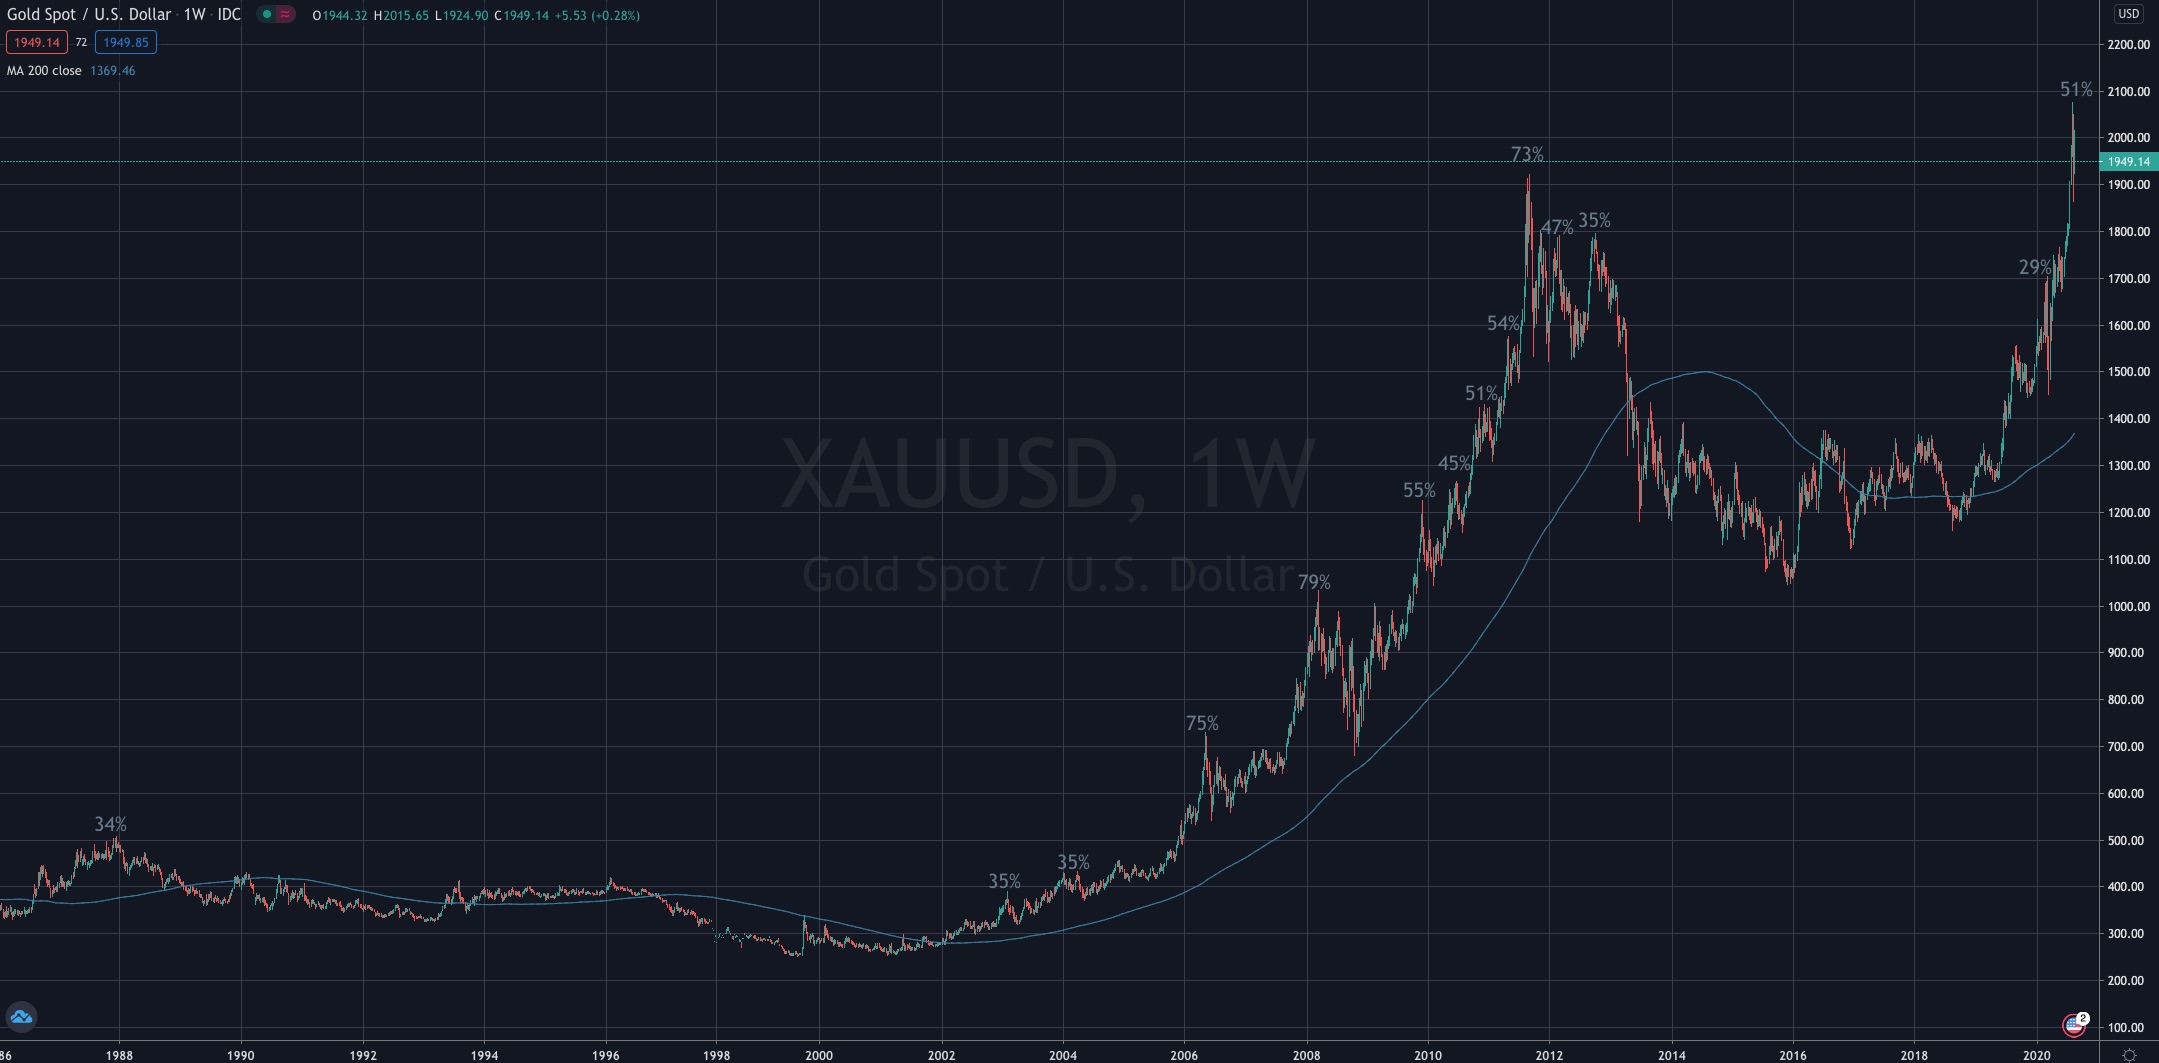
Below is a “weekly” 35 year chart of Gold and its rolling 200 day moving average.
At selected peaks, I have added the percentage that the Gold price was trading above its “weekly” 200 day moving average.
Incidentally, each move where percentages are listed coincided with a 3 standard deviation above its mean.
Today it makes for a marginal “even money” bet.
Let’s say that Gold extends itself to 80% above the 200 dma, thus taking it to $2,466 OR it decides to move lower to visit the “weekly” 200 dma of $1,370…..
So from today’s price, it’s either $530 per ounce upwards or $570 per to the downside.
Mean reversion does have its own gravitational pull.
August 20, 2020
by Rob Zdravevski
rob@karriasset.com.au