Seeing weakness in ASX 200

The bias for the ASX 200 is lower.

Combined with my other studies and analyses, it’s price action is filling me with conviction.

Much like the S&P 500 (as written in an earlier post today), the ASX 200 has been trend less over the past year.

While this post-mortem validates my opinion that it would be a stockpickers market, invariably this has also left passive, index huggers wondering why adequate returns haven’t been easy to come by.

In the price chart below, the ASX 200 is yet to break the high seen in late January 2023.

That high remains below the high registered almost 2 years ago, in August 2021.

Furthermore, the recent March 2023 low was lower than its January 2023 low.

And the recent peak of 7,391 was not higher than the early February 2023 high of 7,568.

So we have a series of lower highs and lower lows.

For a bunch of reasons, it’s not a market which suggests piling into.

Inversely, it’s not selling to short it either.

May 25, 2023

by Rob Zdravevski

rob@karriasset.com.au

S&P 500 – constructive but trend less

Amidst a trend less equities market, the good news is the S&P 500 is acting and trading constructively.

The low seen in March 2023 did not break the low seen in December 2022.

This past week, it made a recent ‘higher high’, when it traded at 4,213, which is above the 4,195 high seen in late January 2023.

In the interim, there is a ‘daily’ gap at 3,980 which I expect the S&P 500 to trade down to and ‘fill’.

That’s 3.3% below today’s closing price of 4,115.

The next ‘higher high’ that it needs to test is the August ’22 high of 4,325.

Although, this remains a market which I am ‘dating’ and not one that I’m ‘marrying’.

My notable, medium to longer term buying signals are nowhere to be seen.

May 25, 2023

by Rob Zdravevski

rob@karriasset.com.au

Nvidia in rare air again

The chart below shows the percentage that Nvidia (NVDA:US) is trading above its 200 week moving average.

In 2002 I wrote of Nvidia’s stretched price action and how mean reversion beckoned.

Then in his note below highlights the decline the stock should make as it was heading towards its 200 week moving average.

Since that mean reversion, we’ve seen another parabolic price move.

While it’s a stupendous result for those who accumulated the stock down near that $120 level, I’m miffed by the motivations of the buyers in today’s market with the stock in the $380 price region.

The law of large numbers also comes to mind as Nvidia approaches a market capitalisation of $800 billion.

Caveat Emptor !

May 25, 2023

by Rob Zdravevski

rob@karriasset.com.au

British Gilt yields at extremes

My latest edition (written every Sunday) of Macro Extremes said, “In this weeks list, the British 10’s entered an overbought territory while the other 2, 3 and 5 year durations are nearly doing the same.”

And so during this current week we are now seeing the British government bond yields across 2, 3 and 5 year maturities trading at 2.5 standard deviations above their rolling weekly mean.

May 24, 2023

by Rob Zdravevski

rob@karriasset.com.au

Macro Extremes (week ending May 19, 2023)

A weekly Macro, Cross Asset review of prices trading at extremes which may generate future investment ideas and opportunities.

The following assets (on a weekly timeframe) registered an Overbought or Oversold reading and/or have traded more than 2.5 standard deviations above or below its rolling mean.

Extremes “above” the Mean (at least 2.5 standard deviations)

British 10 year government bond yields

Overbought (RSI > 70)

Australian 3 month bank bill yield (90 day swap rate)

U.S. 3 month government bond yield

Cocoa

The Overbought Quinella – Both Overbought and Traded at > 2.5 standard deviations above the weekly mean)

Nikkei 225

Extremes “below” the Mean (at least 2.5 standard deviations)

China 10 year government bond yields 

Copper

Oversold (RSI < 30)

JKM LNG Gas

Lithium Hydroxide 

KRE Regional Bank Index

ZAR/USD

The Oversold Quinella – Both Overbought and Traded at > 2.5 standard deviations above the weekly mean)

Corn

Soybeans

Notes & Ideas:

Equities showed life following weeks of sideways travel. The moves can’t be described nor confirmed as a new trend or the ‘rip’ higher, the latter being something I have written to clients about recently.

While it’s worthy to note many equities markets are yet make any type of ‘higher high’.

The KBW Bank index rose 6% for the week, more than reversing last weeks 3.5% decline and it’s no longer oversold.

While last weeks bearish outside reversal seen in South Korea and Taiwan didn’t materialise into weakness.

For the week, the ASX 200 rose 0.3% and the ASX Small Caps fell 0.9%.

Government bond yields generally rose, except for Türkiye’s.

In this weeks list, the British 10’s entered an overbought territory while the other 2, 3 and 5 year durations are nearly doing the same.

And the U.S. 5 year bond yield minus U.S. 3 month bond yield isn’t oversold this week.

Commodities were broadly higher with energy generally faring well while the ‘softs’ (agriculturals) suffered the largest declines along with Tin and Nickel.

Sugar is no longer overbought nor is Gold as it is priced in AUD.

Australian Coking Coal is closing in on its 200 week moving average.

JKM LNG continues to close at its lowest point in 3 years and Heating Oil broke its 7 week losing streak.

Currencies 

We saw the AUD mixed, the EUR slightly weaker while the USD broadly firmed.

The USD/JPY is edging towards an overbought extreme.

The larger advancers over the past week comprised of;

Cocoa 2.8%, Aluminium 2.8%, WTI Crude 2.4%, Iron Ore 3.3%, Gasoil 3%, Heating Oil 2.5%, Coffee 5%, Lithium 3.7%, Natural Gas 14.1%, Orange Juice 6.4%, Gasoline 6%, CRB Index 1.6%, Cotton 7.7%, Brent Crude 2.2%, AEX 1.9%, KBW Bank Index 5.8%, DAX 2.3%, BOVESPA 2.1%, Nasdaq Composite 3%, KOSPI 2.5%, Nasdaq 100 3.5%, Nikkei 4.8%, Stockholm 2.3%, Russell 2000 2%, S&P Small Cap 600 2.4%, SOX 7.8%, S&P 1.7%, TAIEX 4.3% and the KRE Regional Bank Index soared 7.8%.

The group of decliners included;

Baltic Dry Index (11.2%), JKM LNG (11.5%), Tin (5.2%), Nickel (4.3%), Sugar (1.7%), Dutch TTF (7.9%), Gold in AUD (1.8%), Gold in CAD (2%), Corn (5.4%), Oats (3.9%), Rice (7.7%), Soybeans (6%), Wheat (4.7%), Lumber (1.8%) and Thailand’s SET Index fell 3%.

May 21, 2023

by Rob Zdravevski

rob@karriasset.com.au 

Aussie interest rates are stretched and peaking

The study below suggests Australian interest rates will decline over the coming 8 – 15 months.

The circles denotes moments when the Australian government 2 year bond yield simultaneously trades 2.5 standard deviations above its rolling weekly mean, registers a weekly overbought reading and most importantly, it is at a certain extended percentage above its 200 week moving average.

When this event occurs, the probability of mean reversion heightens.

Such an event has only occurred 6 times over the past 35 years.

It highlights a moment when investors may consider allocating a higher proportion of monies towards bonds or fixed income or perhaps locking rates for their cash or term deposits.

Furthermore, borrowers should ponder leaving staying flexible and variable with their interest rates. In other words, you should have a chance to fix rates at lower levels in the months ahead.

For equity investors, moderating interest rates will provide their own trades and opportunities.

Just for kicks, I’ve place the Australian inflation rate (in orange) to show the symbiotic dance it does with the direction of interest rates.

May 19, 2023

by Rob Zdravevski

rob@karriasset.com.au

Understand FX and credit first

I often write about currencies and bonds because I think it’s important to study and understand those markets before one understands equities.

I believe what the currency and credit markets say before I believe what the equity market is telling me.

The equity market is where the most stories are being told and where dreams are being sold.

Watch out for ‘rips’

While I have a broader cautious stance on equities, my current read of the tape suggests equities could ‘rip’ higher…..but be careful.

It’s tricky as it’s not from a notable low and it’s a trading market.

I’ll be watching whether various currency crosses (such as the AUD/JPY) break higher thus confirming an increase in risk appetite.

Also, the AUD/USD is firming but I need a couple nuances to tip over to confirm a move higher.

The S&P 500 weak upward trend (and it’s yet to make a higher high) is juxtaposed against the strength seen in the Nasdaq 100’s trend.

While the Russell 2000, Mid Caps, Small Caps and Copper are in a down trend with all of them a whisker away from those trends confirming strength.

Incidentally, the ASX 200 is yet to make a higher high than the 7,625 seen in April 2022.

Invariably, at moments like this, markets move to where they can do the most damage….and that could be up…but be careful.

I think that the upcoming 2-3 weeks warrant unusual attention.

May 15, 2023

by Rob Zdravevski

rob@karriasset.com.au

Macro Extremes (week ending May 12, 2023)

A weekly Macro, Cross Asset review of prices trading at extremes which may generate future investment ideas and opportunities.

The following assets (on a weekly timeframe) registered an Overbought or Oversold reading and/or have traded more than 2.5 standard deviations above or below its rolling mean.

Extremes “above” the Mean (at least 2.5 standard deviations)

Turkish 10 year government bond yields

China Coal

Chilean equity index

Overbought (RSI > 70)

Australian 3 month bank bill yield (90 day swap rate)

U.S. 3 month government bond yield

Sugar

Gold (in AUD)

The Overbought Quinella – Both Overbought and Traded at > 2.5 standard deviations above the weekly mean)

None

Extremes “below” the Mean (at least 2.5 standard deviations)

China 10 year government bond yields 

Copper

Soybeans

EUR/GBP

Oversold (RSI < 30)

U.S. 5 year bond yield minus U.S. 3 month bond yield

JKM LNG Gas

Lithium Hydroxide 

Urea (Middle East)

KBW Banking Index

KRE Regional Bank Index

The Oversold Quinella – Both Overbought and Traded at > 2.5 standard deviations above the weekly mean)

ZAR/USD

Notes & Ideas:

Equities were muted again for another week with weaker prices being amongst the majority, with Chinese equities, U.S. banks and small caps leading the way lower.

For instance, the U.S. Russell 2000 and Small Caps fell 1.3% and 1.9% respectively, while the S&P 500 rose 0.3% and the Dow Jones Industrials retreating 1.1%

The KBW Bank index fell 3.5% for the week, extending last week’s 7% decline, while the KRE Index (which tracks the regional U.S. banks) is closing in on a monumental low mimicking what was last seen in 2020 and in 2009. Incidentally, the KRE has tanked 46% in the past 3 weeks.

Something to watch are bearish outside reversal weeks seen in South Korea and Taiwan.

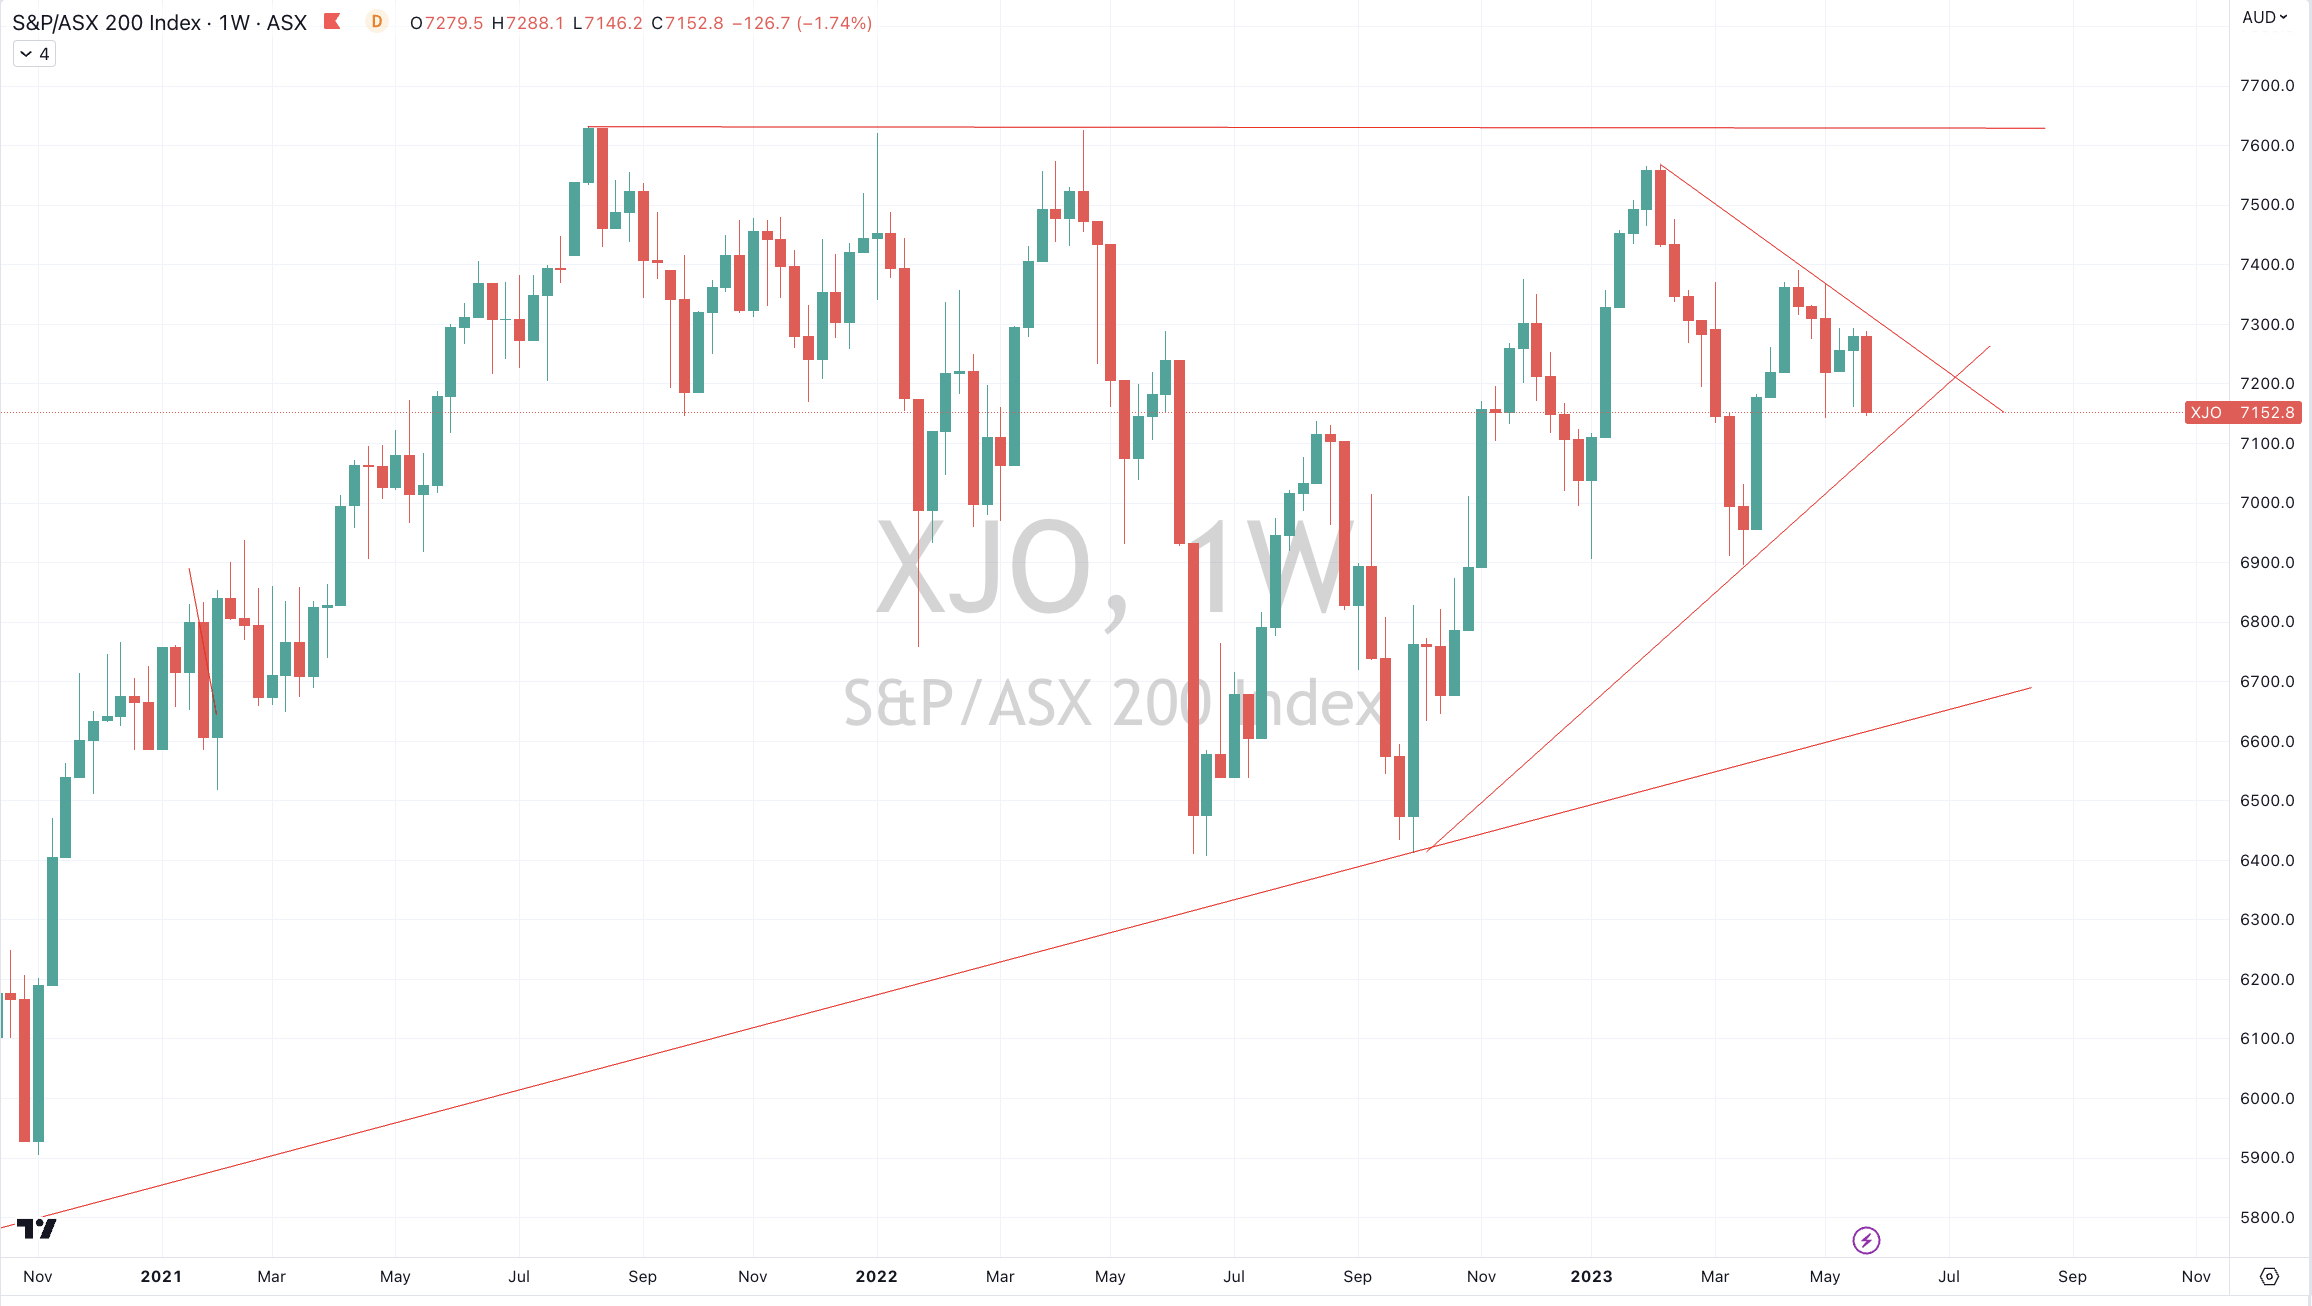
For the week, the ASX 200 rose 0.5% and the ASX Small Caps advanced 0.6%.

Overall, we remain in a trend less equity markets.

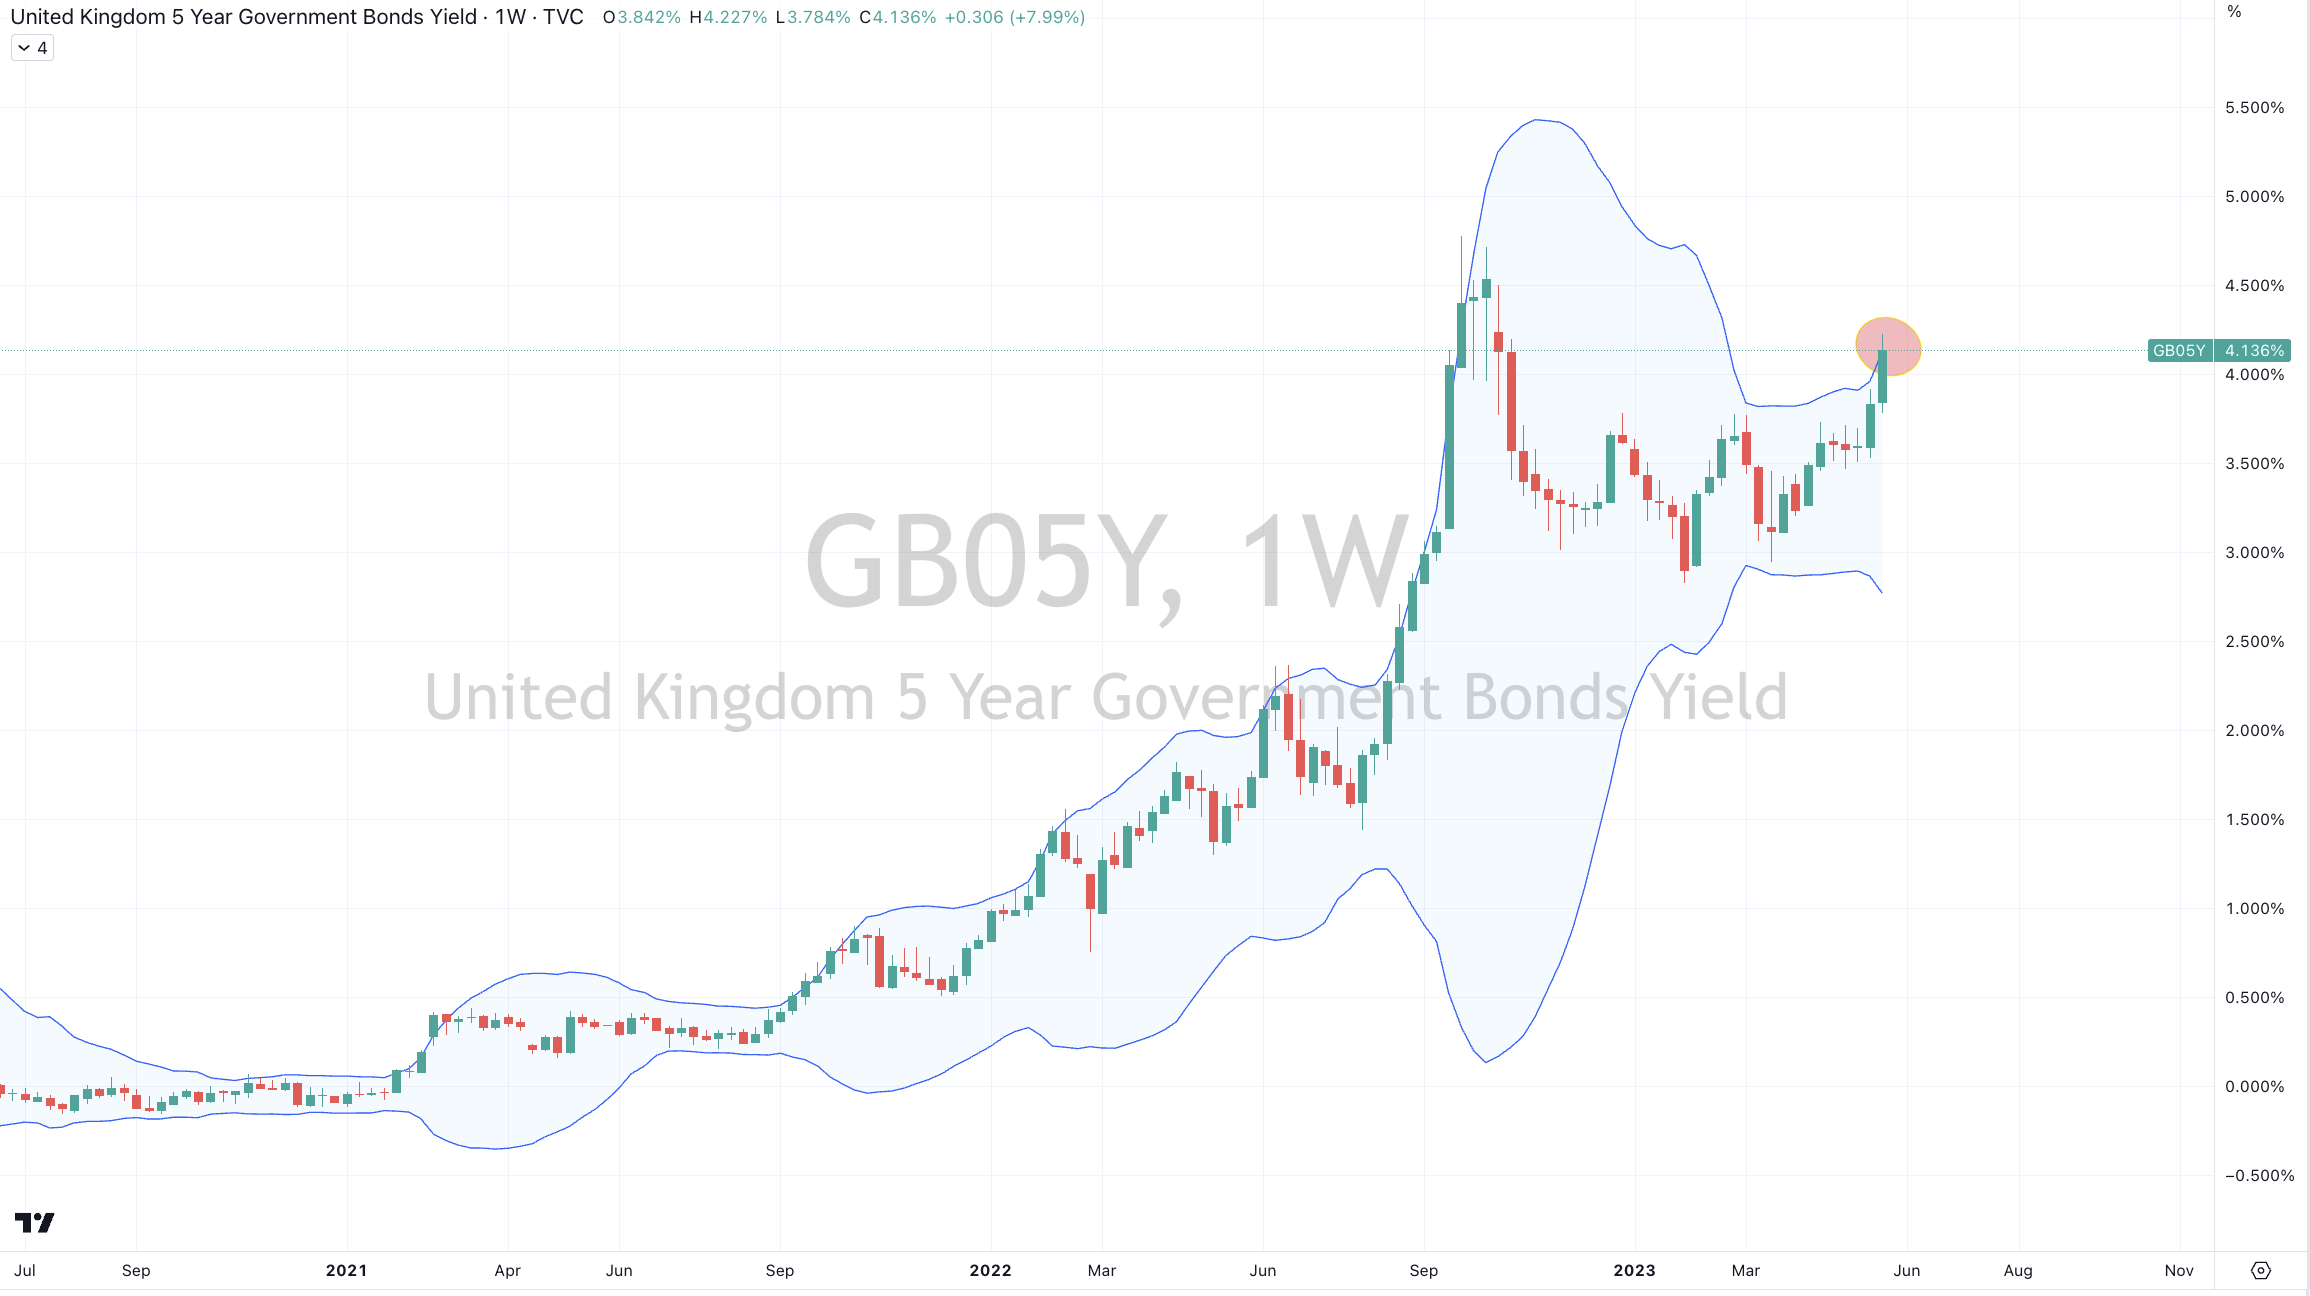
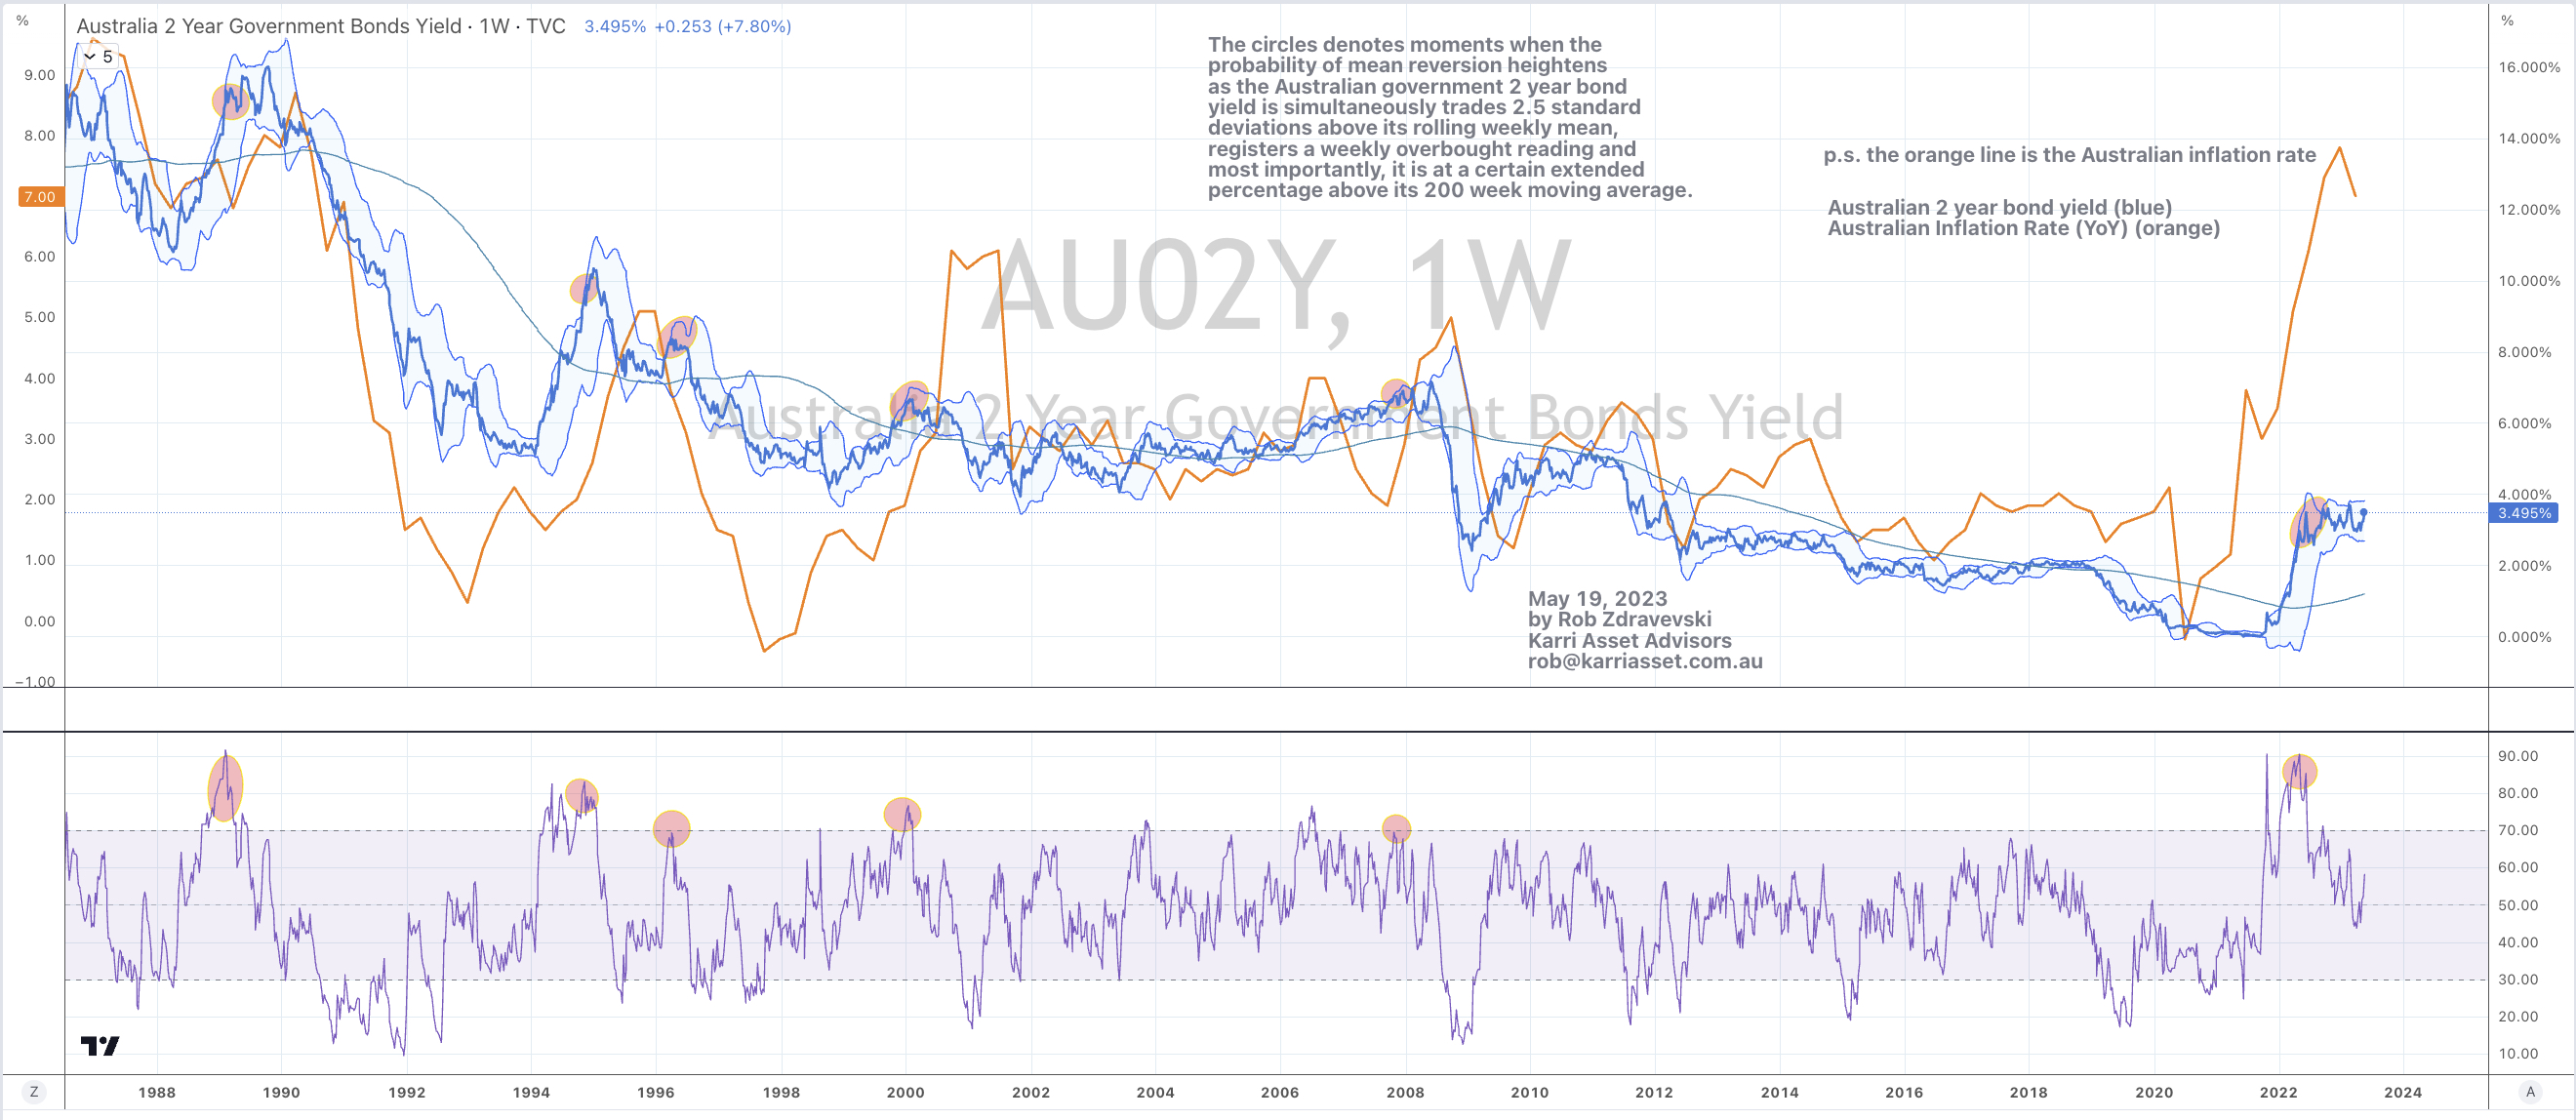
Government bond yields were generally quiet.

While many rose slightly (except in Brazil), many of those yields made intra-week low’s which were lower than last week’s low. 

The U.S. 5 year bond yield minus U.S. 3 month bond yield spread (or yield curve) is still Oversold, which means something and a reminder that the Aussie 5 year minus 3 month yield spread is in negative territory. 

Action in Commodities was a mixed bag, although the more notables moves were seen amongst the decliners.

Copper, Orange Juice (remember they were Overbought recently), Coal, Nickel and Lumber were some of the larger losers for the week.

Silver is no longer overbought as it fell 5%.

Rotterdam delivered Coal is closing in on a notable low.

Oil and some of the agricultural commodities moved out of oversold extreme territory 

The Copper/Gold Ratio made a lower low (cite: May 4, ’23 Sell Copper note) and as it approaches a certain point, Selling Gold/Buying Copper may be a suggested trade.

JKM LNG closed at its lowest point in 3 years.

Heating Oil’s losing weekly streak extends to 7 while Lithium broke its 11 week losing streak

Currencies are seeing a couple new entrants in the weekly list with the ZAR/USD cross not visiting the ‘extremes’ for some time.

GBP/USD made a outside bearish reversal week a did EUR/USD.

The USD/SGD registered an outside bullish week which suggests weakness for the Singapore Dollar.

The larger advancers over the past week comprised of;

Cocoa 1.8%, China Coal 1.8%, Iron Ore 2.4%, Lean Hogs 11.4%, Lithium 3.2%, Natural Gas 6%, Palladium 1.8%, Gasoline 2.2%, Urea U.S. Gulf 4.2%, Oats 1.9%, BOVESPA 3.2%, SET 1.8%, Chile 2.1% and Copenhagen’s OMX soared 3.6%

The group of decliners included;

Australian Coking Coal (3.1%), Aluminium (3.9%), Rotterdam Coal (6.1%), WTI Crude (1.8%), Copper (4%), JKM LNG (1.8%), Coffee (2.8%), Lumber (5.4%), Tin (2.6%), Nickel (6.9%), Orange Juice (10.1%), Cotton (4%), Dutch TTF Gas (10.4%), Urea Middle East (3.5%), Silver in AUD (5%), Silver in USD (6.6%), Corn (1.7%), Soybeans (3.2%), Wheat (3.8%), Shanghai (1.9%), CSI 300 (2%), KBW Banks (3.5%), KRE Banks (5.2%), DJ Transports (2.4%), Hang Seng (2.1%), HSCEI (2%), S&P 600 Small Caps (1.9%) and Singapore’s Strait Times fell 1.8%.

May 14, 2023

by Rob Zdravevski

rob@karriasset.com.au 

Waiting and Patience – a newsletter