Nvidia in rare air again
May 25, 2023 Leave a comment
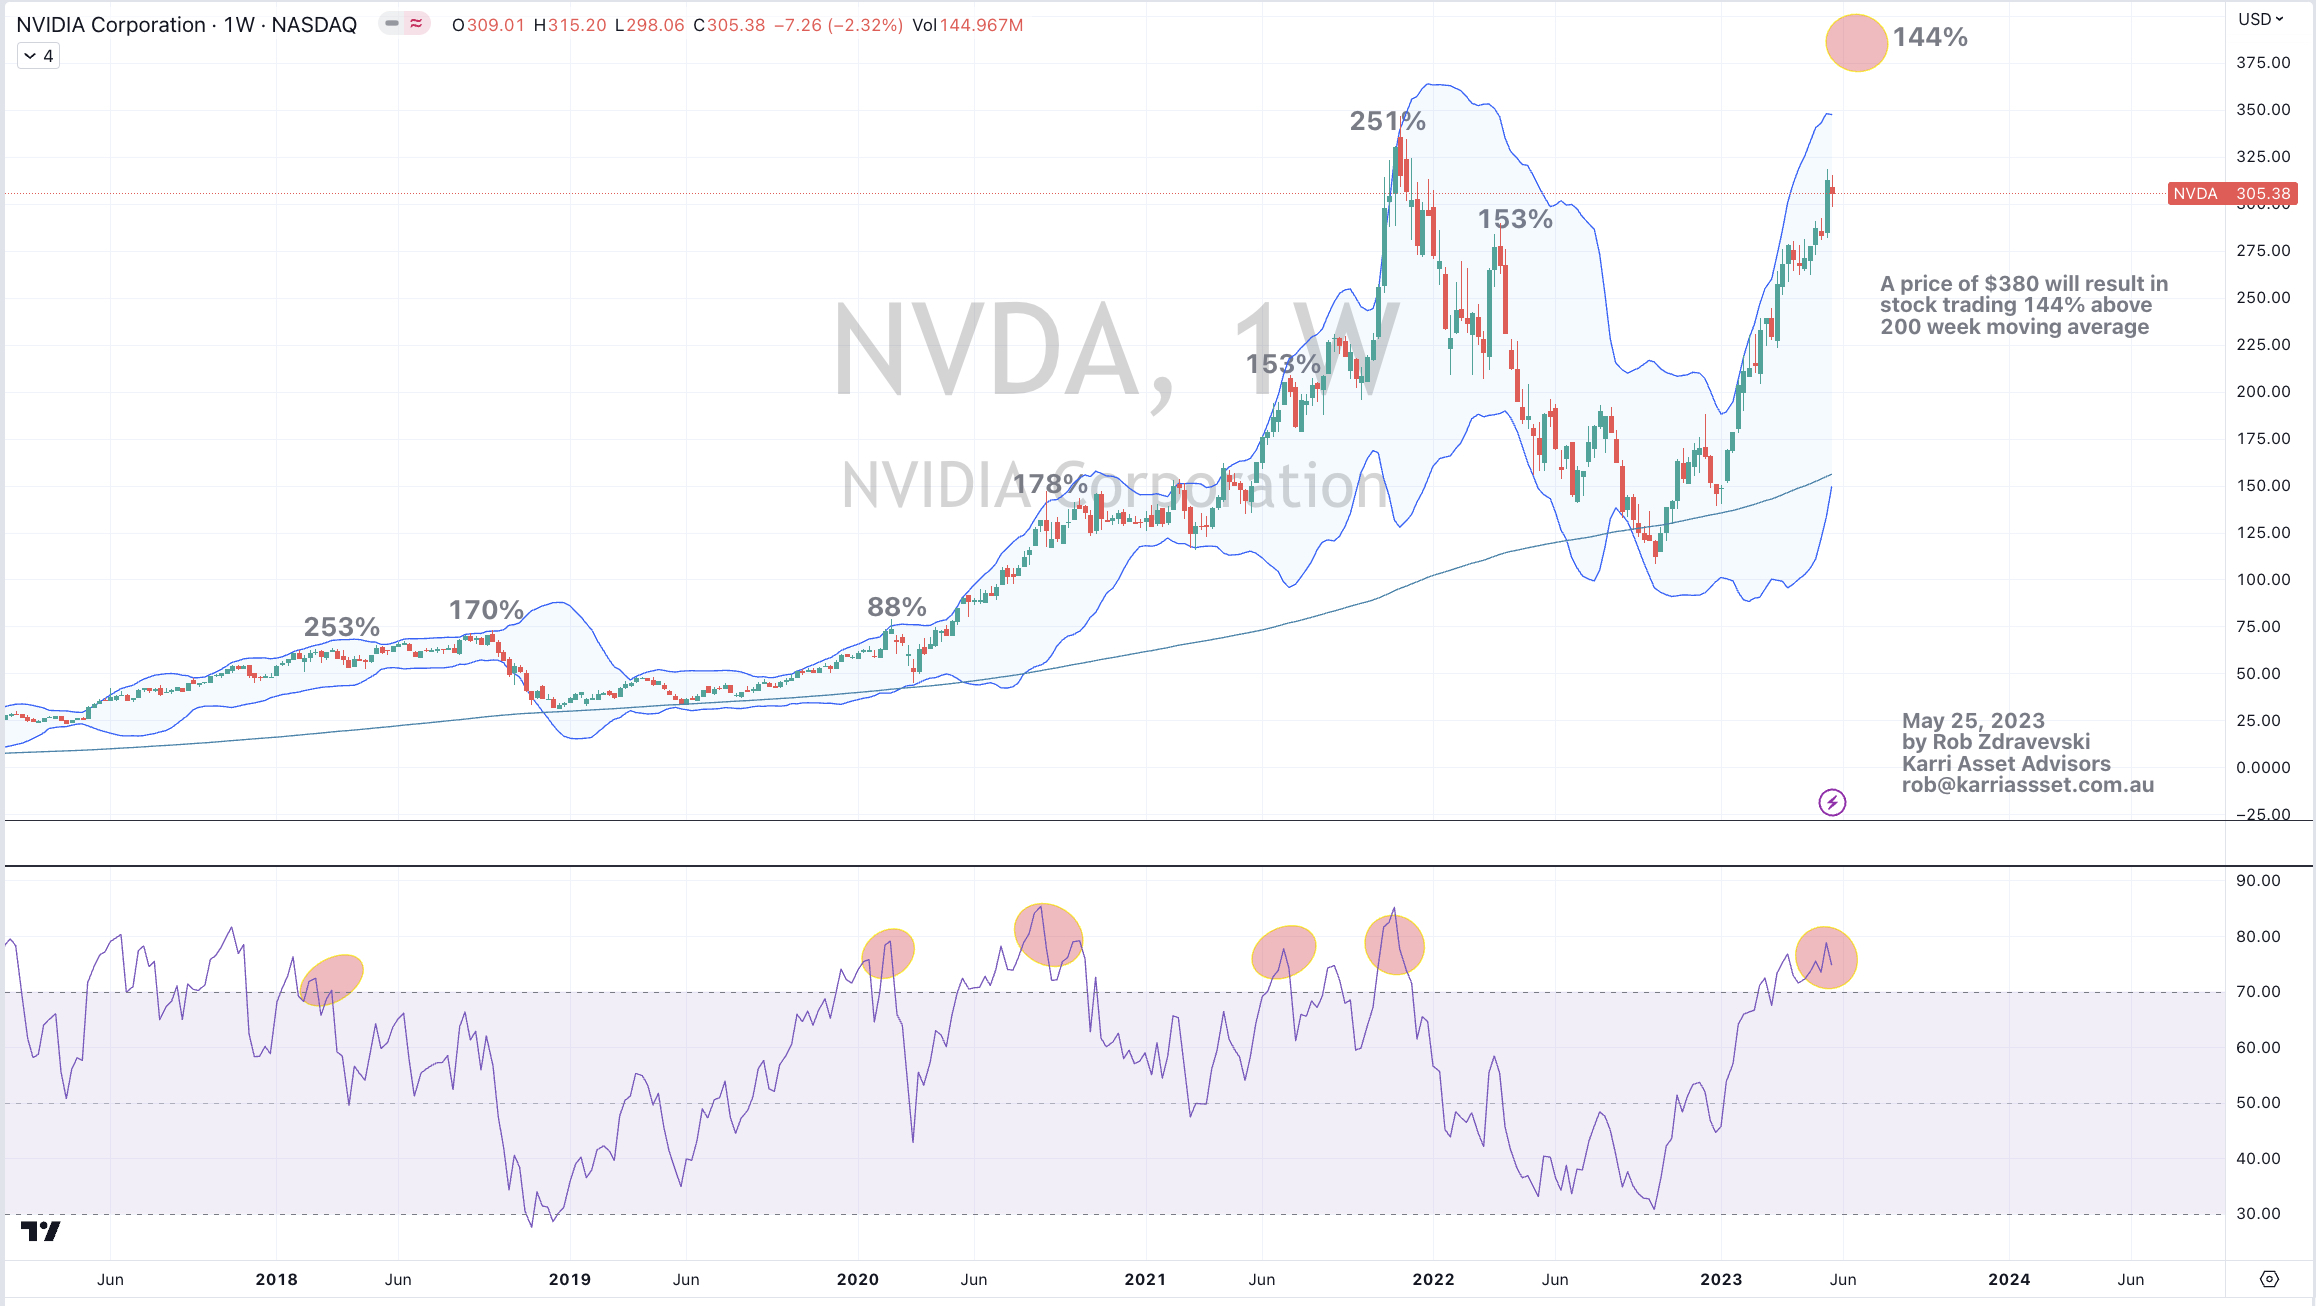
The chart below shows the percentage that Nvidia (NVDA:US) is trading above its 200 week moving average.
In 2002 I wrote of Nvidia’s stretched price action and how mean reversion beckoned.
Then in his note below highlights the decline the stock should make as it was heading towards its 200 week moving average.
Since that mean reversion, we’ve seen another parabolic price move.
While it’s a stupendous result for those who accumulated the stock down near that $120 level, I’m miffed by the motivations of the buyers in today’s market with the stock in the $380 price region.
The law of large numbers also comes to mind as Nvidia approaches a market capitalisation of $800 billion.
Caveat Emptor !
May 25, 2023
by Rob Zdravevski
rob@karriasset.com.au