A weekly Macro, Cross Asset review of prices trading at extremes which may generate future investment ideas and opportunities.
The following assets (on a weekly timeframe) either registered an Overbought or Oversold reading and/or have traded more than 2.5 standard deviations above or below its rolling mean.
Extremes “above” the Mean (at least 2.5 standard deviations)
Australian 2 year government bond yields
Russian and Turkish 10 year government bond yields
Australian 10 year yield minus U.S. 10 year yield
Rice
Istanbul equity index
Philadelphia Semiconductor Index (SOX)
Overbought (RSI > 70)
U.S. 3 month government bond yield
Russia’s MOEX index
Nasdaq 100
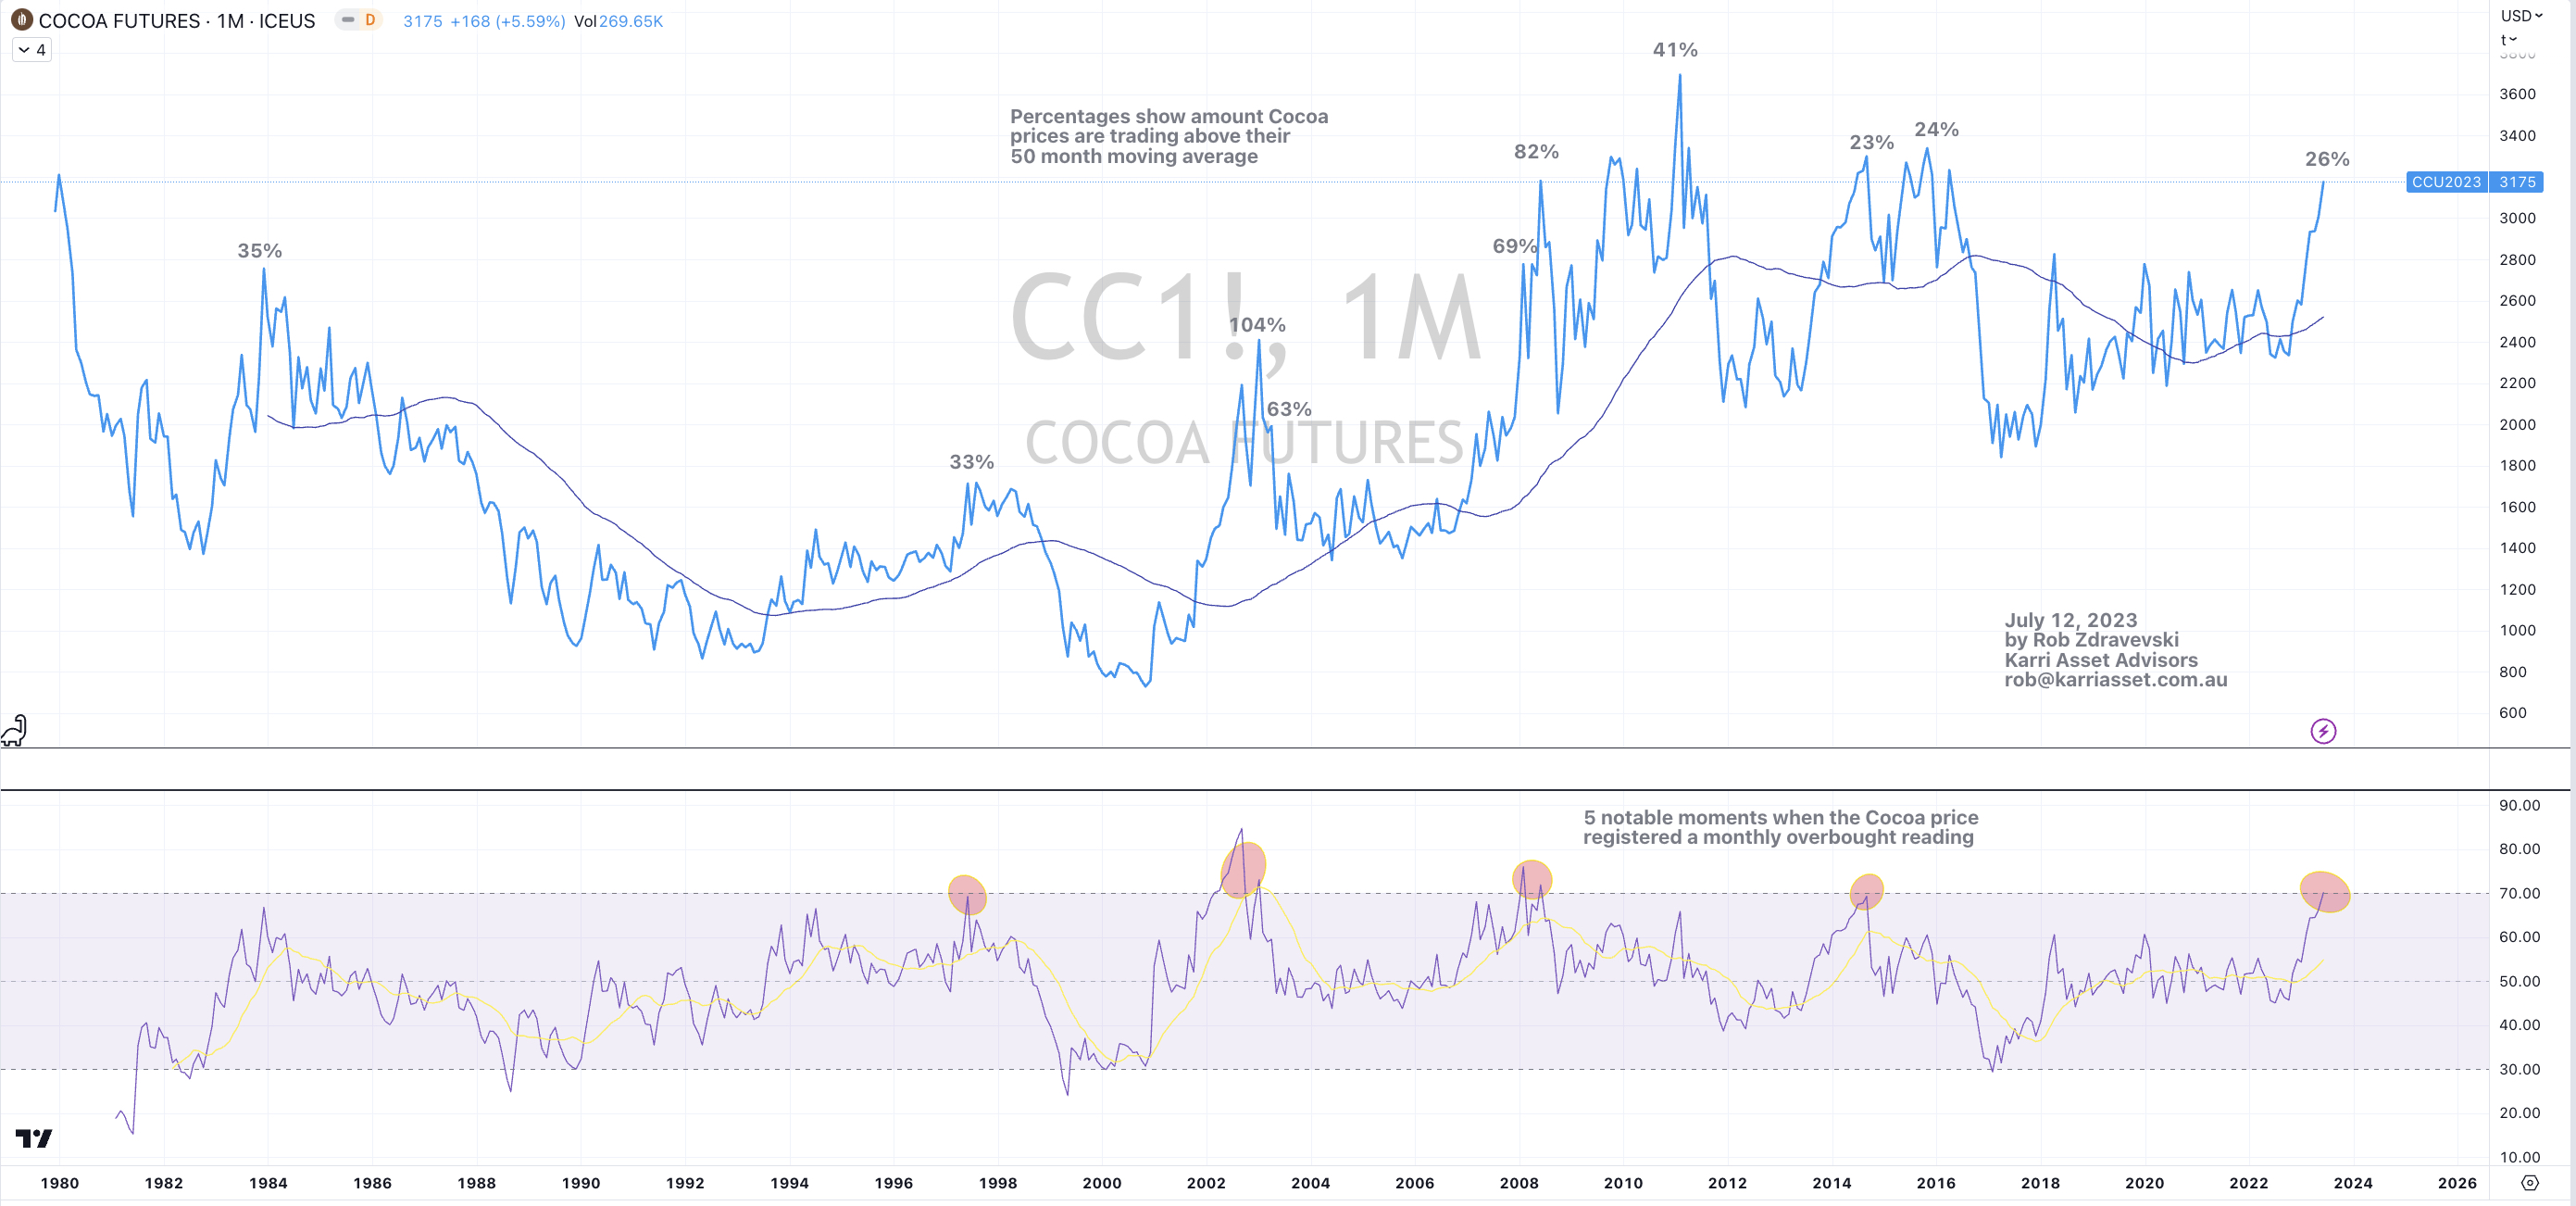
Cocoa
The Overbought Quinella – Both Overbought and Traded at > 2.5 standard deviations above the weekly mean)
British 2 year government bond yields
Taiwan’s TAEIX Index
Nikkei 225
Uranium
Cattle
Extremes “below” the Mean (at least 2.5 standard deviations)
U.S. 10 year bond yield minus Australian 2 year bond yield
U.S. 10 year bond yield divided by Australian 2 year bond yield
Shanghai equity index
CSI 300 equity index
EUR/GBP
Oversold (RSI < 30)
LNG Japan Korea Marker (JKM)
Lithium Hydroxide
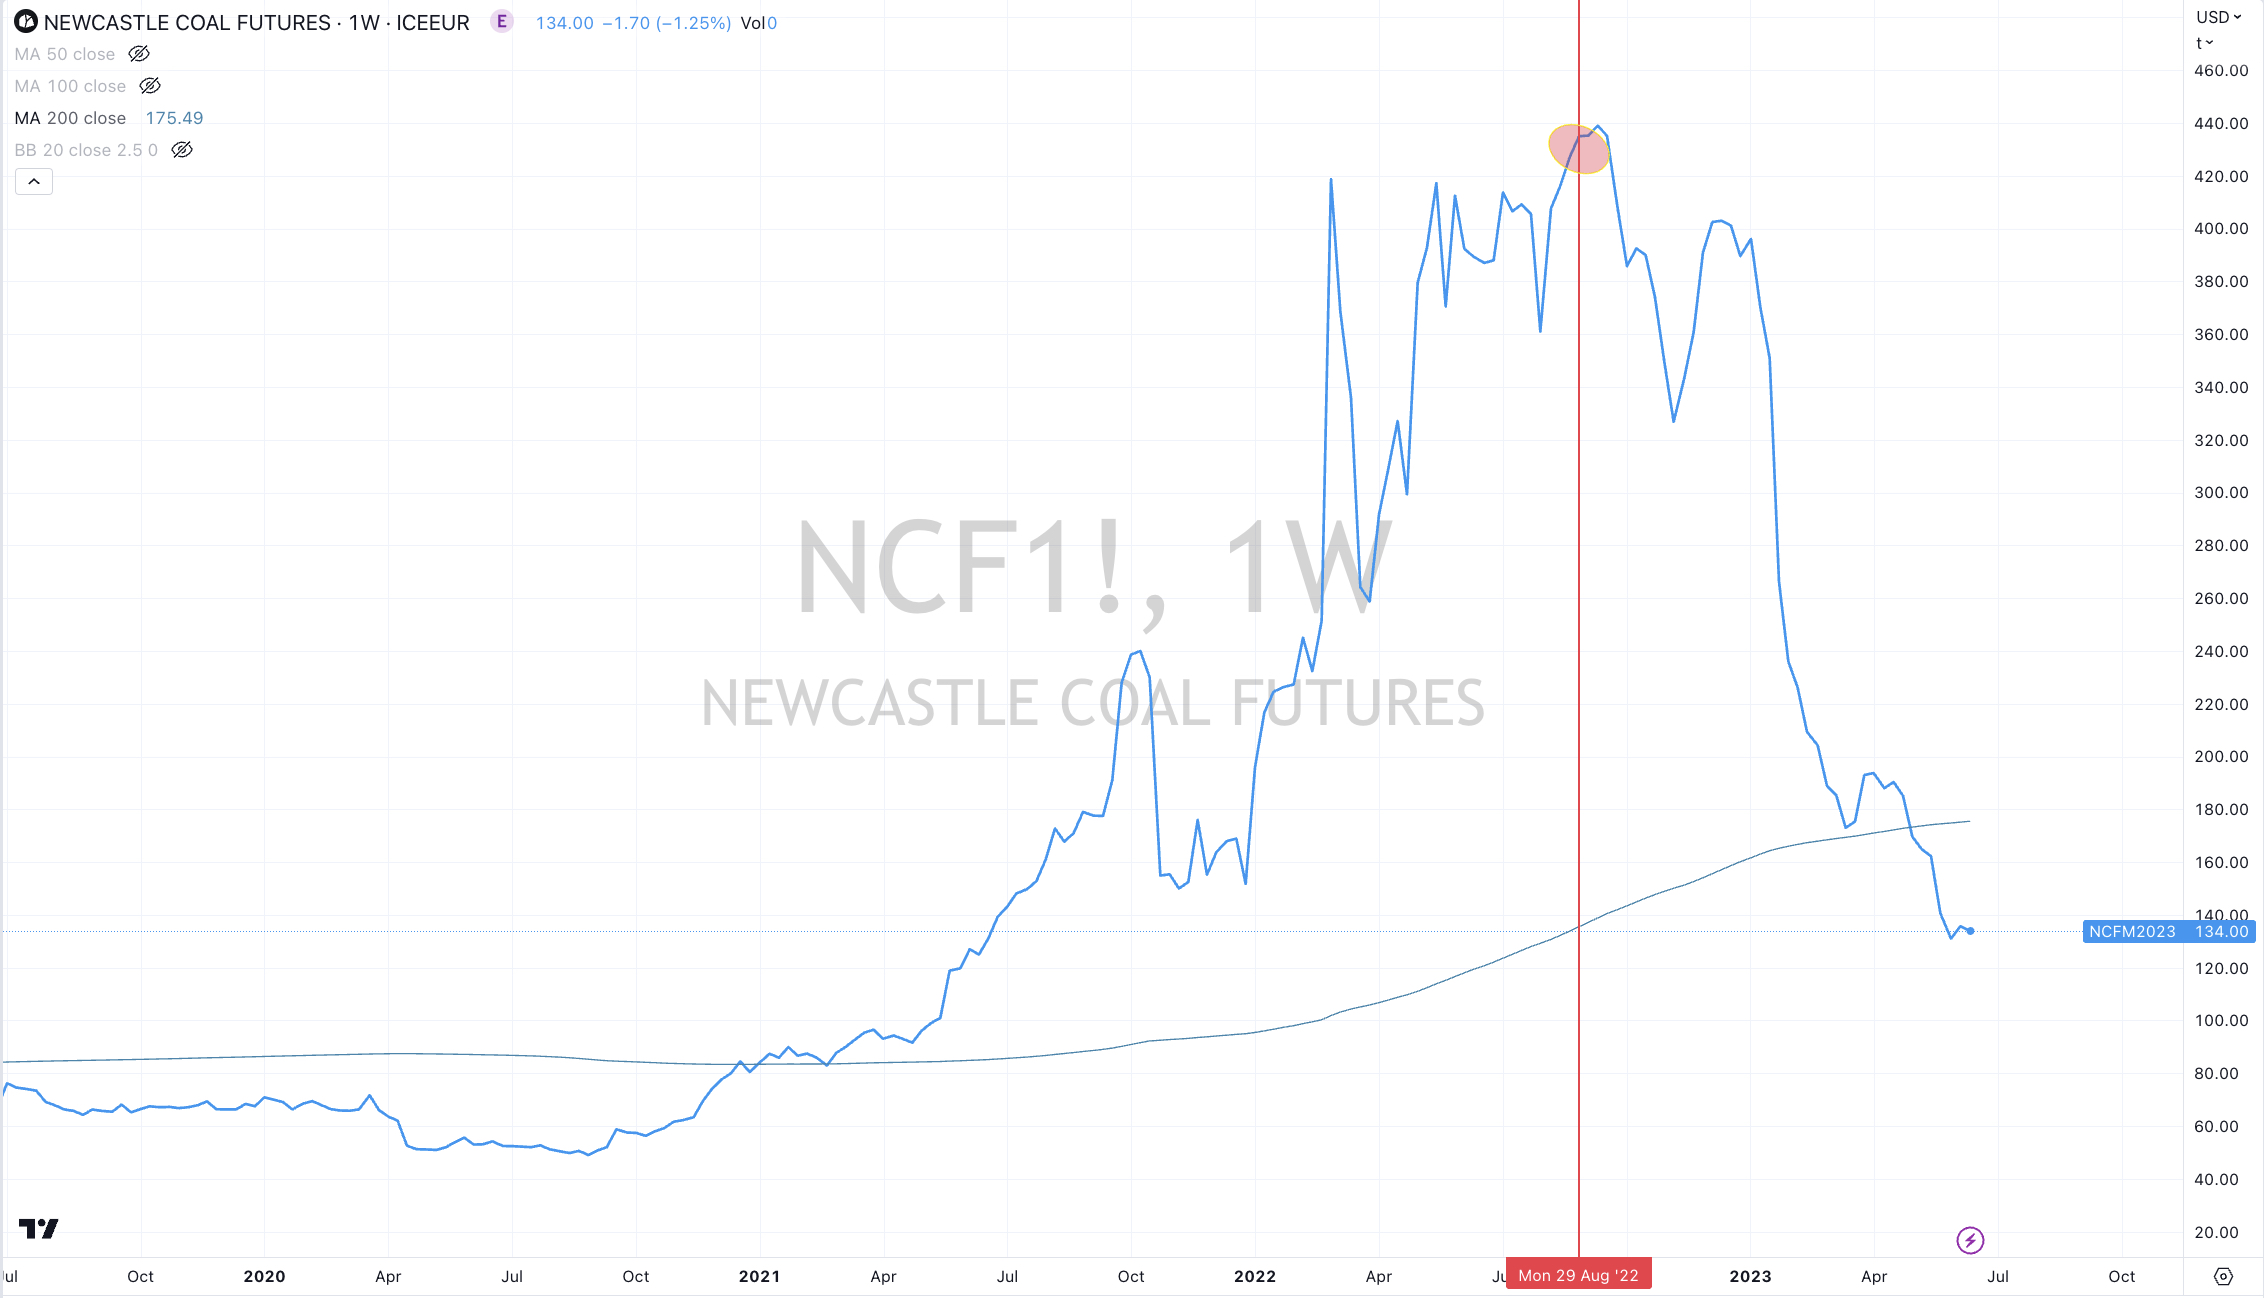
Newcastle Coal
Urea (both U.S. Gulf and Middle East prices)
The Oversold Quinella – Both Oversold and Traded at < 2.5 standard deviations below the weekly mean)
Australian 10 year minus 2 year bond yield spread
Notes & Ideas:
Equities were generally higher. We saw some rotation towards mid and smaller caps although major indices didn’t perform as much as was portrayed in the media.
For instance, the Dow Jones Industrials firmed 0.4%, the S&P 500 climbed 0.4%, DJ Transports advanced 0.7%, Nasdaq Composite eeked 0.1% higher while the S&P MidCap 400 and SmallCap 600 both rose 1.4%.
While the Nasdaq 100 eased 0.1%, Toronto’s TSX fell 0.7% and the ASX 200 and ASX Small Caps fells 0.3% and 1.2% respectively.
Incidentally, the Russell 2000 has risen 5.1% in the past 2 weeks.
In other observations, Brazil’s Bovespa and South Korea’s Kospi are nearing overbought levels, the Nasdaq 100 broke its 6 weeks winning streak, Japan’s Nikkei 225 extends its consecutive weekly rising streak to 9 weeks.
Government bond yields rose except for Brazil and Greece, both whose yields are approaching oversold readings.
In this week’s list, we are seeing some obscure bond yield spreads feature.
The Australian 2 year and 3 year bond yields are enjoying a 6 week winning streak while they are also making ‘higher highs’. Government bond yields in the U.S. and Europe are not.
The Australian 10 year minus 2 year bond yield spread continued being oversold. This week was its lowest close since August 2008.
The U.S. 3 month yield closed a little lower at 5.27% taking a breather from a 6 week run which saw the yield climb from 4.47% to 5.38%.
Commodities were mixed but I’ll say mostly contained as prices seem to be consolidating and Bollinger Bands narrowing and converging.
The bigger moves were amongst those bouncing off extremes such as some of the gas contracts.
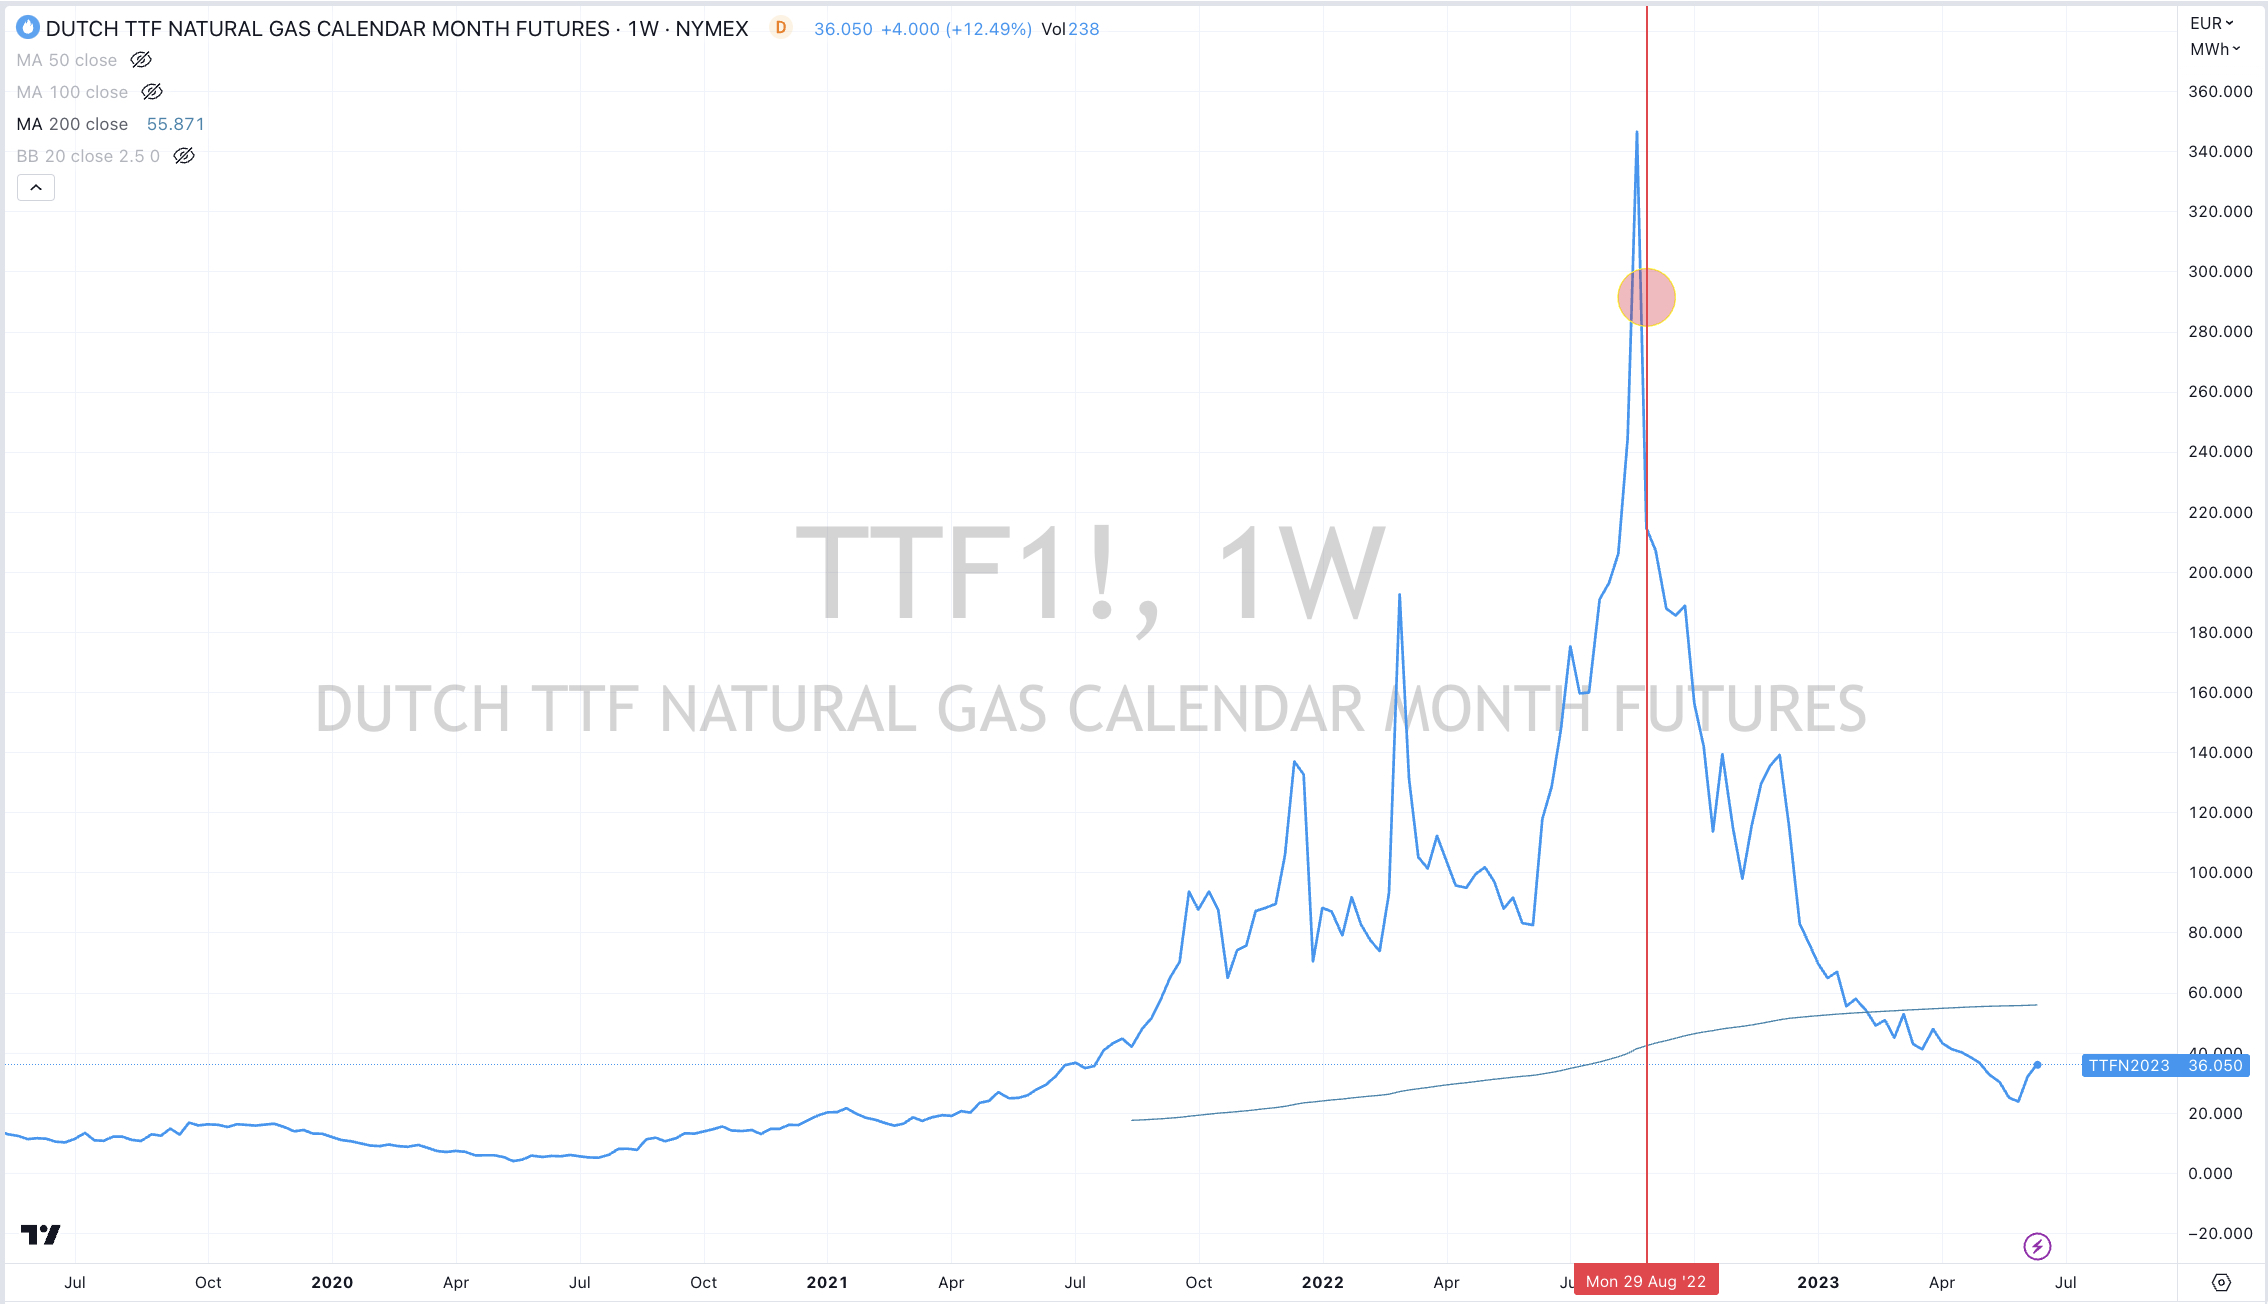
Rotterdam delivered Coal (rose 15%), Dutch TTF Gas (soared 35%) and Soybeans are no longer oversold.
While Cocoa and Cattle are trading in rarefied air. The latter is trading at all-time highs.
Rice bubbled 11% higher over the past 2 weeks.
Most of the softs were stronger while Crude Oil eased 2%.
The JKM LNG contract remains close at its lowest point in 3 years.
The Baltic Dry Index rose 15% making make some of the 49% lost over the past 4 weeks and breaking a similar losing streak.
Sugar broke its 5 week losing streak with an outside bullish reversal, Uranium racks up 8 straight weeks of gains and Palladium is nearly oversold.
In Currencies the AUD was firmer again, rising nearly an average of 1.5% against all FX crosses. The offshore Chinese renminbi (vs USD) is nearing oversold levels as it completes its 6th consecutive losing week.
The South African Rand has rallied 5% over the past 2 weeks and is no longer oversold.
The larger advancers over the past week comprised of;
Rotterdam Coal 14.8%, Baltic Dry Index 14.8%, Cocoa 4.9%, Coffee 3.5% (though dropped 4.2% on Friday), Lumber 6.1%, Newcastle Coal 3.6%, Natural Gas 3.9% (after Friday’s decline of 4.2% halved the weeks gains), Gasoline 3.7%, Sugar 2.6%, Lithium 2.8%, Dutch TTF Gas 35.3% (rising 19% on Friday alone), Uranium 2.6%, Silver in USD 2.8%, Oats 6.2%, Rice 7.6%, Soybean 2.5%, Wheat 1.8%, KBW Bank Index 2.3%, HSCEI 2.5%, Hang Seng 2.3%, BOVESPA 4%, KOSPI 1.5%, Nikkei 225 2.3%, Russell 2000 1.9%, Istanbul 10.7%, Jakarta 3.2%, Mexico 2.4% and KRE Regional Bank Index rose 3% making its 4 week return reach 18%.
The group of decliners included;
Aluminium (3.1%), WTI Crude Oil (2.1%), Iron Ore (3.2%), Orange Juice (7.8%), Palladium (7.4%), Cotton (2.3%), Brent Crude Oil (1.7%), Corn (2.1%) and Switzerland’s SMI Index declined 1.7%.
June 11, 2023
by Rob Zdravevski
rob@karriasset.com.au