Vamos, IBEX
March 29, 2024 Leave a comment
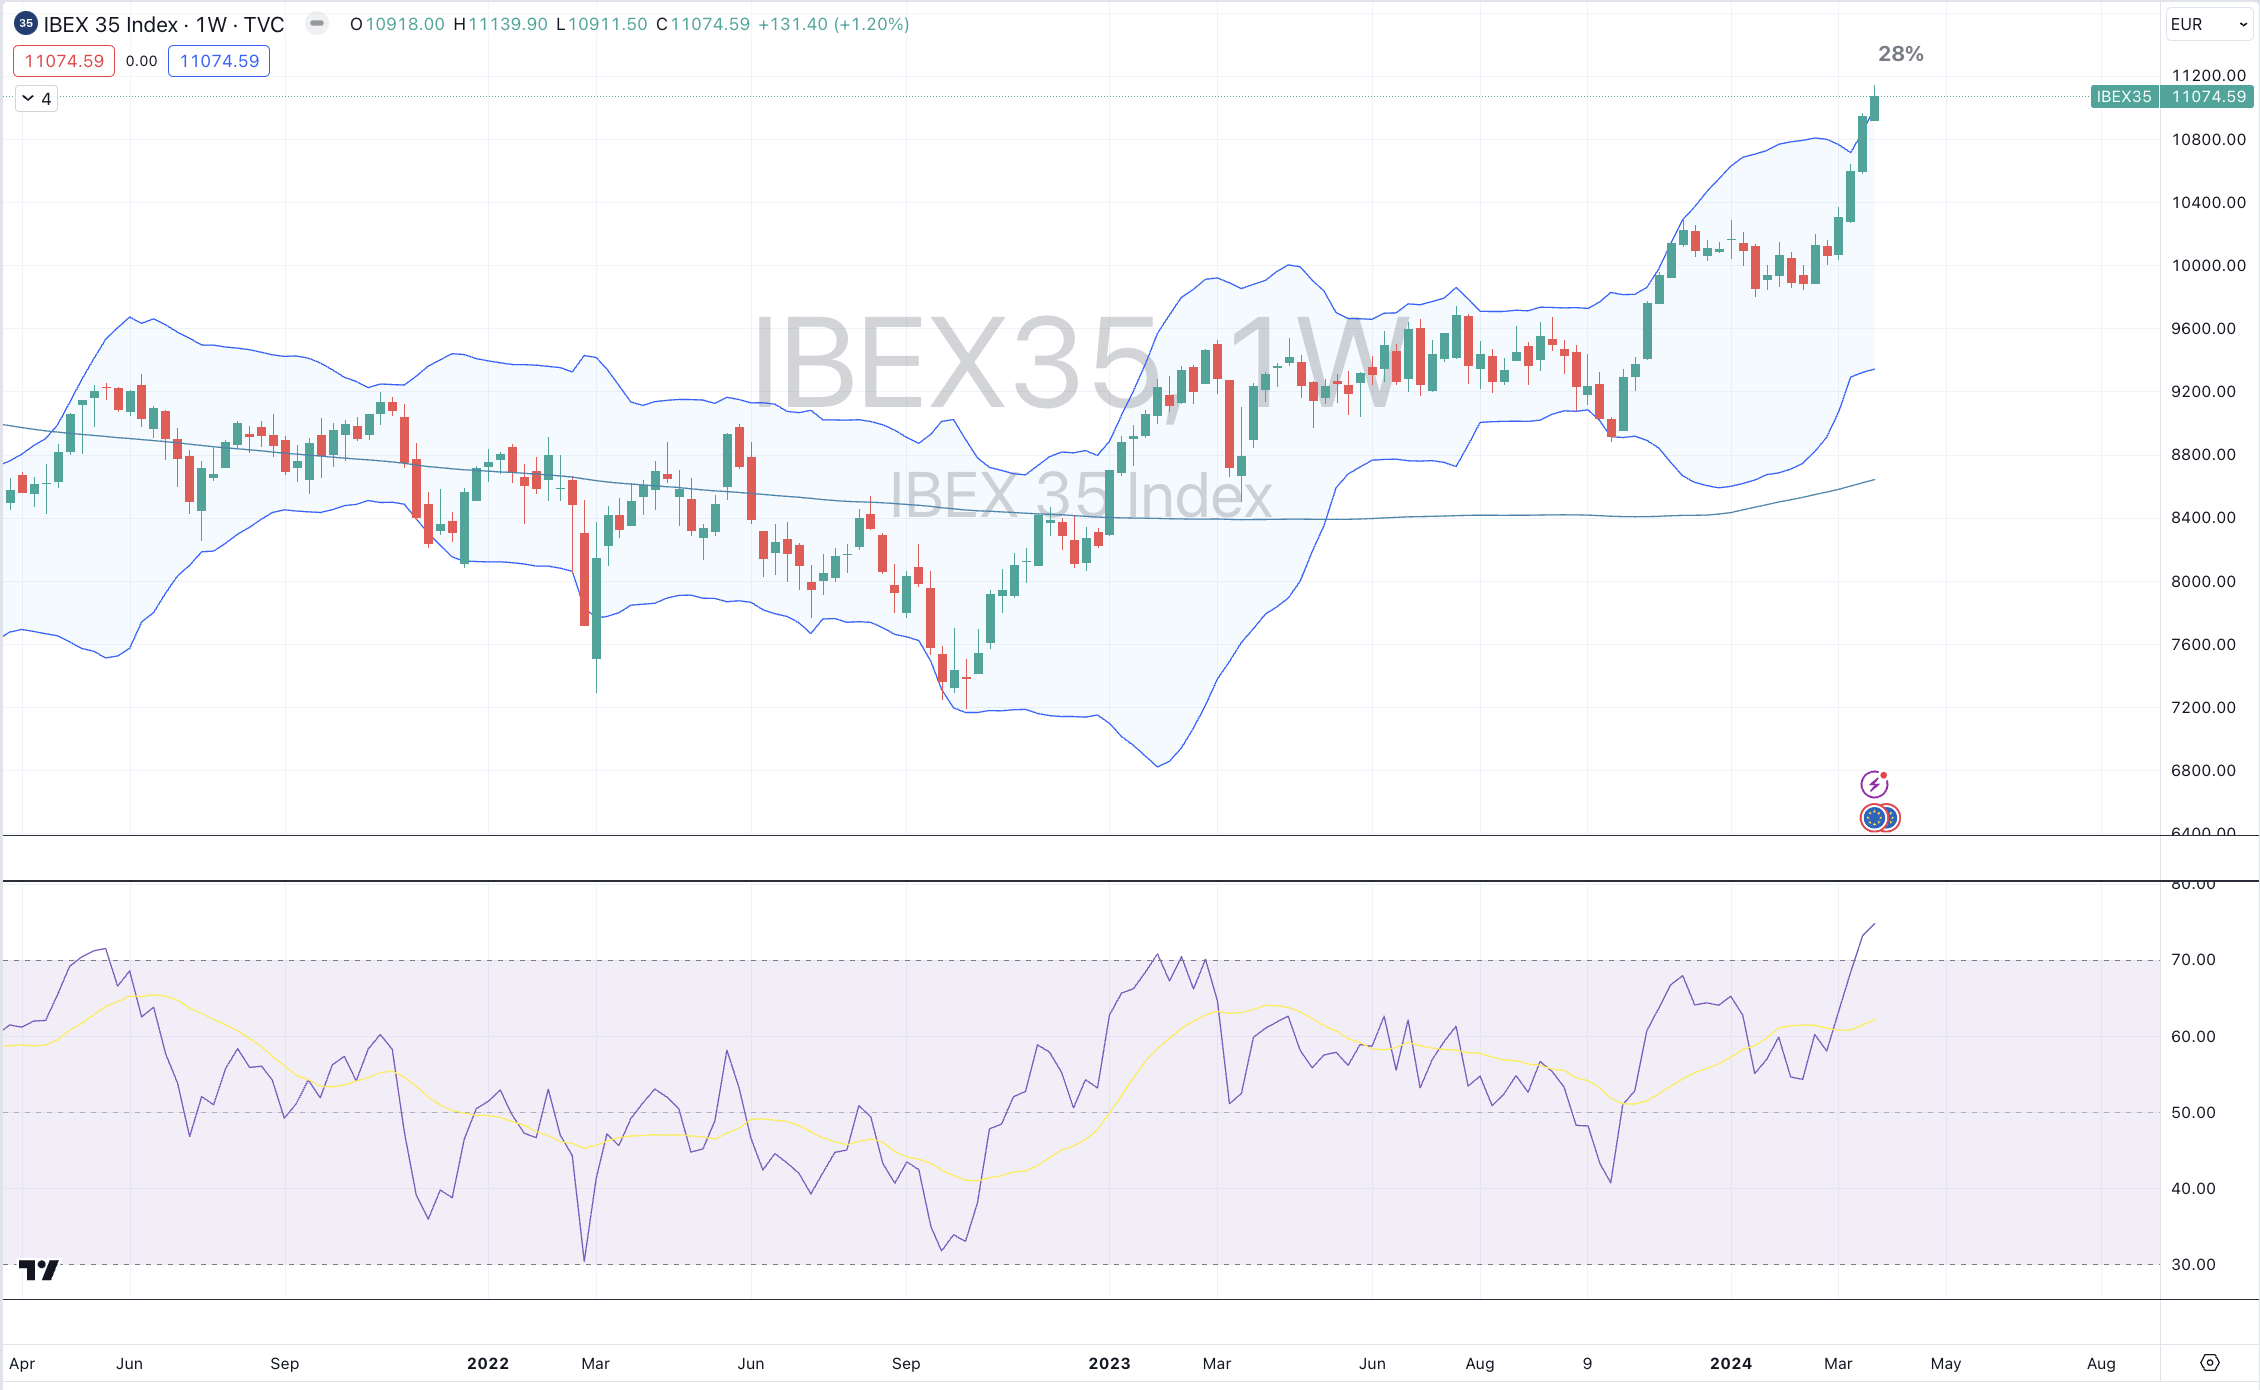
Spain’s IBEX is at its most overbought and stretched since April 2015…..but still NOT making an all-time high.
March 29, 2024
by Rob Zdravevski
Karri Asset Advisors
rob@karriasset.com.au
Trying to hear what's not being said
March 29, 2024 Leave a comment
Spain’s IBEX is at its most overbought and stretched since April 2015…..but still NOT making an all-time high.
March 29, 2024
by Rob Zdravevski
Karri Asset Advisors
rob@karriasset.com.au
March 26, 2024 Leave a comment
The two most notable parabolic price moves in recent times is being seen in the price of Cocoa and NVIDIA shares.
Both prices are trading at stratospheric percentages above their 200 week moving averages.
Cocoa is trading 3.5 standard deviations above its rolling monthly mean and even more astonishing, at US$9,950 per ton, it is more expensive than Copper which is trading at US$8,870 per ton.
Mean reversion or mean convergence?
Gravity is real.


March 24, 2024 Leave a comment
A weekly Macro, Cross Asset review of prices trading at extremes which may generate future investment ideas and opportunities.
The following assets (on a weekly timeframe) either registered an Overbought or Oversold reading and/or have traded more than 2.5 standard deviations above or below its rolling mean.
Extremes “above” the Mean (at least 2.5 standard deviations
US10 year minus Australian 10 year yield spread
US10 year divided by Australian 10 year yield spread
WTI Crude Oil
Copper
Tin
S&P GSCI
Brent Crude Oil
Silver in AUD, USD & EUR
Gold in USD
AUD/JPY
AUD/THB
FTSE 100
Overbought (RSI > 70)
Biodiesel
Robusta Coffee
AEX
Budapest
CAC 30
DAX
Dow Jones Industrial Average
Italy’s MIB
Nasdaq Composite
Nikkei 225
Stockholm
Philadelphia SOX
TAIEX
Nasdaq Transports
Toronto’s TSX
Vietnam
And the S&P 500 Index
The Overbought Quinella – Both Overbought and Traded at > 2.5 standard deviations above the weekly mean)
Russian 10 year bond yield
Gold in AUD, CAD, EUR, GBP & CHF
Cocoa
IBEX
Extremes “below” the Mean (at least 2.5 standard deviations)
AU10Y – US10Y yield
Australian Coking Coal
CHF/AUD
Chinese RMB
INR/USD
Oversold (RSI < 30)
Chinese 10 year government bond yields
Lithium Hydroxide
The Oversold Quinella – Both Oversold and Traded at < 2.5 standard deviations below the weekly mean)
None
Notes & Ideas:
Government bond yields mostly fell except for the Japanese 2’s and 5’s.
The Japanese 5’s winning streak extends to 7 weeks.
Russian 10 year yields have risen for 8 consecutive weeks.
The Chinese 10’s are the notable oversold extreme in this week’s list.
Equities were higher.
Shanghai is in a 6 week winning streak while the CSI 300 broke its 5 week advance.
Toronto’s has sneakily put together 6 straight rising weeks.
The DAX is in a 7 week winning streak, the MIB advance extends to 8 consecutive weeks.
The Nasdaq is 34% above its 2090 week moving average while the S&P 500 is 27% above the same measure.
Egypt’s 30 Index isn’t overbought anymore.
Spain’s IBEX has registered an overbought quinella as it trades at its highest point since June 2017.
The FTSE 100 returns to the overbought territory.
The CAC and DAX are still making new all-time highs.
The Dow Jones Industrial Average re-enters overbought territory.
And Italy’s MIB has traded to its highest point since May 2008.
Commodities were generally higher.
While Rotterdam Coal is in a 5 week winning streak, Most coal prices had a terrible week.
Crude Oil makes a return to overbought land, while Copper and Tin extend their stay there.
Rubber isn’t overbought this week.
Gold prices across various currencies remains overbought.
Cocoa has now spent 22 weeks in overbought land.
Nickel broke its 5 weeks winning streak.
Uranium and the Baltic Dry Index broke their 6 week losing streaks.
And Lithium Hydroxide has now spent 37 consecutive weeks in weekly oversold territory.
Currencies saw a firmer CAD again as was the USD.
The AUD was firmer against all except versus the Yen.
The Euro was mixed.
The Yen as did the Kiwi.
The latter is in a 4 week losing streak again the AUD.
The larger advancers over the past week comprised of;
Aluminium 2.8%, Cocoa 11.5%, LNG JKM in Yen 4%, Dutch TTF Gas 2.8%, Uranium 4%, Gold in CHF 2%, Wheat 5%, All World Developed ex USA 1.2%, AEX 2.9%, Austria 2.6%, KBW Bank 3.7%, DAX 1.5%, DJ Industrials 2%, DJ Transports 3.3%, IBEX 3.3%, Nasdaq Composite 2.9%, KOSPI 3.3%, S&P MidCap 400 2.2%, Nasdaq 100 3%, Nikkei 225 5.6%, Russell 2000 1.5%, SOX 3.2%, S&P 400 2.3%, TAIEX 2.8%, Nasdaq Transports 2.9%, FTSE 100 2.6%, ASX 200 1.3%, BIST 3.2% and the ASX Materials rose 2.4%
The group of largest decliners from the week included;
Australian Coking Coal (2.8%), China Coking Coal (2.8%), Rotterdam Coal (2%), Baltic Dry Index (5.5%), Cotton (2.6%), Lean Hogs (2.6%), Copper (3%), Heating Oil (2.4%), Tin (2.3%), Newcastle Coal (4.3%), Nickel (2%), Palladium (8.4%), Platinum (4.8%), Gasoil (1.8%), Silver (2%), Oats (2.1%), Rice (2.7%) and Egypt’s 30 equity index tanked 7.2%.
March 24, 2024
by Rob Zdravevski
rob@karriasset.com.au
March 21, 2024 Leave a comment
Does it matter what #LuluLemon Athletica’s quarterly results are when they are released tomorrow?
In 2008/2009, there was a 5 month period when investors could’ve bought the stock for under $4 per share.
Back then, I felt that I was their most lucrative customer in #LULU‘s Chapel Street, Prahan (Melbourne, Australia) store.
It was my Victor Kiam (of Remington) moment, which I didn’t act on.
Today, the stock is trading at $469, which is 117 times higher.
Is that a 11,700% percent mistake?
And it’s not even a technology company……
And only in October 2023 did the company join the S&P 500 when it’s market cap reached $55 billion.
Perhaps this story falls under the adage of buy your kids (or loved ones) $20,000 of ‘something’ and make them hold it for 15+ years.
March 21, 2024
by Rob Zdravevski
Karri Asset Advisors
rob@karriasset.com.au

March 20, 2024 Leave a comment
Another chance to buy Tesla shares (for those who believe or completed their due diligence) is nearing again and I think it’ll be at a price much lower than today’s.

March 20, 2024 Leave a comment
For the 8th time in the past 12 years, #Germany‘s DAX Index is registering a weekly overbought reading.
While there is more behind my analysis, this simple study shows that probabilities of a further advance change at this juncture.
Following such an occurrence, we mostly see the #DAX trade sideways, if not lower, for up to 24 months hence.
It’s not a time to chase.
That country #allocation trade began about 20 months in mid-2022.
50% ago.
This note listed that observation.
While the DAX is currently within its 7th consecutive week of higher prices and myopically, it looks like having a little more upside, the ‘fat part of the trade’ has been seen.
March 20, 2024
by Rob Zdravevski
Karri Asset Advisors
rob@karriasset.com.au

March 19, 2024 Leave a comment
The run in Copper has been seen and it may be full, for the time being.
On July 18, 2022 (20 months ago), I signalled a long trade in Copper expressed through the shares of #Sandfire Resources (SFR.ASX).
Since then, #SFR‘s stock price has risen from $3.75 to its current level of $8.54.
The ‘fat part of the trade’ has been seen.
Today’s price suggests a stock price which is trading at the upper end of its extremes.
On a weekly basis, SFR.ASX is overbought, trading at 2.5 standard deviations above its weekly mean and it’s at a stretched percentage above its 200 week moving average.
The hubbub around the copper price (and related companies) paints a similar picture, while I specifically think there is a bull trap in #HG1!
In corporate finance land, this is a time when its advisable for copper related companies to conduct a capital raising (new share issuance) to either reduce debt or fund capital expenditures plans or perhaps use your (improved) currency, name your shares to make an acquisition.
March 19, 2024
by Rob Zdravevski
Karri Asset Advisors
rob@karriasset.com.au

March 18, 2024 Leave a comment
Natural Gas prices are around $1.70.
What if they fall to $1.20…..well, it could present at attractive asymmetric long entry point.
In this week’s edition of Macro Extremes I wrote…….
Henry Hub Natural Gas prices fell 8% to close at an all-time low. This is another example of a parabolic price move being thumped. I’m watching closely for developing strength in this downward trend. Should it gather steam, a visit to $1.20 wouldn’t be out of the question. That’s quite move from $11 from only 20 months ago.
#Naturalgas traded to $11 when the market thought Europe would freeze as a result of a Russian gas squeeze.
With such an extraordinary low price, such cheap #gas makes renewable energy not so feasible and reiterates Natural Gas role through any process of the #energy transition.
March 18, 2024
by Rob Zdravevski
Karri Asset Advisors
rob@karriasset.com.au

March 18, 2024 Leave a comment
Uranium prices have declined for 6 consecutive weeks. These streaks usually end at 6, 7 or 8 weeks.
The 22% decline over the past 6 weeks has nearly retraced 50% of the advance which commenced in July 2023.
I think we’ll see some weakness this week followed by a pause of the recent decline. Maybe a bounce but I think the shake out of the later coming, long buyers isn’t done.
So, I expect a greater mean reversion before seeing another and safer moment to deploy capital to the larger structural #uranium bullish theme.
March 18, 2024
by Rob Zdravevski
Karri Asset Advisors
rob@karriasset.com.au
March 17, 2024 Leave a comment
A weekly Macro, Cross Asset review of prices trading at extremes which may generate future investment ideas and opportunities.
The following assets (on a weekly timeframe) either registered an Overbought or Oversold reading and/or have traded more than 2.5 standard deviations above or below its rolling mean.
Extremes “above” the Mean (at least 2.5 standard deviations
U.S. 3 month bill yield
Copper
Gasoline
Silver in AUD, EUR, JPY and CHF
Gold in USD, GBP , ZAR, CAD and EUR
Overbought (RSI > 70)
Biodiesel
Robusta Coffee
AEX
Budapest
CAC 30
DAX
Italy’s MIB
KLSE
Stockholm
And the S&P 500 Index
The Overbought Quinella – Both Overbought and Traded at > 2.5 standard deviations above the weekly mean)
Russian 10 year bond yield
Gold in AUD, CHF & JPY
Cocoa
Rubber
Egypt 30 Index
TAIEX
Extremes “below” the Mean (at least 2.5 standard deviations)
Australian Coking Coal
Iron Ore
Oversold (RSI < 30)
Chinese 10 year government bond yields
Lithium Hydroxide
The Oversold Quinella – Both Oversold and Traded at < 2.5 standard deviations below the weekly mean)
None
Notes & Ideas:
Government bond yields were mostly higher while many remain trendless.
All yields were lower, except for the Japanese, again.
Japanese 2’s eased away from overbought territory and broke its 8 week rising streak.
The Japanese 5’s winning streak extends to 6 weeks.
Russian 10 year yields have risen for 7 consecutive weeks.
The Chinese 10’s are the notable oversold extreme in this week’s list.
Equities were mixed. Most finished the week 1% of either of side of last weeks close.
Some European bourses continue their winning ways such as Spain, France and Italy as do the recently shunned Chinese indices.
While U.S. indices eased lower and some have commenced something resembling a retracement some weeks ago.
Australian indices were amongst the largest decliners.
The Shanghai Composite and the CSI 300 have put together a 5 week winning streak, the DAX is at 6 weeks, while the Philippines main index broke its 7 week winning streak and the S&P Midcaps snapped its 9 weeks run of advances.
As a result, the MidCap 400 isn’t overbought this week.
Copenhagen isn’t overbought either, nor the Nikkei 225, the NIFTY 50, the FTSE All World (developed ex-USA) index, SENSEX, the SOX and the Nasdaq Transports.
The Nasdaq Composite and Nasdaq 100 aren’t overbought anymore either.
Toronto’s TSX is in a 5 week winning streak.
Vietnam’s main index is nearing overbought territory.
Mexico broke its 5 week losing streak.
Brazil’s BOVESPA has bucked the direction of most global bourses by falling 5.2% since its Christmas overbought reading.
Intra-week, Russia’s MOEX 10 made another all-time high but didn’t close there.
The S&P 500 is still overbought. This week’s decline of 0.1% means it has only declined for 4 weeks of the past 20 weeks.
The CAC and DAX are still making new all-time highs.
Spain’s IBEX is at its highest point since January 2018 and is nearing an interesting overbought scenario.
The Dow Jones Industrial Average took a vacation from its 13 week stay in overbought territory.
And Italy’s MIB has traded to its highest point since May 2008.
Commodities were generally higher.
Oils, distillates and most gases (except for Henry Hub Natural Gas) had a good week, which weigh heavily on the performance of the broader commodity tracking indices.
As a result, JKM LNG isn’t oversold this week.
Inversely, Henry Hub Natural Gas prices fell 8% to close at an all-time low. This is another example of a parabolic price move being thumped. I’m watching closely for developing strength in this downward trend. Should it gather steam, a visit to $1.20 wouldn’t be out of the question. That’s quite move from $11 from only 20 months ago.
While Gold prices took a breather, its price remains in overbought territory across various currencies.
AUD Gold remains 23% above its 200 week moving average.
Other precious metals had a good week too, with Palladium outpacing Silver.
Cocoa went super parabolic rising 25% for the week and has now spent 21 weeks in overbought land.
Coal was a loser again.
Raw Cane Sugar recovered all of last weeks decline.
Grains, Precious Metals and Industrial Metals were firmer.
Corn and Soybeans are not oversold anymore. In fact, Soybeans have risen for the past 3 weeks after snapping their recent 10 week losing streak.
Wheat is very close to an oversold reading.
Since its recent oversold reading, Nickel has risen for the past 5 weeks.
Uranium and the Baltic Dry Index are in 6 week losing streaks.
The former has fallen 22% during that streak.
Rotterdam Coal is in a 4 week winning streak.
I see a change in trend approaching for Urea prices.
And Lithium Hydroxide has now spent 36 consecutive weeks in weekly oversold territory.
Currencies saw a firmer CAD, EUR and USD.
The USD rose against everyone unless it was a Peso.
The Japanese Yen was weaker perhaps as capital markets continue to embrace risk, or is this some sort of divergence?
The Aussie fell against everyone except the Yen and Baht.
The DXY Index recovered more than half of last weeks decline.
And the USD broke its 5 week losing streak against the SEK.
The larger advancers over the past week comprised of;
Rotterdam Coal 2.2%, WTI Crude 4.1%, Lean Hogs 2.4%, Copper 5.9%, Heating Oil 3.6%, JKM LNG 3.8%, LNG in Yen 3.6%, Tin 3.4%, Cocoa 25.4%, Orange Juice 2.6%, Palladium 6.3%, Platinum 3.1%, Gasoline 7.5%, Biodiesel 2.4%, Sugar 4.6%, Cane Sugar 4.5%, SPGSCI 2.8%, CRB 2.9%, Dutch TTF Gas 2.4%, Brent Crude 4.2%, Gasoil 4%, CAC 1.7%, China A50 2.1%, MIB 1.6%, HSCEI 2.9%, Hang Seng 2.9%, IBEX 2.8%, Mexico 2.4%, Stockholm 1.9%, Chile 1.9%, Silver in AUD 4.6% and Silver in USD rose 3.6%.
The group of largest decliners from the week included;
Australian Coking Coal (5.3%), China Coking Coal (5.3%), Hot Rolled Coil Steel (2.7%), Lumber (2%), Newcastle Coal (4.7%), Natural Gas (8.3%), China Iron Ore (6.4%), S&P SmallCap 600 (1.8%), Russell 2000 (2.1%), Nasdaq Composite (0.7%), KRE Regional Banks (3.5%), S&P MidCap 400 (1%), Nasdaq Biotechs (1.2%), Nikkei 225 (2.5%), Nifty (2.1%), PSE (1.7%), SENSEX (2%), SOX (4%), ASX 200 (2.3%), ASX Materials (3.4%), ASX Industrials (2.7%), BIST (3.6%) and Uranium fell 5.9%.
March 17, 2024
by Rob Zdravevski
rob@karriasset.com.au
