This year, IPO’s on U.S. exchanges have raised a record $140 billion, exceeding the $107 billion raised in the height of the 1999 dot-com boom.
It has also been a week when we have seen;
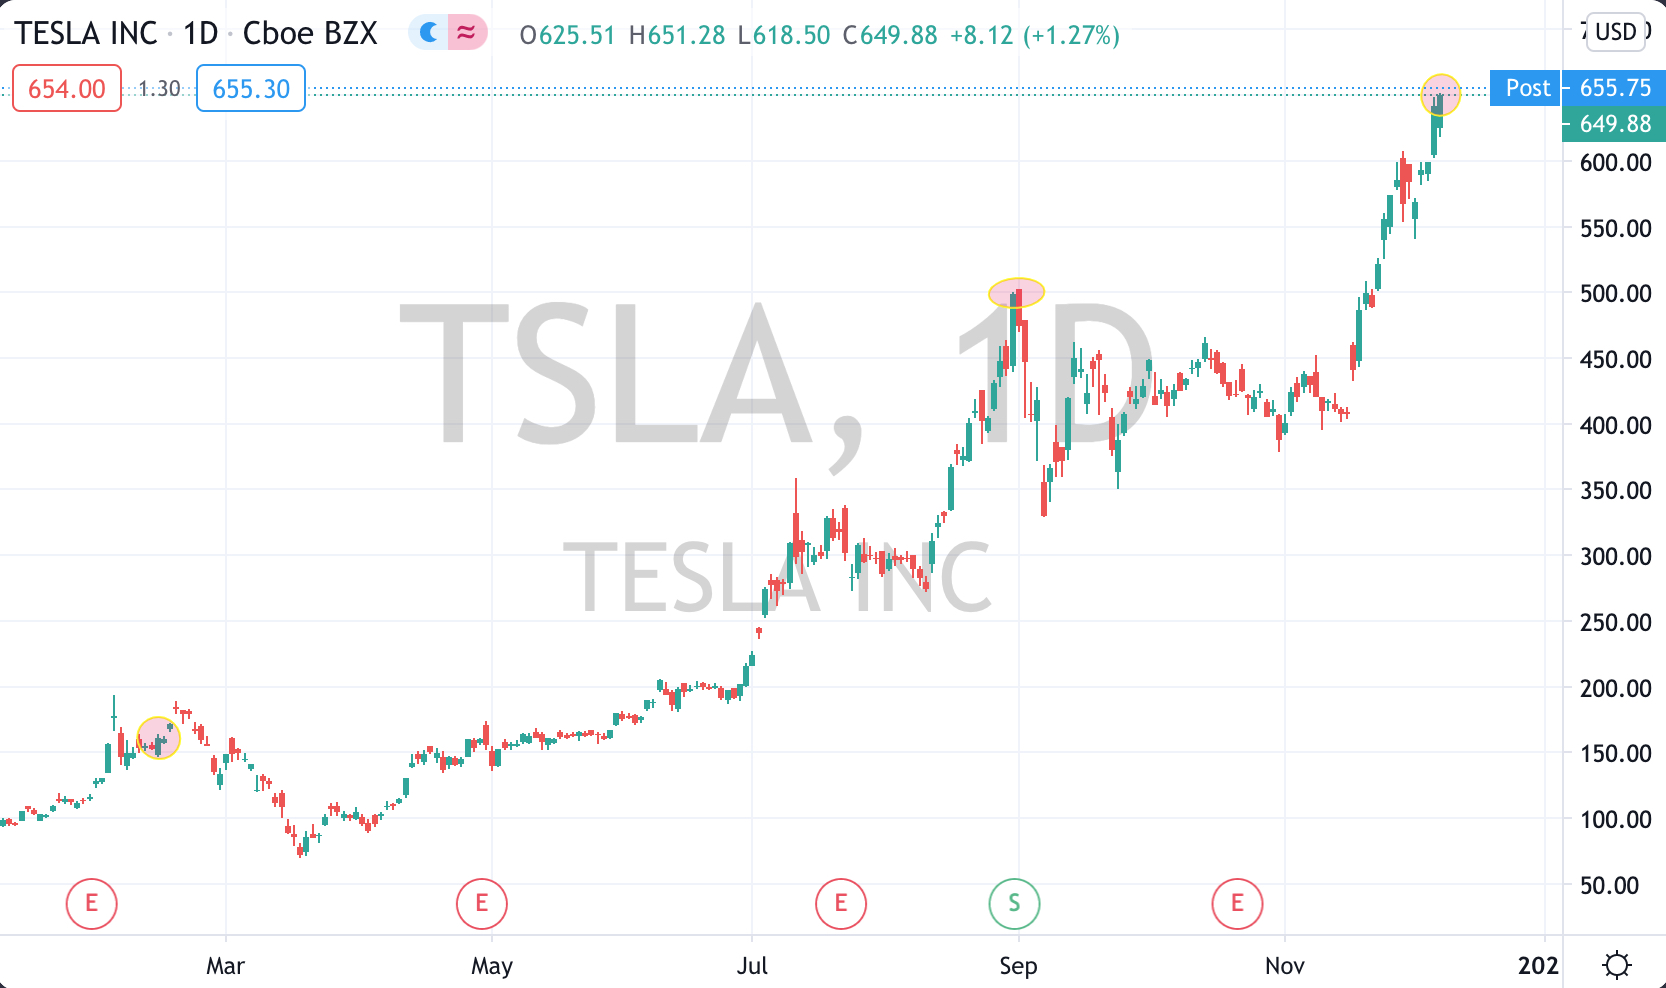
✔️ Tesla announce its 3rd (secondary) equity sale this year.
The timing of the previous offerings uncannily occurred at interim market highs;
✔️ the most ridiculous IPO in DoorDash;
(stock doubles on its first day, market cap is $60bn vs. $16bn in early 2020)
✔️ and Airbnb premiered on the bourse with an IPO of its own.
The process of pricing of Airbnb’s IPO began between the $44-$50 per share range which was revised to $56-$60 while the final price struck was at $68.
Unlike Facebook’s IPO pricing debacle in 2012, I think Airbnb’s pricing was spot-on.
The after-market demand saw the stock close at $145 on its first day of trading. With $602 million shares outstanding, it now has a market cap of $87 billion.
But on a fully diluted basis (including employee stock, options and restricted units) Airbnb has 700m shares, so its Market Cap is $101 billion.
and DoorDash has 385m shares, which adjusts its Market Cap to $71.5 billion, which is a little bit too much when you are losing $150 million and trading on 30 times revenue.
December 11, 2020
by Rob Zdravevski
rob@karriasset.com.au