My reasons for turning bullish on bank stocks include:
a) I expect longer dated interest rates to rise (reminding me of the 3-6-3 rule, pay 3% on the deposits, lend money out at 6% and be on the golf course by 3pm)
b) this means their net interest margins should increase
c) banks have taken their medicine and paid their fines for past indiscretions (it’s not new news)
d) banks have already made extraordinary provisions for COVID-19
e) in turn, I expect them to revise and lower these provisions to account for the quicker than expected business recovery.
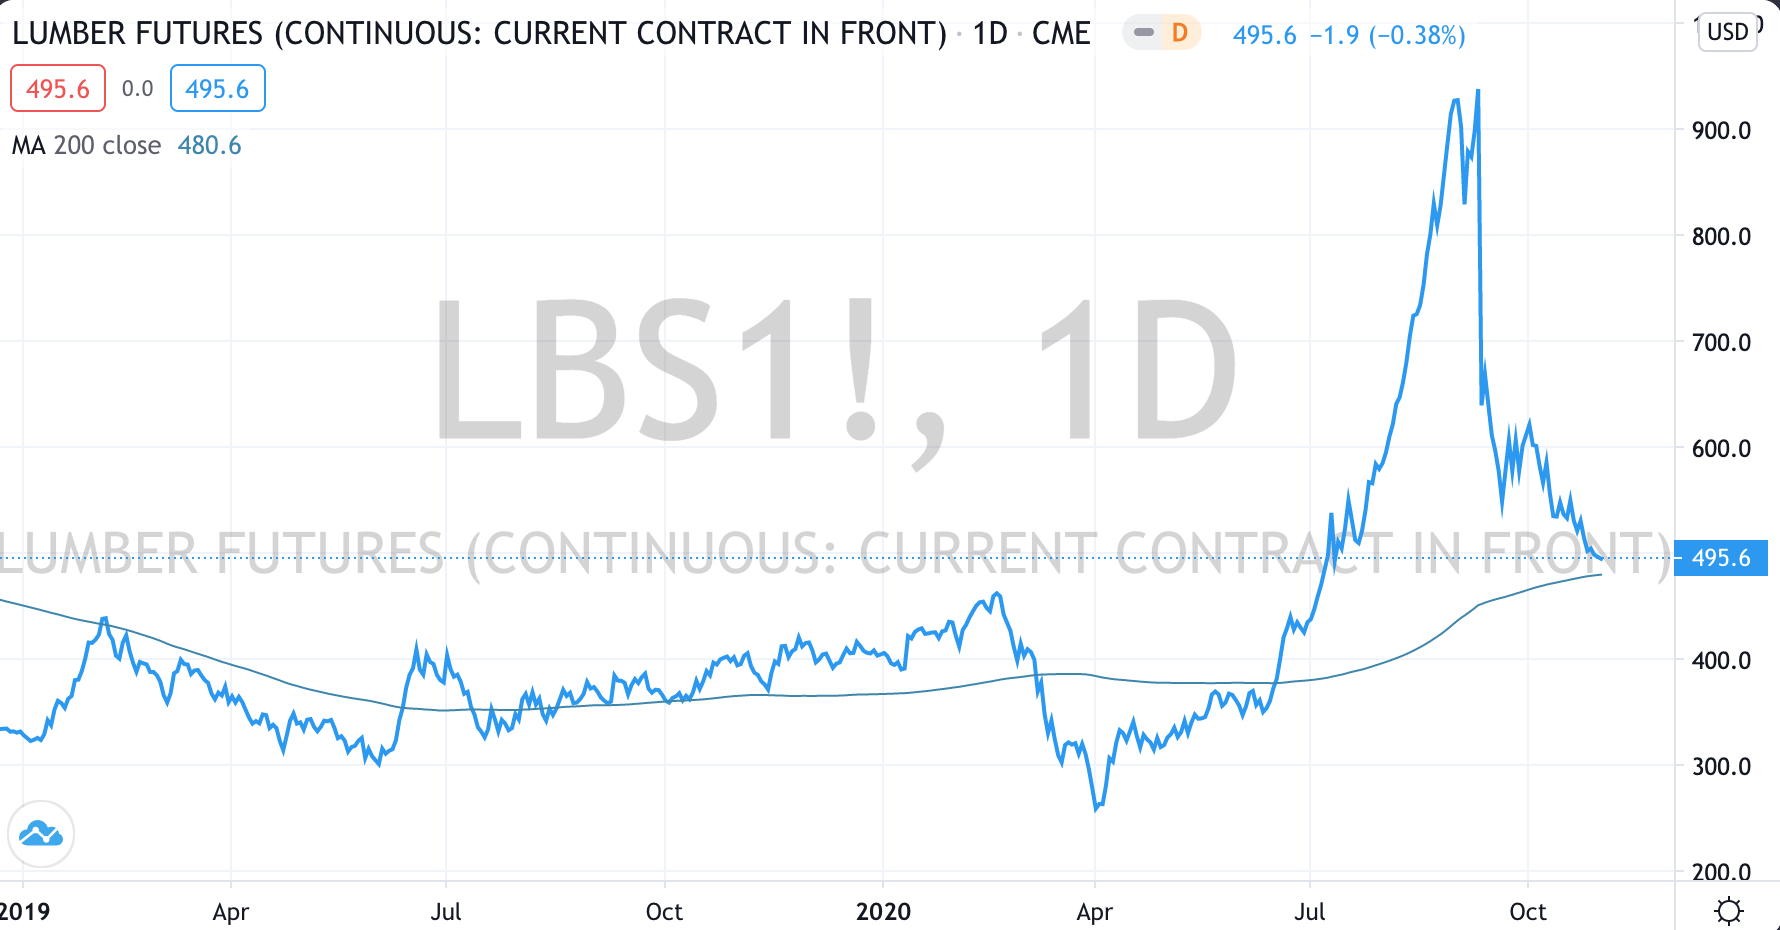
The links below follow my time series of posts about a Lumber trade which commenced in July 2020….
Today’s chart below shows Lumber halving from its recent high, to come back and say ‘hello’ to its 200 day moving average.
Some points which come to mind are: a) catching the fat part of the trade is good enough, b) it’s OK for prices to go higher without you being on board, c) many times it’s knowing when not to be in a trade (when the reward doesn’t outweigh the risk being taken), d) mean reversion eventually happens.
Previous Lumber blog posts, in chronological order;
As the IPO market heats up, so does the shenanigans of the offer details.
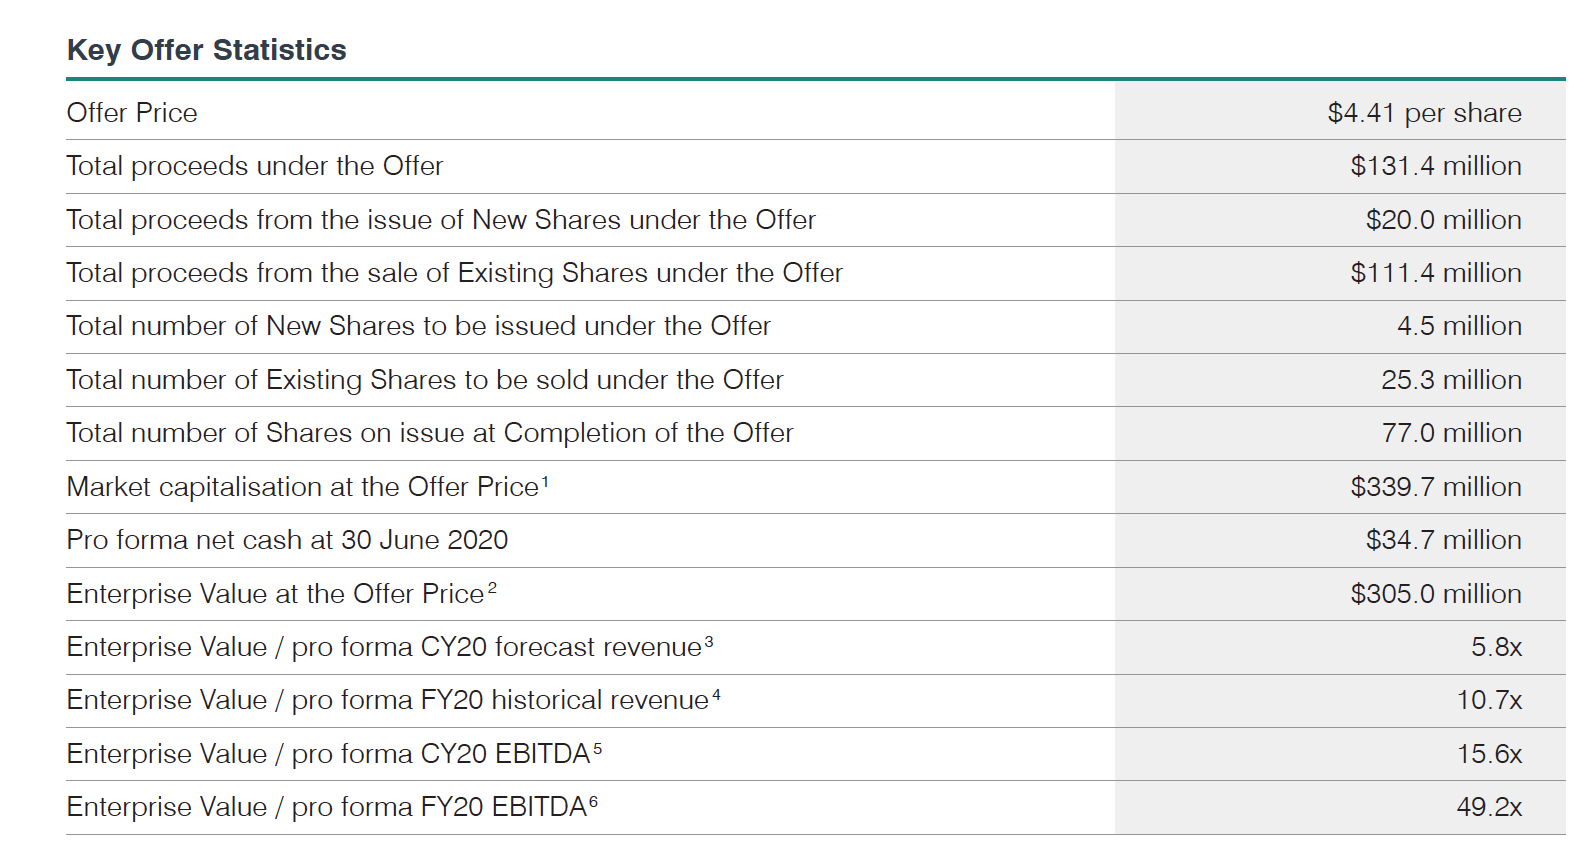
Cleanspace’s (CSX.AX) recent prospectus has a sense of artfulness.
The company ‘offered’ $131 million, of which $111 million is sent to ‘existing shareholders’. (see: use demand from IPO subscribers to soak up the selling).
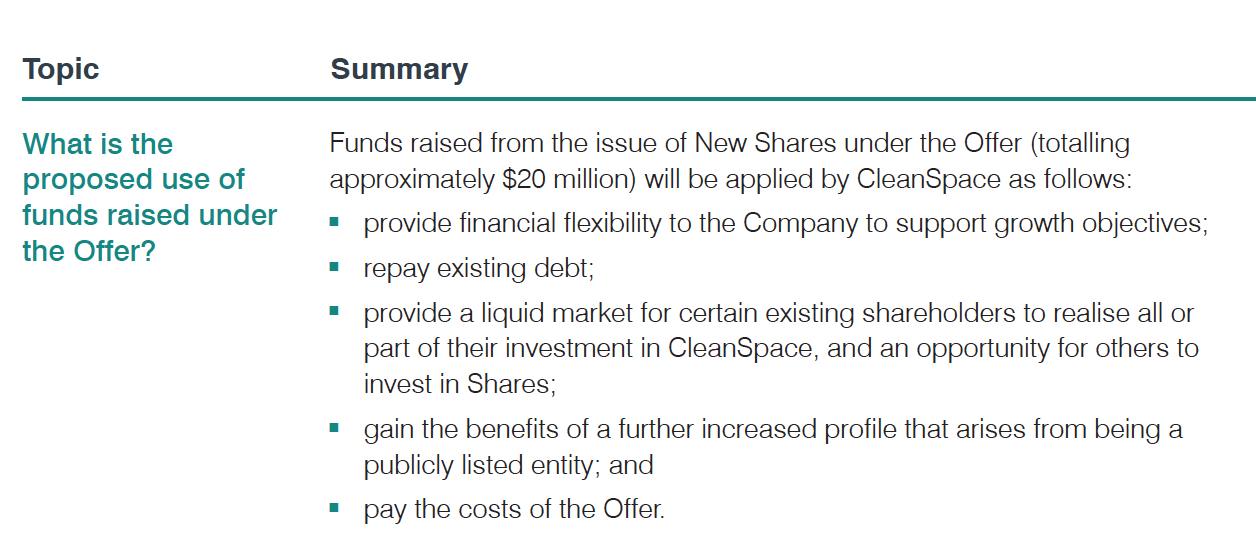
This only leaves $20 million for corporate use.
But the brokers promoting the IPO receive $5 million and a further $5 million is being used to pay back a loan. Deduct a few more professional services fees and the IPO hasn’t really raised much at all for the company’s operating purposes.
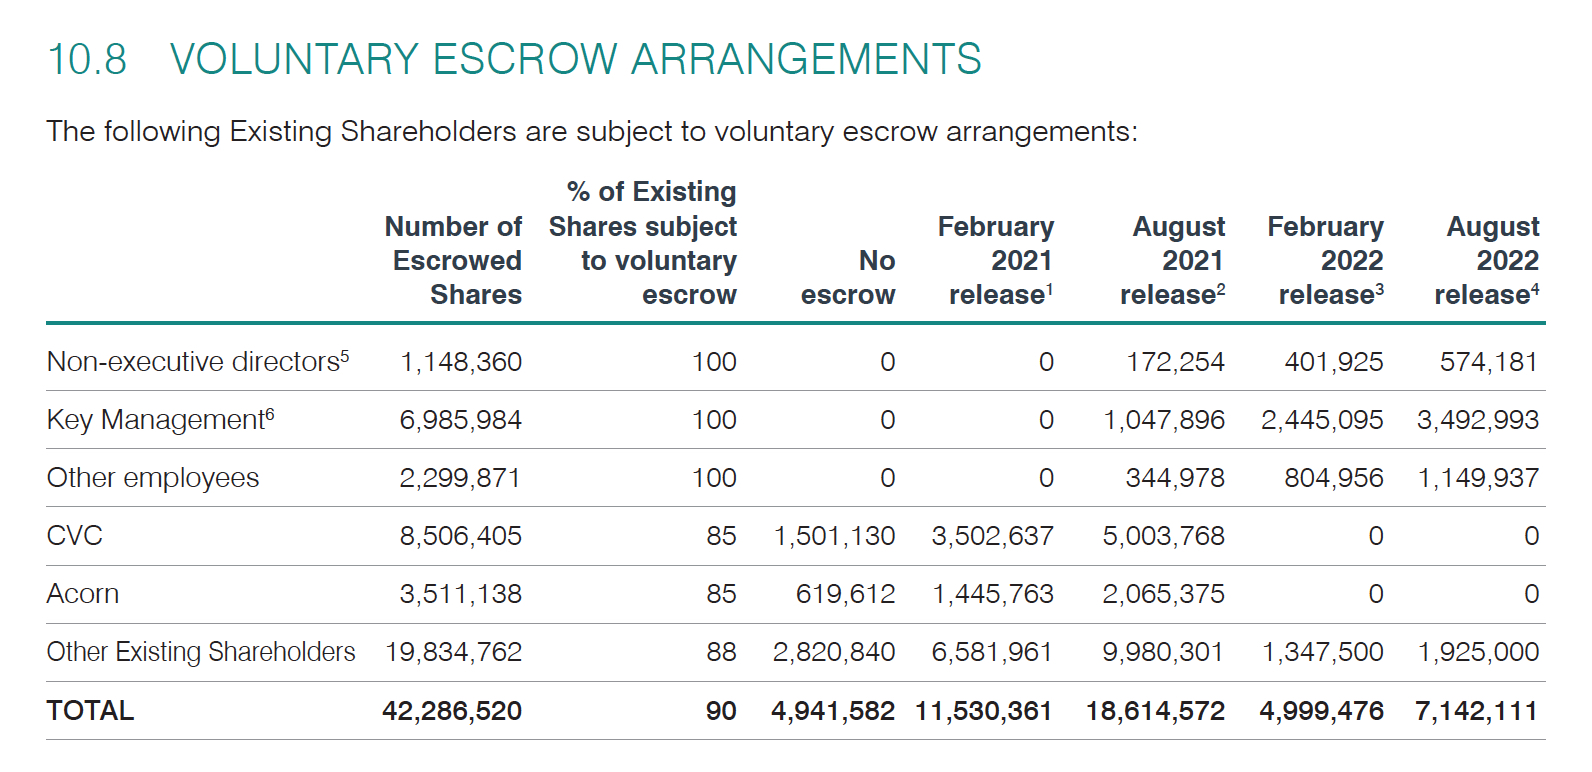
And ‘existing shareholders’ with remaining holdings entered into a ‘voluntary escrow’, which is quite standard although hardly a commitment when 25% of the shares are able to hit the market in 4 months time and another 44% of the escrowed stock free up 10 months from now (August 2021), which will likely be before the 2021 full year results are released.
(the FY20 annual report was signed off August 27, 2020)
I may ask what is wrong with the picture? and suggest to read your prospectuses !
For now, all seems to be fine 🤷🏻♂️
With an IPO price of $4.41, CSX traded to a high of $7.44 on its public debut.
During a client call yesterday, I was trying to give an example of what I thought was a ‘marginal trade’ and Fortescue Metals (FMG.AX) came to mind.
Coupled with my quick view of the iron ore supply and demand landscape, an iron ore price trading at the upper end of its historical range and a technical analysis snapshot, my opinion was that FMG either trades up or down $4, from its current price of $16.30.
Albeit a 25% return is enticing, an even money bet of perhaps losing 25% renders it a ‘marginal trade’.
To some extent, this can also be example where the investor needs to quantify or understand how much risk they are taking, compared to the return they are seeking.
Incidentally, in June 2020 I published an article (see link below) titled, “Iron Ore – As Good As It Gets”
On July 15, 2020, I wrote about a relative argument for higher equity prices based on the earnings yield of the S&P 500 being at its highest factor or multiple (7 times) over the government 10 year bond yield since WW2.
I’m trying to highlight that investors are being paid well to take risk and hold equities rather government bonds.
Today, the S&P 500’s forward P/E is 21.8, which puts it on an earnings yield of 4.6%. The 10 year bond yield has risen to 0.82%, so that spread is now 5.6 times.
But the equity market remains fertile (relatively) when I compare the landscape to early 2011 when the P/E was 12. The earnings yield (EY) of 8.3% was only 2.5 times more than 3.3% risk free rate.
From there, the S&P 500 rallied 40% from 1,280 to a January 2014 level of 1,800.
At that point the earnings yield of 7% was still 2.5 times more than 2.8% bond yield (P/E was 14.3) and the S&P rallied a further 55% up to 2,800 points in January 2018.
If we exclude the six FAANMG’s stocks (whom count for 25% of the index market cap), the S&P 500’s P/E ratio is 19.
Hmmm, that 5.2% earnings yield is 6.3 times more that the 0.82% bond yield.
Putin and MbS are having talks again, watch the oil price, timing interesting near the U.S. election, output cuts are the logical bet, there is nothing like petro-nations needing petro-dollars.
As written in previous posts, the trend continues.
Conoco Phillips bids for Texan shale producer, Concho Resources for US$9.7 billion in COP stock.
Never heard of them, they have more revenue than Woodside Petroleum.
Well, Concho’s previous day’s market cap was $9.6 billion. After receiving the ‘take-under’ approach, today, CXO’s stock fell 2.8%. Hardly a resounding response, mainly because COP’s stock fell 3.2%.
Note that no cash is involved…..COP is using stock…..sadly COP share price has halved in the past 9 months……that’s quite telling.
Conoco’s market cap in January 2020 was US$70 billion. Now, it’s US$35 billion.
It’s an overt scramble to replace depleting reserves in absence of exploration capex.
This year, Devon Energy merged with WPX Energy and Chevron buys Noble Energy – all using stock, not (cheap) debt.