Here is a lovely chart showing the price of WTI Crude compared to U.S. 5 year break-even inflation rate.
To which the St. Louis Fed says about the latter, ‘the value implies what market participants expect inflation to be in the next 5 years, on average.’
Each value dance wonderfully together.
The better part of the chart is the lower bit where the RSI (Overbought/Oversold) indicator appears.
Whenever the 5 year breakeven inflation rate is Oversold (as this weekly chart shows), the WTI Crude Oil price finds a floor from which to advance.
We saw an Oversold 5 year b/e rate last week.
This week’s OPEC production cut announcement wasn’t a surprise because this Oversold moment in the U.S. 5 year break-even inflation rate tends to coincide with OPEC announcing production cuts.
Of course, Biden isn’t happy that OPEC have cut production.
Furthermore, Biden has virtually released all of the nation’s Special Petroleum Reserves. While he probably thinks it was his strategy sending Gasoline prices lower, when it was in fact a combination of other falling commodity prices (which is deflationary), mean reversion in the oil price and rising credit forces at work.
No to mention the importance of Biden needing lower domestic petroleum prices to aide his mid-term election hopes.
OPEC’s production cut may seem to be mathematically synchronised to the United State’s own inflation break-even rates but I think it is equally loaded with a little political payback.
Funnily, the U.S. isn’t pleased with this announcement and have passed on their views but it’s difficult to have a say into a club of which you’re not a member of.
Keep in mind, this study doesn’t assist the decision of when to sell your Oil.
I don’t know why people make it so difficult for themselves.
The bond market is ‘more correct’ than the rhetoric or ‘tough talk’ that central bankers provide.
The former isn’t emotional while the latter is and susceptible to biases.
The U.S. 2 year bond yield started rising and forecasting higher interest rates in October 2021, when it passed the 0.30% level.
By the time the Federal Reserve announced its first rate hike on March 17th, 2022, the U.S. 2 year bond yield was 2.20%
I think it is a waste of time speculating or debating if the Fed will ‘pivot’ and change direction.
Firstly, a reversal of current direction is not an automatic occurrence. The Fed can keep rates where they are for a little more.
Secondly and more importantly, the bond market will tell you more.
Currently, 2 year bonds are yielding 4.15%.
Much is priced in and now poised at stretched levels.
The chart below shows the Fed raising rates by a factor of 12 from the 0.25% low.
This is in belated sync with the 11 to 13 fold hikes seen in many other economies while those commodity sensitive nations (where the citizens are least indebted compared to those in the G10) such as Brazil, Chile and Mexico all started hiking rates (trying to fight inflation) between March 2021 and June 2021.
The most crowded trade, thesis and belief is still – for higher rates.
Not many are calling lower rates.
I am.
For various reasons, I think this U.S. 2 year bond yield falls back to the 2.30%-2.60% range in the coming 10-20 months.
Does this mean that the Fed cuts rates into the next year?
Perhaps, Yes. Maybe taking the Fed Funds Rate to 2.75%
But I can’t see how they can raise rates another 1% with out ‘breaking something’.
Why AMZN’s $102 price low seen on May 9th, 2022 may hold?
This was one of 3 moments when AMZN stock price mean reverted to/or below its 200 week moving average, traded 2.5 standard deviations below its rolling weekly mean and registered a weekly RSI Oversold reading.
The following assets (on a weekly timeframe) registered an Overbought or Oversold reading and/or have traded more than 2.5 standard deviations above or below its rolling mean.
Extremes “above” the Mean (at least 2.5 standard deviations)
Australian 2 year government bond yield
Swiss 10 year government bond yield
U.S. 10 year minus Australian 10 year bond yield spread
Overbought (RSI > 70)
U.S. 2 year government bond yield
The Overbought Quinella – Both Overbought and Traded at > 2.5 standard deviations above the weekly mean)
U.S. Dollar Index (DXY)
U.S. 5, 10, 20 and 30 year government bond yields
German 2, 5 & 10 year government bond yields
British 5 year government bond yields
Spanish, French, British, Greek, Italian, Korean, Portuguese and Swedish 10 year government bond yields
TBT & TBX
Extremes “below” the Mean (at least 2.5 standard deviations)
U.S. 10 year minus U.S. 5 year bond yield
Cocoa
AUD/USD
CAD/USD
SEK/USD
AUD/INR
AUD/SGD
Oslo, Copenhagen and Helsinki equity bourses
Spain’s IBEX
The FTSE 100 and the Swiss SMI equity indices
Oversold (RSI < 30)
Tin
Hot Rolled Coil Steel (HRC)
JPY/USD
KRW/USD
HSCEI
Taiwan’s TAIEX, South Korea’s KOSPI and the HSCEI equity indices
The Oversold Quinella – Both Overbought and Traded at > 2.5 standard deviations above the weekly mean)
CAD/USD
NZD/USD
SGD/USD
NZD/AUD
IEF, IEI & TLT
Notes & Ideas:
The big news for the week was the whipsawing action seen in the foreign exchange markets.
The British Pound bounced and made up nearly all of the weakness seen early in the week.
I write this note about the perspective and figures behind the move.
In that note, I highlighted that this week the AUD lost 3.1%, 4.7% and 1.9% versus the EUR, GBP and USD respectively. Along with the AUD/JPY, these currency crosses all appeared in the past week editions showing the AUD trading at ‘extremes’ to each of them.
Yet, we don’t hear the word crisis’ used when the Aussie tanks 5% against Sterling??
For additional comparison, this past week the FTSE 100 equities index fell 1.8% whilst the ASX 200 declined an almost equal 1.5%.
The Aussie stockmarket wasn’t labelled as being in crisis.
Perhaps, we can say, not all crises are same?
In equities, on a closing weekly basis, we mostly saw consolidating and benign moves especially amongst the Small and Mid Cap indices.
However, intra-week also saw plenty of movement.
And we are now seeing some in Oversold territory again.
The larger losers for the week appear in the list below along with a host of idea generators.
We saw the S&P 500 mean revert to its 200 week moving average (WMA) for the first time since March 2020 and last week’s visitors to the 200 WMA stay around it, including the Nasdaq 100, CAC, Russell 2000 and U.S. small and mid caps.
The DAX, SOX and Dow Jones Industrials are nearing that mark, as are a few others
We also saw subdued moves in many other markets. The U.S. Dollar Index only fell 0.8% and the CRB Index snoozed at (0.07%).
All the larger moves (+/- 2%) for the week appear in the list below, which has featured the smallest amount of securities in some weeks.
The larger advancers over the past week comprised of;
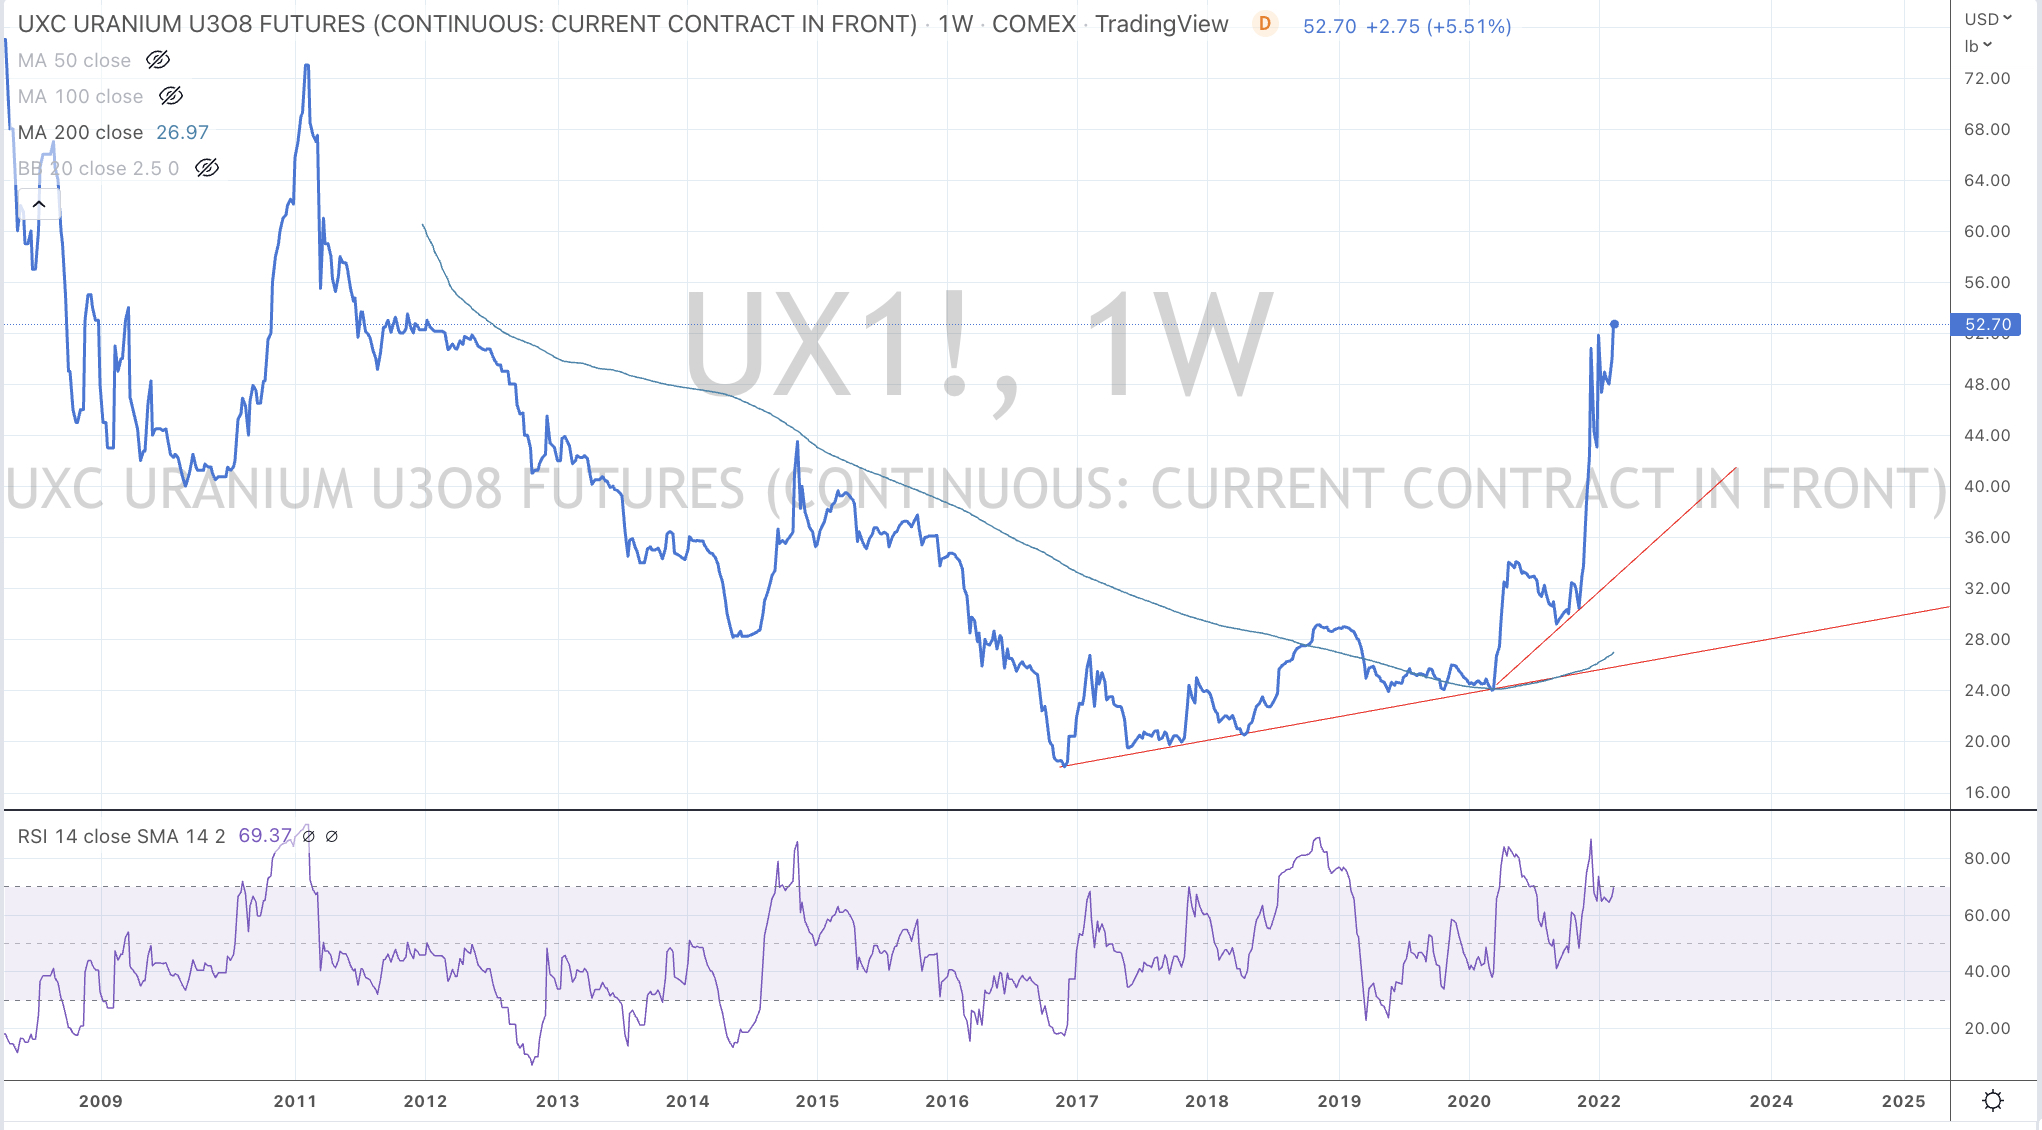
Australian Coking Coal 3.2%, Cocoa 4.8%, Gasoil 3.1%, Copper 2.1%, Heating Oil 4.1%, JKM KNG 3.1%, Orange Juice 4%, Palladium 54%, Dutch TTF Gas 1.8%, Silver in AUD 2.9%, Gold in AUD 3%, Wheat 4.7%, Nasdaq Biotech 2.1%.
The group of decliners included;
Rotterdam Coal(3.5%), Baltic Dry Index (3.1%), China Coal (4.9%), Lean Hogs (3.7%), HRC (3.2%), Lumber (2.9%), Tin (2.3%), Nickel (6.5%), Sugar (3.3%), Cotton (7.8%), Florida Urea (6.1%), Brent Crude (1.6%), Middle East Urea (11.3%), Soybeans (4.3%), Shanghai Composite (2.1%), KBW Banks (3.1%), DJ Industrials (2.9%), MIB (2%), HSCEI (33%), HSI (4%), IBEX (2.9%), Nasdaq (3%), Nikkei (4.5%), SOX (4.2%), S&P 500 (2.9%), Strait Times (3%), TAIEX (4.9%), FTSE 100 (1.8%), Nasdaq Composite (2.7%) and Australia’s ASX 200 declined 1.5% for the week.
Last Friday September 23rd, the British Pound started seeing accelerated weakness against various currencies and most prominently against the U.S. Dollar. The ‘noise’ of calling it a crisis continued on Monday September 26th.
Readers of the September 24th edition (last week’s) of ‘Macro Extremes’ would have seen the GBP was already featured in the Oversold section.
From its close of 1.1256 on Thursday September 22nd it has fallen to an intra-day low of 1.04. Albeit a 7.5% move within 2 days is worthy of note.
Today, the GBP/USD is almost back to its price seen (1.1168) on that Thursday. Quite a roundtrip but hardly a crisis and more appropriately a reminder to taking a look if prices were already at an extreme and understanding if this is a continuation of an existing downtrend or an exhaustive move which catches the ‘noise-worshippers’ out?
On the week, the GBP/USD rose 2.8%.
Yet….we don’t hear the word ‘crisis’ being bandied about.
Some FX traders have lost 6% in a week, shorting the British Pound against the USD, at its lowest ever level.
Cleverly, I hope there were many bought Sterling at Sterling at what was nearly a 4-sigma event.
The previous all-time low vs USD was 1.0545 seen in March 1985.
Inversely, this past week we saw the Australian Dollar fall 3.1% against the Euro, it sank 4.7% versus the British Pound, declined 1.9% compared to the USD and has fallen 5.2% against the Yen in the past 3 weeks.
Cut your inventories and receivables numbers by 30%.
If you are analysing publicly listed balance sheets of companies selling ‘non-critical’ products, it may be advisable to lower the ‘current assets’ as seen in the past quarterly reports.
Many companies won’t receive their full quota of monies owed (receivables) nor the full price of their inventory on offer.
This also puts pressure on the cycle of honouring your payables.
Nike reports high inventories and coming discounting in their latest quarterly financial report.
Nike held 19% of its revenues as inventory.
Its total inventory last quarter was touching $9 billion.
This shouldn’t be a surprise but the market is acting as if it is.
Nike’s share price is trading 10% lower in today’s pre-opening market.
In May 2022, I painted a scenario of how falling demand results in higher inventories.