The real return matters

Once upon a time when you bought a government bond to receive a yield of 2% and the inflation rate was 1%, your real return was 1%.

When bonds were yielding 0.5% and inflation was 0.5%, the real return was 0%. At least investors weren’t losing money.

Heck, when German 10 year bonds were yielding negative 0.5% and inflation was negative 0.2%, investors capital remained mainly intact.

Now that bond yields have risen sharply, many holders of those bonds have lost capital. If you are not aware, when the price of a bond falls, the yield inversely rises. And vice-versa.

Today, if you are tempted to or are pondering buying a U.S. government bond, you will receive a 4% yield but when inflation is 7% (and I’m being kind), your real return is Negative 3%.

With this losing prospect, (unless you seek riskier or distressed opportunities) many investors are choosing to either sell their bonds (and realising capital losses) or not buy them at all.

This is exacerbating the selling or general distaste of or for bonds and that means prices continue to fall as bond yields rise further.

The latter is a problem for governments or companies who need to issue debt. Their interest (coupon) repayments costs are higher than recent times.

If you are in business, the cost of (capital) borrowing is now more expensive.

But, if investors are selling bonds or choosing not to buy them, logically that means those intended funds are remaining as cash.

The real return for cash is worse than being in bonds.

Real Estate may yield 3% or 4% but its real return isn’t any better especially if you need to account for taxes and any borrowing costs.

Commodity prices do correlate well with inflation and worthy of investment merit although they don’t produce income or a yield per se.

This brings me to the equity market.

Generally speaking, valuations of many equity markets are not demanding in their own right.

When compared to their real return (earnings yield minus inflation) they are presenting a slightly better proposition than government bonds.

The S&P 500 has a forward P/E of 16, thus its earnings yield (divide the PE ratio of 16 into 100) is 6.2% and so when we subtract a 7% inflation rate, it becomes slightly negative.

That is better than the (3%) real return from a 10 year government bond.

S&P MidCap 400 P/E is 13 so its earnings yield of 7.7%, making the real return slightly positive or breaking even.

The Chinese equities market has a P/E of 10 which calculates into a 10% earnings yield. Subtracting the China inflation rate of 3% (its actually 2.7%) renders a positive real return of 7%. When also you ponder converting USD into a weak Yuan…….Whoa !!!

If those index examples are not enticing enough or too risky, then individual equities may offer a better return whilst possibly taking less risk.

There are companies with terrific franchises trading at P/E ratios of 8 (or an earnings yield of 12%) with real businesses, hard assets and have little to no debt.

Instead I’ll look at companies that have real businesses, with hard assets and current cashflows. The ones which don’t have any debt or only a little.

The ones with P/E ratios below 8.

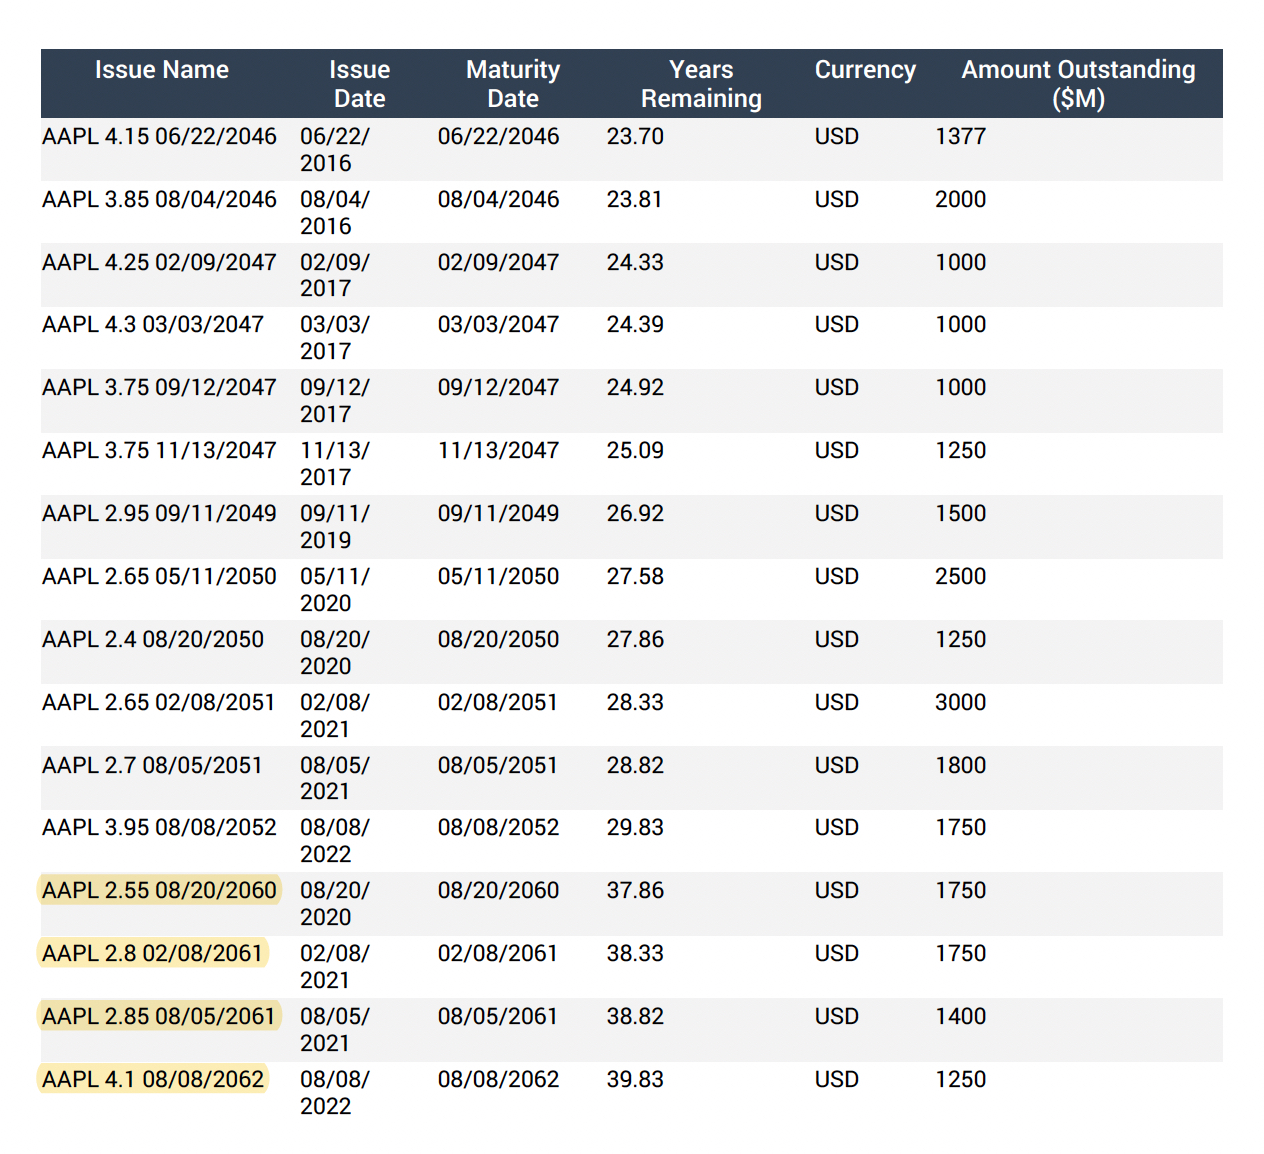
And if they have debt, some of them issued their bonds cleverly such as Apple’s recent 40 year maturities on a yield of 2.8%. This implies that Apple Inc. is more creditworthy than the U.S. Government.

I like the the type of companies whose businesses are solid and don’t rely on the ‘kindness of a stranger’ to use them. Companies who may have market share or pricing power. Where they have balance sheets and income statements which suggest that one year of EBITDA (even if its discounted and reduced) would easily cover all of its debt, where its current assets could pay off the whole of its total liabilities or where I don’t want to pay too much for an inflated amount of goodwill.

With a little more movement in markets and adjustment in corporate valuations, equities could once again carry the moniker of T.I.N.A. …….There Is No Alternative.

More so, with all this cash sitting around earning negative real returns.

October 12, 2022

by Rob Zdravevski

rob@karriasset.com.au

Semi’s are closer to the end of the move

Many are watching the great semiconductor shake-out.

The warnings of fervour and a peak where evident 15 months ago.

Speculators were playing in rarefied air when the SOX Index was flying between 3,400 and 4,000.

Today, it’s trading at 2,275.

Nvidia is one but not the only proxy for calling an end of the decline.

Seeing NVDA shares trade at $105-$108 may be a point to heighten my awareness to some form of exacerbation or trough in share prices of various semiconductor stocks.

October 11, 2022

by Rob Zdravevski

rob@karriasset.com.au

You won’t buy them on a P/E of 11

I’m reminding myself to be ready to buy great franchises at valuation multiples that you seldom see.

Microsoft may be one of those.

If the price trades down to the $216 mark, the price action makes me comfortable that the stock has noticeably mean reverted to its 200 week moving average and has traded to 2.5 standard deviations below its weekly mean and registered a weekly oversold reading.

At $216, MSFT would be trading on a forward P/E ratio of 18.

One doesn’t see MSFT trade at 18 times earnings too often.

October 11, 2022

by Rob Zdravevski

rob@karriasset.com.au

AUD/USD – it’s time

The next and perhaps last point for the AUD/USD in this last downward leg sits around 0.6210 (+/- 20 basis points)

The AUD/USD is entering a 5th moment of being Oversold in the past 8 years.

This can be paraphrased by saying we are in the vicinity and ‘it’s good enough’.

So, I’m selling some USD and buying AUD.

This currency low and pending reversal or reversion will also has have affect on assets such as Copper, Oil and Gold.

October 11, 2022

by Rob Zdravevski

rob@karriasset.com.au

It always remains about Oil

Did anyone find the irony and hypocrisy in the Biden Administrations disapproval over OPEC+’s decision to cut oil production quotas at their recent meeting?

President Biden et al. aren’t thrilled with the decisions, which should invariably send oil prices higher.

It did.

WTI Crude and Brent Crude rose 16.5% and 15% for the week, respectively.

So, does Biden actually want OPEC+ to pump, produce and export more oil?

But isn’t this against his climate policy?

Well, this is another hypocrisy of his.

It’s not a question about why he is releasing so much oil from the U.S. Special Petroleum Reserve. That answer is to win votes this November 2022.

But it inevitable that when more Oil is released, then more Oil is burned and used.

And this story goes round and round and round.

It’s relevant to identify the price-taker and who is the price-maker.

October 9, 2022

by Rob Zdravevski

rob@karriasset.com.au

Drill Rig count rises

The monthly Worldwide Rig Count is out from Baker Hughes

FYI, this data is a monthly census of “active” drilling rigs exploring for or developing oil or natural gas.

A modest global increase of 1.5% was seen from the previous month.

In the attached PDF I encourage readers to look at which regions are closing in on a similar amount of rigs ‘in action’ as see in February 2020. Some are nearly there.

It’s quite telling though.

The Europeans are lagging as they are curtailed by ESG influences.

Latin America needs petro-dollars more desperately than others.

The Middle East can refrain drilling in order to will higher prices.

While the USA is a hair away from their February 2020 levels, driven by political rhetoric of oil independence and a government customer needing to replenish their dwindling Strategic Petroleum Reserve.

Needless to say or see, the number of Oil and Natural Gas drilling rigs being put to work isn’t in a declining trend.

October 9, 2022

by Rob Zdravevski

rob@karriasset.com.au

Macro Extremes (week ending October 7, 2022)

The following assets (on a weekly timeframe) registered an Overbought or Oversold reading and/or have traded more than 2.5 standard deviations above or below its rolling mean.

Extremes “above” the Mean (at least 2.5 standard deviations)

TBX

Orange Juice

Overbought (RSI > 70)

U.S. Dollar Index (DXY)

U.S. 2,5, 10, 20 and 30 year government bond yields

German 2, 5 & 10 year government bond yields

British 5 year government bond yields

Spanish, French, British, Greek, Italian, Korean & Portuguese 10 year government bond yields

The Overbought Quinella – Both Overbought and Traded at > 2.5 standard deviations above the weekly mean)

TBT

Extremes “below” the Mean (at least 2.5 standard deviations)

Rotterdam Coal

CAD/USD

AUD/SGD

Oversold (RSI < 30)

Tin

Hot Rolled Coil Steel (HRC)

TLT

IEF & IEI

AUD/USD

GBP/USD

EUR/USD

NZD/USD

DKK/USD

SGD/USD

JPY/USD

ZAR/USD

KRW/USD

SEK/USD

IDR/USD

And Taiwan’s TAIEX equity index

The Oversold Quinella – Both Overbought and Traded at > 2.5 standard deviations above the weekly mean)

None

Notes & Ideas:

The big news for the week was that many equity markets posted a reasonable positive return for the week even following Friday’s drubbing.

For example, the Philadelphia Semiconductor Index (SOX) rose 2% for the week even after a 6% plunge in Friday’s trading session alone.

The second biggest news was that most of the energy complex (attributing much to the CRB Index percentages rise) had a cracker of a week with Gasoline, Brent, Heating Oil and Diesel rose somewhere between 15% and 26% in a single week……all except Gas, including Natural Gas which saw an intra-week low of $6.30 and closing in on my $5.00 target.

Dutch TTF Gas and the Japan-Korean LNG Marker have fallen considerably in past weeks.

Rotterdam delivered coal has tanked 34% in the past 5 weeks and now registered a move towards its lower end of the standard deviations pendulum.

Bond yields remain Overbought even though some eased off from last week’s highs (except for Gilts). There still seems there is time to accumulate government bonds, if they are part of your asset allocation.

And the persistent strength of the U.S. Dollar meant that a list of currencies ae trading at notable lows and weakness.

The AUD/USD closed at its lowest price in 2.5 years

The JPY/USD is at it weakest level since August 1998, while the AUD/JPY is 7% weaker from its heights and extremes reported weeks ago.

Hong Kong related/linked equity markets bounced following last week’s Oversold readings

Brazil’s BOVESPA has risen 22% since its July 11 2022, low. All this in the midst of a contentious Presidential election and rising interest rates?

In fact, on September 22nd, 2022, Brazil’s central bank decided to keep its rates unchanged following 12 consecutive increases which commenced in early 2021.

And lastly, the Baltic Dry Index has risen 81% in the past 5 weeks.

The larger advancers over the past week comprised of; 

Aluminium 6.4%, Bloomberg Commodity Index 5.1%, Baltic Dry Index 11.4%, Cocoa 1.8%, China Coal 8.1%, WTI Crude 16.4%, Gasoil 26.6%, Lean Hogs 4.2%, Heating Oil 19.3%, Lumber 5.5%, Platinum 6.8%, Gasoline 15.4%, Sugar 5.7%, Silver 6.4%, CRB Index 6.5%, Florida Urea 2%, Brent Crude 15.3%, Middle East Urea 5.7%, Silver in AUD 6.5%, Silver in USD 5.8%, Gold in AUD 2.7%, Gold in USD 2%, KBW Banks 1.8%, CAC 1.8%, DJ Industrials 2%, DJ Transports 3.5%, HSCEI 2.7%, Hang Seng 3%, Bovespa 5.8%, KOSPI 3.6%, S&P Midcap 400 2.9%, Nikkei 4.6%, Oslo 3.1%, Russell 2000 2.3%, SOX 2.2%, TAIEX 2.1%, Istanbul’s BIST 12.1%, S&P SmallCap 600 2.6% and Australia’s ASX 200 4.5% (although I expect 2% of that to be erased during this Monday’s session in reaction to U.S. action seen on Friday).

The group of decliners included;

Rotterdam Coal(17.1%), Hot Rolled Coil Steel ‘HRC’ (3.6%), JKM (11%), Tin (2%), Dutch TTF Gas (17.3%), Oats (2.8%), Rice (2%), Wheat (4.5%), Shanghai Composite fell 2%.

October 8, 2022

By Rob Zdravevski

rob@karriasset.com.au   

Story telling about current markets

I have attached a presentation I have been giving over the past 2 weeks.

It’s where I talk and try to put into perspective where the pendulum currently is, within the current market goings-on.

I touch on extremes in pessimism and sentiment measures, surveys and ratios.

Followed by a brief visit showing the extremes in interest rates. The corollary is that the rising cost of capital crimps profit margins and crucified valuations of equities whose cashflows and profits are years from materialising. So the pondering is what if these rates temper and abate?

I show you that forward consensus earnings estimates are moving lower and that P/E Ratios aren’t demanding, especially if you exclude the still overvalued “growth” and unprofitable companies.

I spend a little time chatting about currencies and the extremes that many are sitting at.

Then I move onto bond yields and yield spreads.

You’ll see that many equity indices are at their lower ebb.

and I finish up marrying up moments when commodities are undervalued compared to equities.

Of course, there is more to this analysis (than looking at P/E ratios) and ultimately narrowing down investment decisions, but it reminds me that much is nearer to the bottom than the top.

I paraphrased that last sentence in my recent newsletter, which was title, “Preparing for the last decile”

October 7, 2022

by Rob Zdravevski

rob@karriasset.com.au

Awaiting a SOX buying moment

The SOX index has traded down to 2.5 standard deviations below its rolling weekly mean and registered
an Oversold weekly reading on 3 occasions in the past 15 years.

I’m awaiting a 4th occurrence

October 7, 2022

by Rob Zdravevski

rob@karriasset.com.au

Following a $10 bounce, Oil is now a marginal trade

Further to today’s note about Oil, OPEC and Oversold break-even inflation rates…….

This note told you,

…..when Oil hit my long-standing lower target of $77.50 (trading to $76.25 intra-day).

That was 7 trading sessions ago and it coincided within the Oversold weekly reading for the 5 year break-even inflation rate.

Oil has bounced $10 since then.

Today, Oil has a short term upward trend developing,

but its only a trend.

At $87, it’s in no-mans land.

It could go $13 up or $13 down.

With new money, it’s a marginal trade or position to take.

Following a couple weeks of trade, I’m betting that WTI Crude sees $74 before it sees $100.

October 6, 2022

by Rob Zdravevski

rob@karriasset.com.au