American inflation rates tells OPEC when to cut production
October 6, 2022 Leave a comment
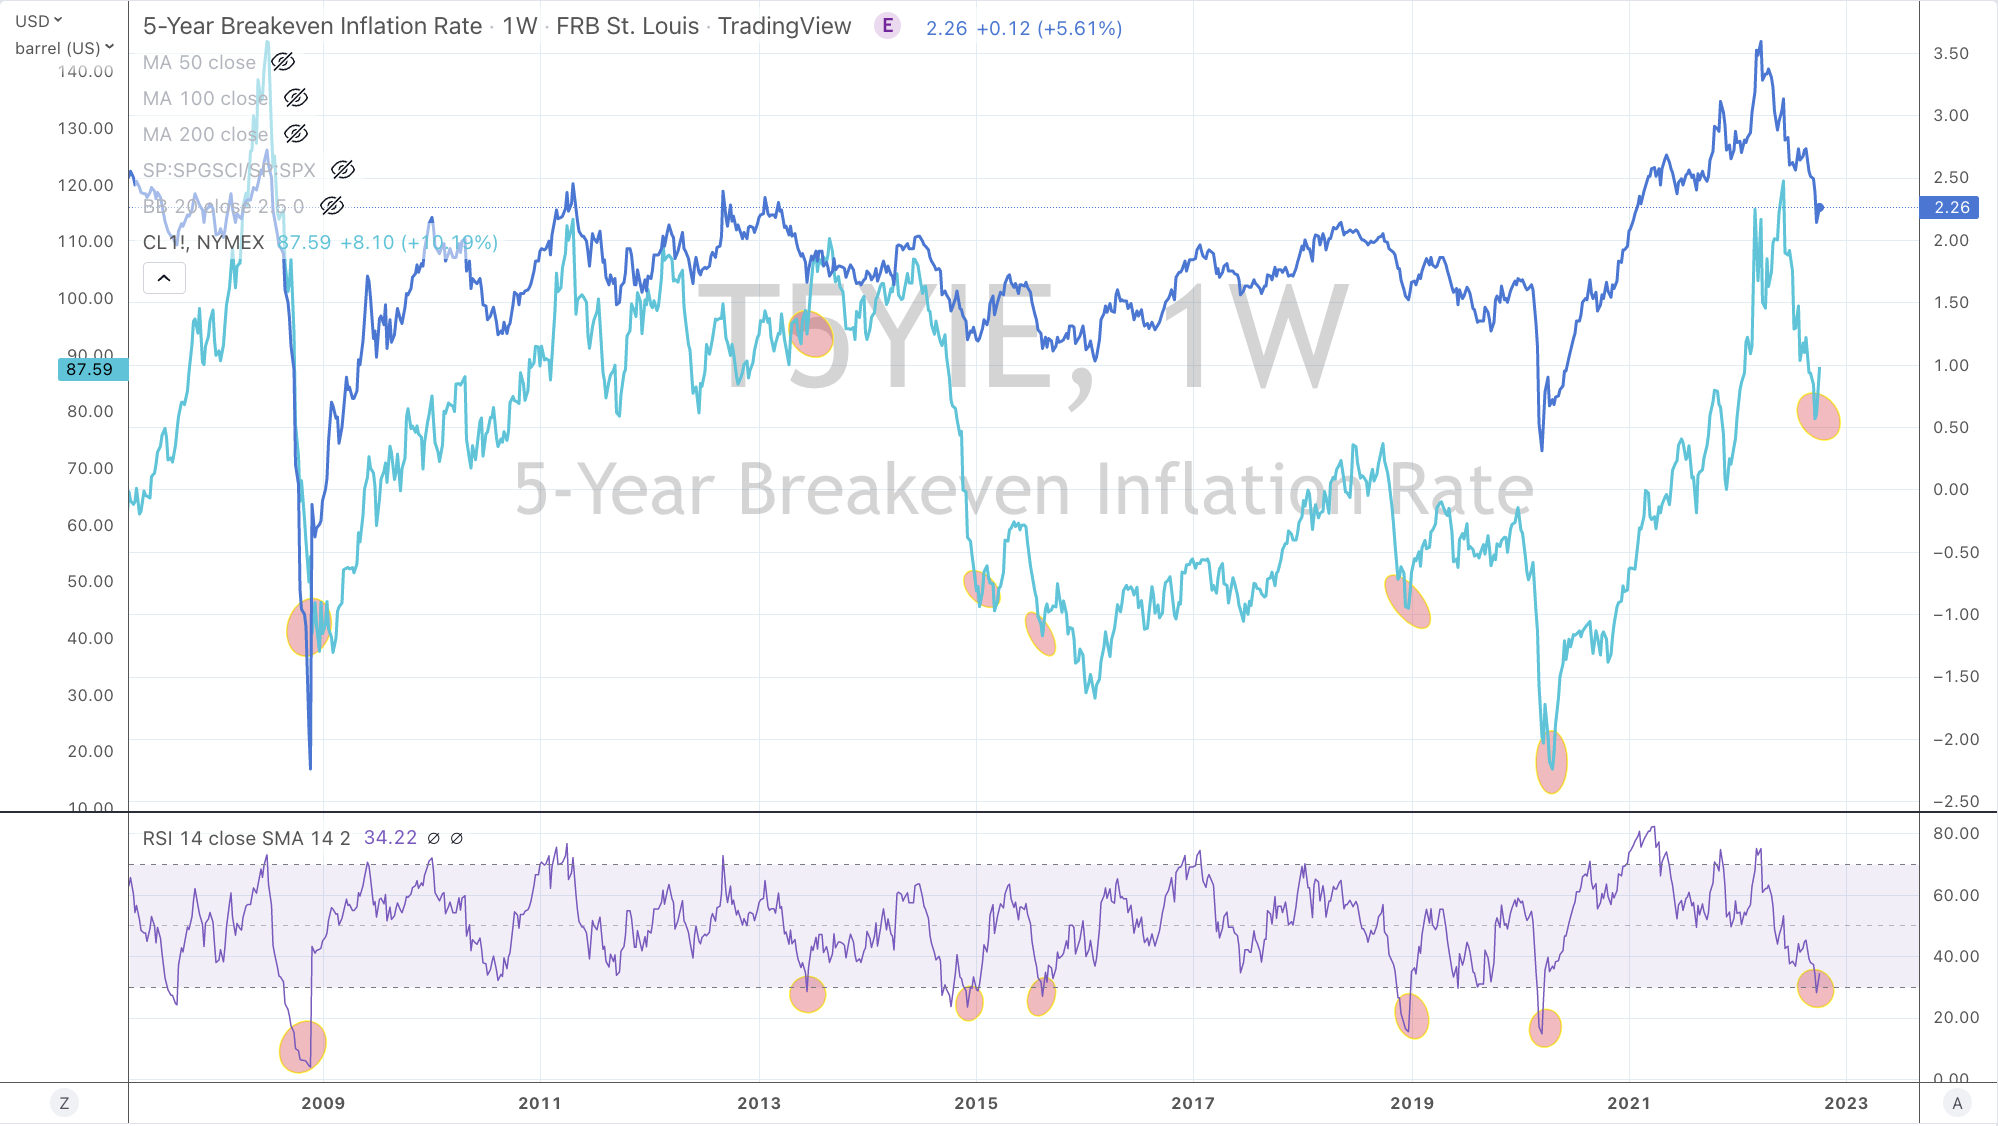
Here is a lovely chart showing the price of WTI Crude compared to U.S. 5 year break-even inflation rate.
To which the St. Louis Fed says about the latter, ‘the value implies what market participants expect inflation to be in the next 5 years, on average.’
Each value dance wonderfully together.
The better part of the chart is the lower bit where the RSI (Overbought/Oversold) indicator appears.
Whenever the 5 year breakeven inflation rate is Oversold (as this weekly chart shows), the WTI Crude Oil price finds a floor from which to advance.
We saw an Oversold 5 year b/e rate last week.
This week’s OPEC production cut announcement wasn’t a surprise because this Oversold moment in the U.S. 5 year break-even inflation rate tends to coincide with OPEC announcing production cuts.
Of course, Biden isn’t happy that OPEC have cut production.
Furthermore, Biden has virtually released all of the nation’s Special Petroleum Reserves. While he probably thinks it was his strategy sending Gasoline prices lower, when it was in fact a combination of other falling commodity prices (which is deflationary), mean reversion in the oil price and rising credit forces at work.
No to mention the importance of Biden needing lower domestic petroleum prices to aide his mid-term election hopes.
OPEC’s production cut may seem to be mathematically synchronised to the United State’s own inflation break-even rates but I think it is equally loaded with a little political payback.
Funnily, the U.S. isn’t pleased with this announcement and have passed on their views but it’s difficult to have a say into a club of which you’re not a member of.
Keep in mind, this study doesn’t assist the decision of when to sell your Oil.
There are other indicators for that.
October 6, 2022
by Rob Zdravevski
rob@karriasset.com.au