Short Bitcoin Call

A quick note to followers – Making a call, Short Bitcoin at current price of $9,320.

Targets are $8,300, then $8,170 and $7,200

Will add to the short at $9,430.
Stop loss will be set at $9,600.

A break in AUDJPY below 0.7160, then 0.7130 aids the short thesis, which includes plenty of cross-asset correlations.

#bitcoin #btc #crypto #cryptocurrency

June 12, 2020
by Rob Zdravevski

Subscribe to my blog: www.robzdravevski.com
Drop me an email: rob@karriasset.com.au
and seek advice or see my Disclaimer link on my blog site

Why has oil doubled?

Would you like to know why the oil price has doubled in the past 6 weeks?

The number of oil drilling rigs in operation has halved….

https://rigcount.bakerhughes.com/static-files/371ff33e-7b57-4d90-bb4b-69b3dff45201

New Macro Calls – Short AUD, Copper, Silver, Oil & Gold

June 8, 2020

by Rob Zdravevski

My new macro trade calls are;

Short AUD vs USD – its currently 0.6973. I first called this short at 0.66 on May 28th, 2020.

Short Oil (Brent is currently 42.90) – Brent today hit $43 target I mentioned in a note dated May 25th, 2020.

and I’m still Short Gold in USD, its currently $1,691

(see my original note, from May 4th, 2020, https://www.linkedin.com/posts/robzdravevski_gold-activity-6658641245285433344-OrN9

A break below $1,645 suggests USD Gold’s downtrend transfers the from a Short-Term to Medium Term timeframe.

But in light of expected AUD weakness, Gold in AUD is likely to be near its floor.

Currently its A$2,420, some probability of an overshoot to A$2,365, a further 2.2% lower from here.

Put another way, the decline in XAUAUD price should slow due to a falling AUD.

For example, a USD Gold price of US$1,551 (my initial downside target) and AUD FX of 0.6660 (its rolling daily mean and 20 day moving average), would put the XAUAUD at $2,329. Hardly a tragic collapse.

Furthermore, Platinum (in USD) is heading lower. Currently its $842

While Silver peaked on June 1-2 at the $18.90 mark, currently its $17.72.

A break below $17.30 aids the greater short commodity trade thesis.

Copper ($2.55) should turn lower. The manner (price action, accumulation, volume) of its recent break above the $2.46-$2.48 resistance hasn’t convinced me of a new higher, stronger leg.

Now to figure out how my views will affect certain stocks and also what other opportunities present themselves.

For example, I may be selling Woodside & BHP.

To be clear, these “calls” start life as short term views, which I typically categorise in a 3-6 week timeframe. Then, I start thinking whether they morph into a medium term call which usually means a period lasting 6-14 weeks.

An added note to these calls is that over the longer term, I remain bullish on Oil.

Read more at this link, https://robzdravevski.com/2020/05/25/overall-bullish-on-oil/

Subscribe to my blog: www.robzdravevski.com

Drop me an email: rob@karriasset.com.au

Disclaimer

Illusions abound

The rally in equity indices (which troughed on March 23, 2020) has created a fascinating observation of investor behaviour and cognitive biases.

For context, the ASX 200 produced 74% of its rally return before May the 1st.

The index rose 26.5% from March 23rd – April 30th (5 weeks) and has since climbed 9.5% from May 1st – June 4th, for the next 5 weeks.

As you can see, it did most of the work in the first 5 weeks following its low.

The second half has felt like an illusion that it moved up each day.

In fact, the ASX 200 was “flat” from May 1st until May 22nd. It rose 9% in the past 9 trading days.

While the S&P 500 rose 32% in the 5 weeks from March 23 – April 30 and its advance for the next 5 weeks was also 9%. A sharp rise of 12% occurred over the past 14 trading days.

June 5, 2020
by Rob Zdravevski

What’s catching my eye….

Rob Zdravevski

3 June 2020

by Rob Zdravevski

Principal & Investment Advisor at Karri Asset Advisors


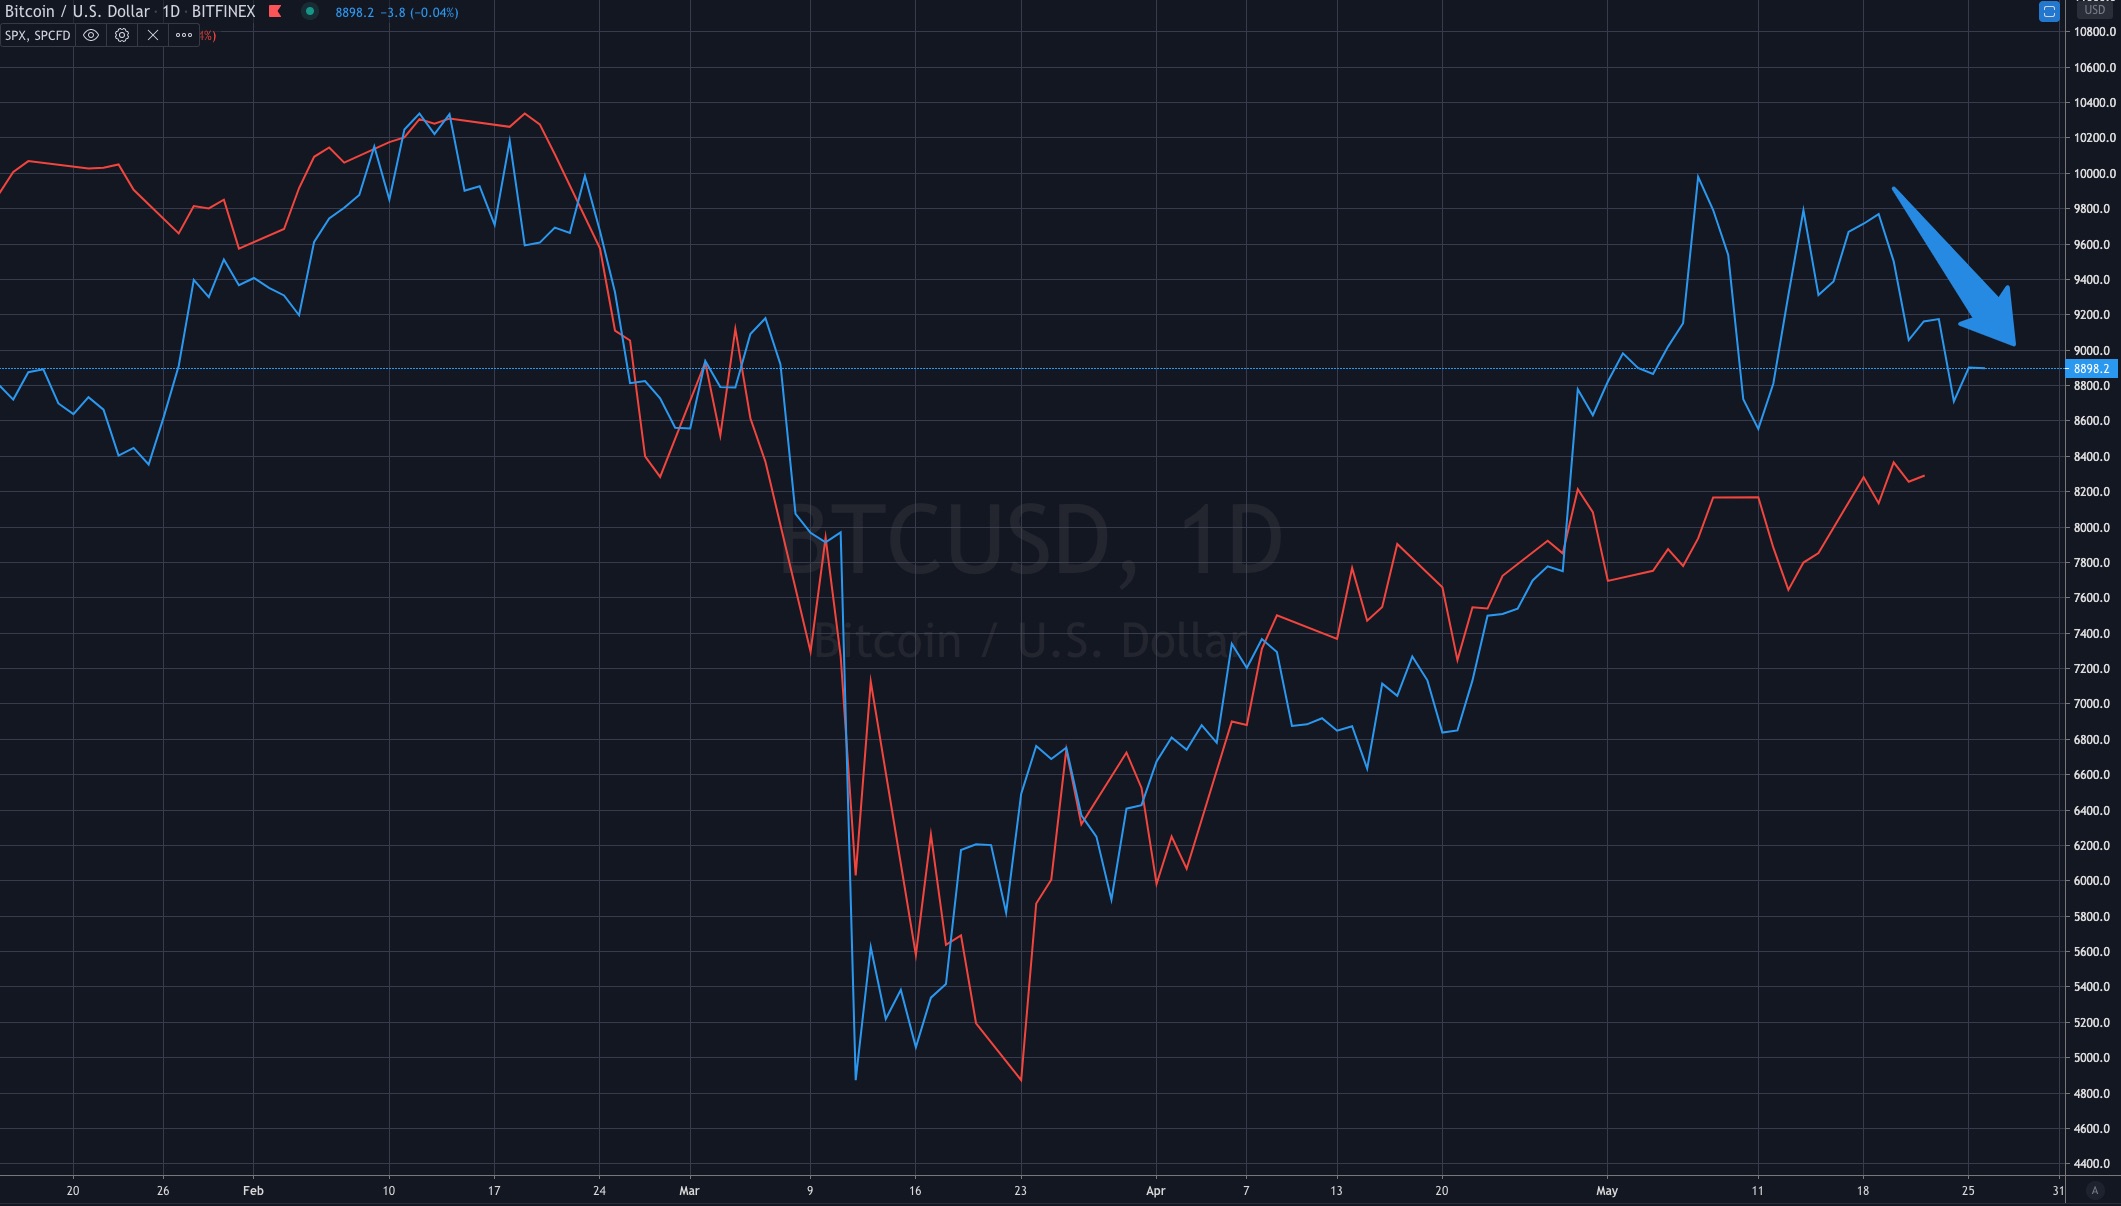
Bitcoin fell $700 (7%) overnight – see my previous comments about its correlation to the S&P 500

The S&P 500 is 9% below its all-time high yet the VIX has a reading of 27.

I would expect a VIX of 17 or 18 at this sort juncture following a rally after such a plunge.

Currencies are moving 3%-4% in the past few days while the FX VIX on major currencies remain subdued around the 7 mark. There is a disconnect.

Volatility in currencies tells me that things are not all sailing along smoothly, although not being reflected in the VIX

Today’s AUDUSD upward move to 0.6983 represents a 3 standard deviation move above its rolling daily mean. Not something you see often.

And there is a host of cross-asset analysis that I have also explored which has lead to positioning client portfolios being Net Long 45% by the end of May.

During the month of May, portfolios were re-balanced, profits taken, some losses were realised, cash was raised and some hedge protection placed.

Portfolios are now 50% long securities, 50% cash and 5% short.

About the 50% cash position……..I have always believed, in the absence of value, cash is a reasonable default position and it’s also the best natural hedge.

At this moment, I’ll also reiterate my “market top” call made on May 27th, 2020.

It’s OK if you tell me if I’m wrong but at least allow more than a few days for a thesis to be disproved. 🙂

And to put any hedge commentary in context, it’s not an all-in equities short, as the aforementioned portfolio composition suggests.

In fact, portfolios and clients are conditioned towards being long term investors in specific company shares.

The returns of some stocks within our client global portfolios (since May 1st, 2020) have been extraordinary with some examples of those stocks being;

Spotify 30%, Docusign 42%, Experian 23%, Google 10%, Barclays 18%, BHP 21% and Westpac 18%.

To conclude, my two main observations are……

  • investors are Short Patience and Long Complacency

and

  • it doesn’t seem much work or research is being done lately before making an investment

Subscribe to my blog: www.robzdravevski.com

Drop me an email: rob@karriasset.com.au

Disclaimer

Distorted Expectations

May 28, 2020
by Rob Zdravevski

It seems that stockmarket investors are Short patience & Long complacency.

To boot, many now expect daily returns of 2% or more;

which is perfectly fine is you’re a beneficiary, however, in an environment of 1% cash rates, it’s with a gentle reminder that should your equity portfolio investing produce a return of 6%-8% per annum above the cash rate, then you are generally doing quite well….especially if you’re being honest about the risk you are taking to achieve this.

As an investment advisor, it’s concerning to me that some consider it all wrack and ruin if they can’t “crank” out 6% in one week.

That’s why this current equities rally is really messing with people. It may do a real number on the newcomers.

The continual conundrum in capital markets is….that often markets move to where they can do the most damage, and for the past 2 months that direction has been “up”.

What’s next?

Sell AUD / Buy USD

If you’re a bit global and holding Australian Dollars,

selling AUD and Buying USD around its current price 0.6600 is something to consider.

As always, do consult your investment or family office advisor.

May 28, 2020
by Rob Zdravevski

Also Calling a Top in the S&P 500

May 27, 2020

by Rob Zdravevski

Following on from my posts about markets being at an acute point and yesterday’s note of calling a “top” on the ASX 200 at 5,780,

…..in Tuesday’s May 26, 2020 session (last night for us in Asia-Pacific), the S&P 500 also traded in a manner accordingly of a market “top”.

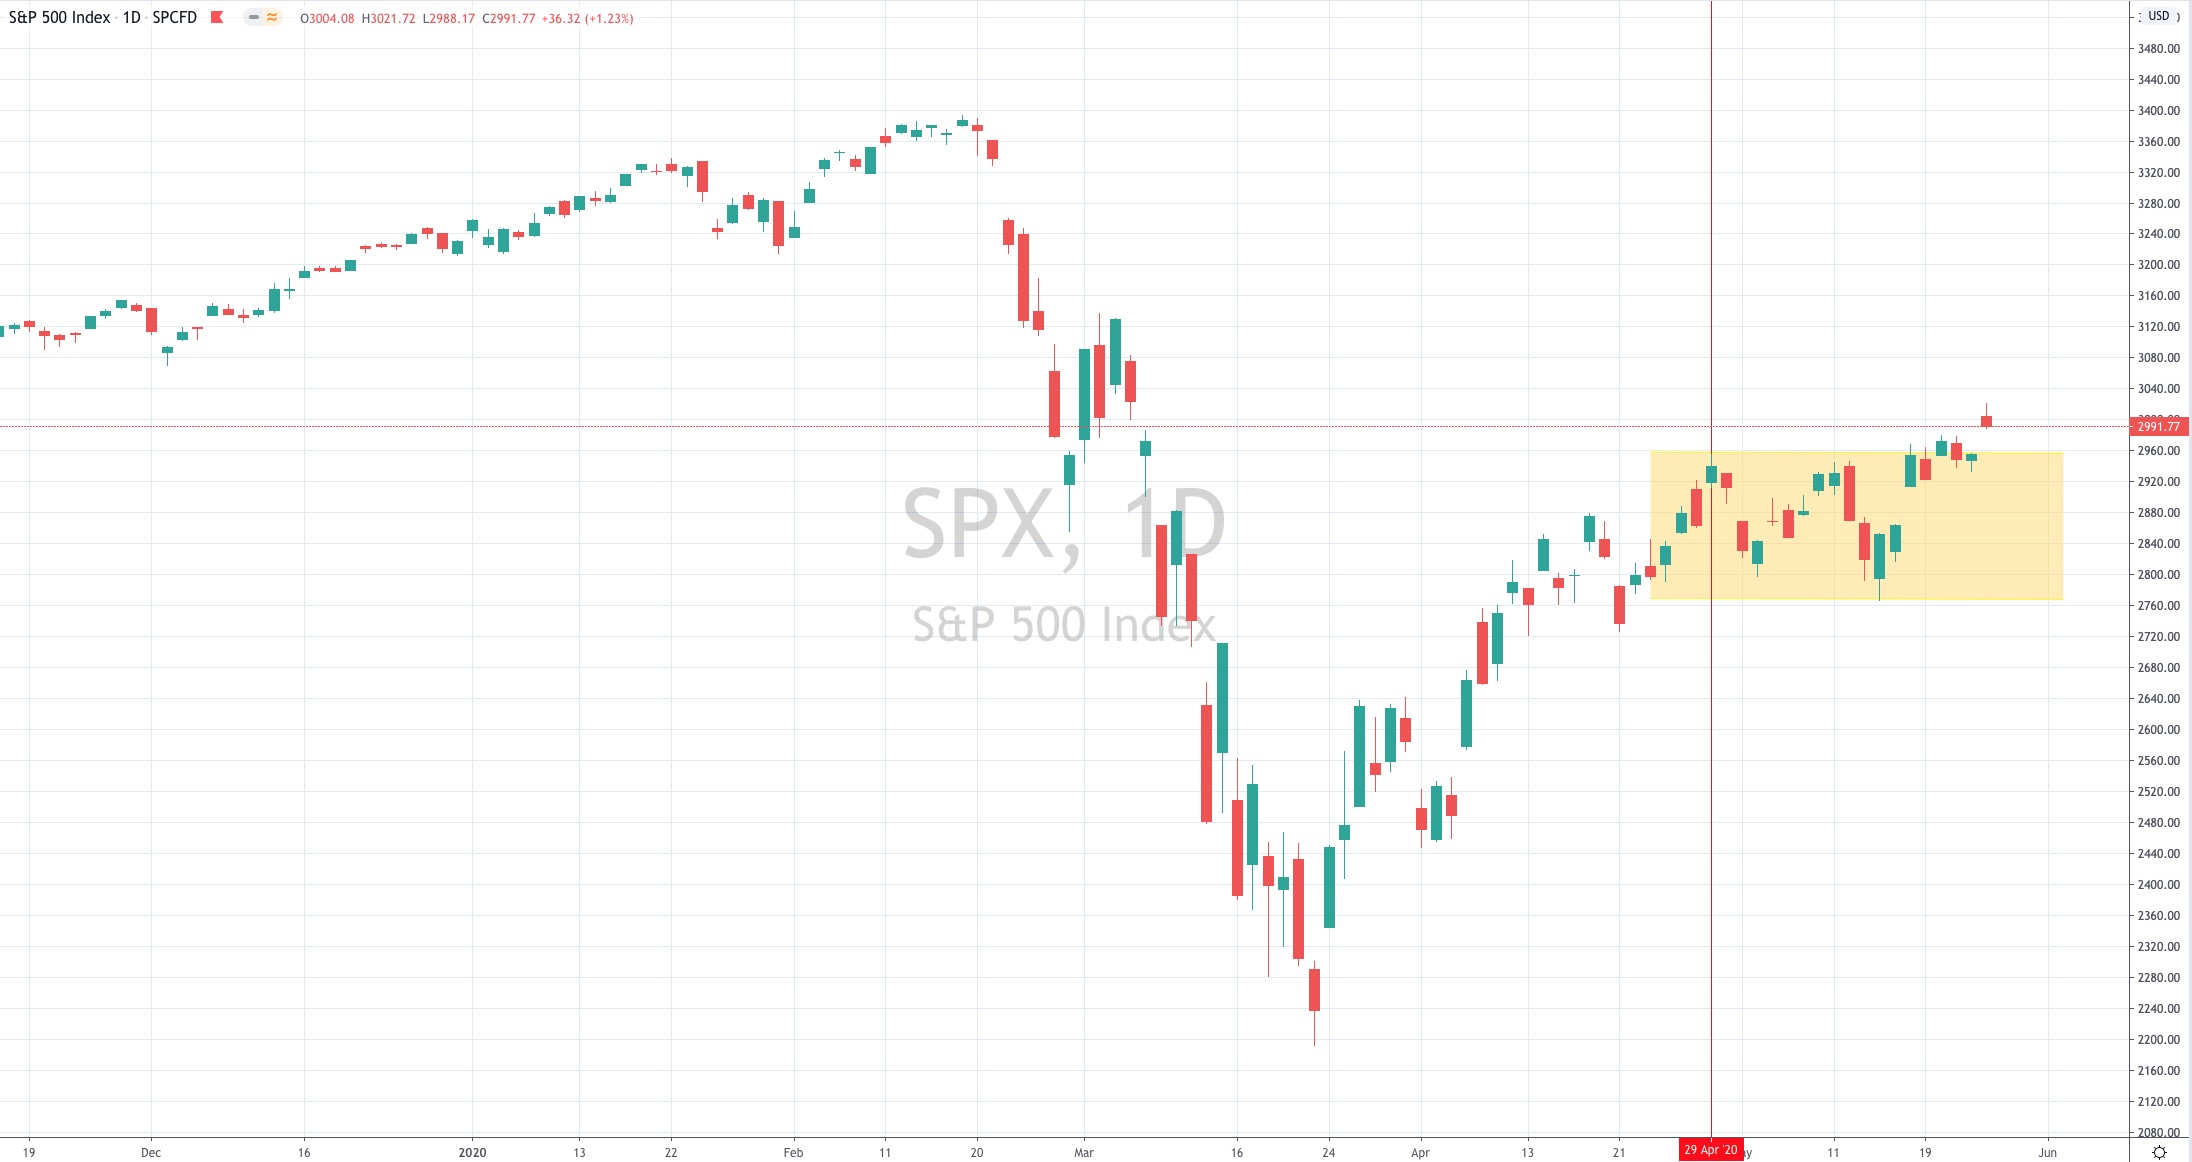
It’s intra-day high was 3,022 and closed at 2,992.

Keep in mind that a market top is not the confirmation of a new declining trend. That bit needs to come later.

For now, the S&P 500 “kissed” but didn’t close above its Weekly 50 day moving average (dma) and the same for its Daily 200 dma, all the while the Daily 100 dma crossed beneath the 200 dma 2 weeks ago.

This coincided with it trading 2 standard deviations above its Daily rolling mean.

Also, my trend indicators showed that the recent 8 day spurt was not done with strength nor with adequate volume.

Furthermore, the Banking, Transport and Russell 2000 traded in a manner and to certain levels which helped form this “top” call.

The 2 month rally was clearly performed within a medium term bear trend.

At various times there are things you own and things you rent.

The equity rally from the March 23rd, 2020 low was something you “rented”.

By the way, 94% of the rally from the March 23, 2020 low of 2,192 was seen in the first month.

For the next month (between April 29th until today, May 26, 2020) it see-sawed in a 7% range throwing many head fakes at either end. (see the chart in the headline banner)

Psychologically, equity markets tested the impatient, it drove the fundamental one-dimensional investor nuts and seemed to turn some into forced buyers.

For the most part, the rally hasn’t been about fundamentals. It has been about money flow, liquidity and behavioural science.

Ideas are one thing but execution is everything.

I’ll report back to tell you how the trades work out.

On other notes of interest;

  • my call on a lower Gold price is intact and gradually confirming itself,
  • many are “long” complacency…..should you buy insurance, particularly when you don’t think you need it ??
  • Looking for lower AUD/USD once its done peppering 0.6658 (an overshot to 0.6710 plausible),
  • Still bullish on Oil,
  • I’m keeping a close eye on Copper (the bias is short as it still can’t break above $2.46),
  • Bitcoin is acting like a leading correlation to the S&P 500,
  • And I’m ploughing through various stock ideas

Until next time,

Rob

rob@karriasset.com.au

http://www.karriasset.com.au

A Picture Of Crude Oil Reserves Tell Me A Thousand Words

What is this Crude Oil Reserves graphic saying to me?
It tells me that Australia is a minnow and it’s more of a LNG nation.
It tells me why integrated European and American oil companies enter joint ventures in foreign lands, ’cause that’s where the oil is.
And the U.S. is playing an interesting game of being the worlds largest oil producer against reserves that don’t suggest that status being sustainable.
Prior to the March 2020 collapse in oil prices, the U.S. was pumping a world leading 15 million barrels per day.
If the U.S. reduces daily production to let’s say 12 million barrels (not because Trump thinks he can force privatised companies to do so but more so relating to the global supply glut), then when dividend into their reserves of 37 Giga barrels, the United States will have 3,083 days or 8.4 years of reserves left.
That’s acute enough to create tension across politics and the oil price.
Incidentally, Saudi’s daily production is 12 million barrels.
– May 26, 2020, by Rob Zdravevski
No alternative text description for this image

Activate link to view larger image.

Bitcoin & SPX correlation

Doesn’t Bitcoin (the blue line) seem to have a leading correlation to the S&P 500 ?