Looking for a 15% decline in ASX 200

Today, the ASX 200 closed at 6002.

I am watching if the index will trade lower to “fill” the following “gap-ups”,

5918, 5803, 5604, 5394, 5055 & 4701.

Those are declines of 1.4%, 3.3%, 6.6%, 10.1%, 15.8% & 21.7% respectively.

I’m betting on it trading closer to the 5,055 level.

20 July, 2020
by Rob Zdravevski
rob@karriasset.com.au

Acquisitions with no premium

Some months ago, I wrote about a M&A theme of where the “big become bigger”. I also continued to say that “quality will buy quality”.

In Chevron’s case of buying Nobel Energy, I’m not quite sure if they are buying quality, although as the FT article link summarises, at least Chevron didn’t rack up huge debt trying to buy Anadarko last year, while the winning bidder, Occidental, now struggles with that liability.

The other part of my M&A theme musings was also a prediction that forthcoming acquisitions won’t be necessarily require paying a premium and that “take-unders” may be more common that a “take-over”.

Chevron was close in this regard. It is buying Noble’s stock for $10.38 per share, which is only a 7.5% premium to its previous days closing price but quite a discount to its $35 price it was trading at 2 years ago.

https://on.ft.com/3fOlKKT

Equities – The Fertile Habitat

by Rob Zdravevski

July 15, 2020

Hello everyone,

Many think that the stockmarket is overpriced or even expensive !

Today, the forecast consensus Price to Earnings (P/E) ratio for the S&P 500 is 22.

The average P/E for the S&P 500 over the past 140 years has been approximately 15.

Yet I think that equities may be the only game in town.

I’d like to introduce you to the Earnings Yield.

https://www.investopedia.com/articles/investing/120513/comparing-pe-eps-and-earnings-yield.asp

The Earnings Yield is the reciprocal of the P/E Ratio

And so, the Earnings Yield of the S&P 500 Index is 4.5%.

In comparison, the yield for the 10 Year Treasury Bond or the “risk free rate” is currently 0.63%.

This means the S&P 500 is offering a return of 7 times more than the return for doing “nothing”.

Such a multiple hasn’t been seen since World War 2.

I’m trying to highlight a fertile habitat for investing.

For some recent context, in September 2011 (once the market cratered and then stabilised following the 2008-2009 Financial Crisis), the forecast P/E for the S&P 500 was 10.5 and so its Earnings Yield was 9.5%.

Comparatively, the 10 year bond was yielding 1.9%

At that historic nadir in stock prices, the market was offering a return of 5 times above the risk free rate.

Then the S&P 500 more than doubled in the next 7 years.

And more recently, in December 2018 (somewhat before a further 31% spurt in the S&P 500 Index over the next 14 months), the Earnings Yield of 6% (because the P/E was 16.8) was only twice that of the 3.1% 10 year Treasury Bond Yield.

Incidentally, that 3.1% 10 Year Bond Yield was the highest interest rate seen since June 2011.

The current “spread” which I mention in the opening paragraph coincides with my blog post about the real bull market may yet to be seen.

https://robzdravevski.com/2020/05/20/bull-markets-you-aint-seen-nothing-yet/

p.s. the forecast for the S&P 500 in 2022 is lower than 22, which mean a higher Earnings Yield.

rob@karriasset.com.au

Copper is the only extreme I can find

The only “extreme” I am finding amongst the macro cross-asset world is in the rising price of Copper.

Accordingly to my analysis, the price of Copper ($2.86) remains at extended and extreme levels and start to decline.

The traders amongst us may choose to take a “short” position, while others may ponder who will be the beneficiaries of lower Copper prices.

Although not at an extremes, a new trend is developing suggesting lower yields for the U.S. 10 Year Government Bond.

And so, I want to bring to your attention the wonderful correlation the Copper to Gold Ratio has compared to the U.S. 10 Year Treasury Yield.

In the past 2 weeks, the metals ratio is diverging and moving in the opposite direction. I believe this ratio will mimic the bond markets pattern soon and with a new trend suggesting lower yields in the 10 Year, this means either Gold falls at either a proportionate rate or greater than my predicted decline in the Copper price.

10 July 2020
by Rob Zdravevski
rob@karriasset.com.au

ASX 200 not breaking highs

One month ago (on June 9th, 2020) I wrote the post below.
The ASX 200 has not traded higher than that June 9th high of 6,198. Today it’s 4% lower, however many market watchers seem to think we have been barrelling into new highs each day.

Although I’d like to note that the stocks I was selling as listed in the original post have all declined between 10% and 20%.

I am not advocating a trading mentality but rather, when you have conviction in your opinion, there are times when you need to protect your capital.

July 10, 20202
by Rob Zdravevski
rob@karriasset.com.au

**************************************
To be on the record for followers of my posts, today, with the ASX 200 reaching a 62% retracement of the recent peak-to-trough move, I’ve been a seller of the following Australian shares.

BSL $12.88; CWN $10.77; DOW $5.30; EVT $9.85; ILU $9.21; ORG $6.45 and WBC at $19.80.

I also lightened up some positions on Friday June 5th and around May 27th, which is where the vertical dotted line on the attached chart marks the 50% retracement of this rally.

Today, my view is that the index’s advance over the past 8 trading days (since my May 27th “market top” call) constitutes an “overshoot” or lurch amongst low volume and driven (dangerously for many an investor) by momentum rather valuation coupled with fund managers playing “catch-up” due to relative underperformance concerns.

How are you going to explain the next mean reversion to your Mum based on that reasoning?

I’m wondering where are the prevailing tailwinds ?

But on a more actual note, my cross-asset technical readings suggest prices are at extremes and others signal a “topping” process.

Some stock prices are back to their March 6th-9th levels while the better “gift” is that some are back at their Feb 25th prices.

This looks like quite a nice “get out of jail free” card all within 3 months.

June 9, 2020
by Rob Zdravevski

No alternative text description for this image

Activate link to view larger image.

Assets revert to the Natural Owner

There is such a thing as a natural and unnatural owner.

Throughout the business cycle it seems inevitable that assets change hands between a “natural” to the “unnatural” owner and revert again to the “natural” owner.

What do I mean by this?

When doctors and lawyers buy vineyards, sure and soon enough they end up selling them back to the seasoned wine operator.

Sometimes people are romanced by starting, owning or buying a business which they have no business being involved in.

This can also include people who shouldn’t be in the stockmarket or own multiple residential dwellings in order to become high-flying landlords or starting a restaurant.

I’d love to hear some of your examples.

A recent conversation which started up while drinking beer with friends was relating to the housing grant stimulus being offered and a coming “boom” in new home starts.

One of the pre-requisites to receiving or qualifying for the grant, was that a slab (concrete foundations) needed to be laid by the end of December 2020.

So, my buddies start talking about getting into the concreting business.

I interrupted and asked “what the hell do you blokes know about concreting?”

Their reply was along the lines of, “what’s to know?” and “its easy”.

I needed to chime in and remind them that the guys which you see in the business today, actually belong there.

They are the “natural” owners of those businesses.

They’ve been talking concreting with their “old man” over the dinner table for years.

They know the costings, pricing and margins better than any of us.

I’m not raining on anyone’s entrepreneurial parade but it seems obvious that certain businesses should be run and owned by those with a pedigree in that industry.

Pedigree trumps competence, finances and passion.

If your friend ever decides to invest in Alpaca Farming or a Forestry Schemes, start a Nail Salon or an online bikini company…….and they have no business being there, perhaps you should say something.

7 July 2020

by Rob Zdravevski

rob@karriasset.com.au

ASX 200 posts a financial year decline of 11%

In another edition of market illusions…..

It’s the time of year when Australians measure investment performance as our financial tax year (ending June 30th) has come and gone.

Some market watchers may think V-shaped rallies, overwhelming tech bullishness coupled with tsunami’s of fiscal stimulus should’ve equated to above average returns on equity markets.

Not necessarily the case…..

Between July 1, 2019 and June 30, 2020,
the S&P 500 recorded a 5.4% return,
while in AUD, it was 3.7%.

and deceptively, the ASX 200 posted a decline of 10.9%

Another topic for another day is why we draw the line on each quarter, calendar or fiscal year. Though I guess, we need to start somewhere in order to measure things.

July 6, 2020
by Rob Zdravevski
rob@karriasset.com.au

How Tesla paid for his Tesla

One of my clients (“John”) has always been interested in buying the new Tesla 3. In Australia, that car was being priced around A$73,000 or ~ US$47,000 depending on the FX rate used.

While the markets were plunging in March 2020, I told him about a story from over 20 years ago where a client (“Brian”) wanted to buy a Harley Davidson (HOG).

Instead of buying a Harley Davidson for $35,000, Brian decided to invest that same amount in HOG shares.

His strategy was that Harley Davidson shares could pay for his Harley.

Back in 1997, HOG shares were wallowing around the $10 mark. By Christmas 1998, the stock was trading at $20. At a price of $22, Brian had sold his shares.

Job done. A free Harley Davidson.

He recouped his original outlay. The profits were used to buy a new motorcycle and with a bit of money leftover to contribute towards his capital gain tax bill.

However, the story continues…..

15 months later (May 2000), HOG shares doubled again and are now trading at $40 per share and by 2004 they are trading a further 50% higher, at $60 per share.

Brian suffered from “Hindsight Bias”. He was annoyed about his decision to sell and thinks his $35,000 Harley is actually worth at least $180,000. He even pondered installing elaborate security in his garage to protect it.

Today (16 years later), HOG shares are trading at $23.

And so this brings me to “Tesla John”.

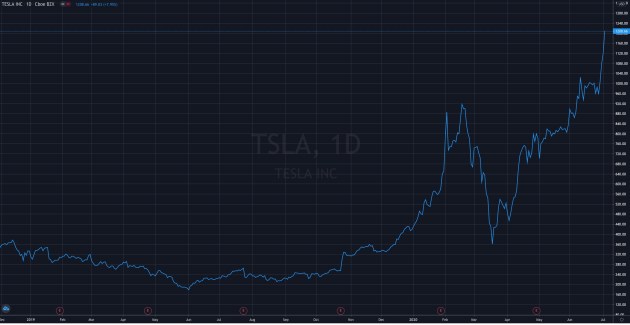
Instead buying a car, in early April 2020 he bought Tesla shares at $504 per share (not quite the $350 low seen 2 weeks earlier).

In early June (only 2 months later….), Tesla shares reached $1,000 and John “was out”.

A new Tesla 3 is due for delivery around September.

Today, the shares have roared a further 20% higher to $1,208 and are now the most valuable automobile manufacturer in the world.

What a wonderful and fun idea but I hope that John isn’t affected by the same cognitive bias.

July 3, 2020

by Rob Zdravevski

rob@karriasset.com.au
 

TSLA

Beware of illusions


Those who don’t watch markets closely might be fooled how the media is “framing” the scene.

The S&P 500 did have its best quarterly return in 20 years.
It rose 20%.

But it did most of that work in the first two months.
The month of June only contributed 2% of that return.

Contrarily, it seems that “non-professionals” have a feeling that the market is roaring higher on a daily basis.

It’s not and it hasn’t. The market is still the same price it was a month ago.

In fact, June 8th remains the “post-recovery” high seen in many global equity indices.

July 3, 2020
by Rob Zdravevski
rob@karriasset.com.au

No alternative text description for this image

Activate link to view larger image.

Apple’s Valuation in 2007 – Part Art and Part Science


In 2007, Apple was trading at $25 per share and it has a Price to Earnings (P/E) Ratio of 38.

Many may have thought the stock was expensive and that the company was possibly going mad.

Apple was about to compete with Nokia, Motorola, Siemens, Blackberry & Sony Ericsson and produce a mobile phone.

The first iPhone was released on June 29, 2007.

Well, earnings grew as did the stock price and the P/E ratio dropped.

Finding a bargain doesn’t always mean a low P/E ratio.

In Apple’s case, investors were looking at what the earnings were going to be, rather than what they have been.

Today, the stock price is $365 and its P/E is 30.

1 July 2020
by Rob Zdravevski
rob@karriasset.com.au

No alternative text description for this image

Activate link to view larger image.